Half Year 2016 Results Presentation - EYE CARE, WE CARE MORE - GrandVision
←
→
Page content transcription
If your browser does not render page correctly, please read the page content below

Half Year
                         2016 Results
                         Presentation

                           5 August 2016
EYE CARE, WE CARE MORE
Forward looking statements

 This presentation contains forward-looking statements that reflect GrandVision’s current views with
 respect to future events and financial and operational performance. These forward-looking statements
 are based on GrandVision’s beliefs, assumptions and expectations regarding future events and trends
 that affect GrandVision’s future performance, taking into account all information currently available to
 GrandVision, and are not guarantees of future performance. By their nature, forward-looking
 statements involve risks and uncertainties because they relate to events and depend on
 circumstances that may or may not occur in the future, and GrandVision cannot guarantee the
 accuracy and completeness of forward-looking statements. A number of important factors, not all of
 which are known to GrandVision or are within GrandVision’s control, could cause actual results or
 outcomes to differ materially from those expressed in any forward-looking statement as a result of
 risks and uncertainties facing GrandVision. Any forward-looking statements are made only as of the
 date of this press release, and GrandVision assumes no obligation to publicly update or revise any
 forward looking statements, whether as a result of new information or for any other reason.

                                                                                                            2
Half Year 2016 highlights
Revenue (€ million)
Revenue of €1,670 million 1,670
1,611
Growth of 6.7% at constant exchange rates
and 3.5% organic growth
Comparable growth of 2.3% (HY15: 5.2%)
HY15 HY16
6,211 stores as of 30 Jun 2016
Network expanded by 101 stores Stores
6,211
since year-end 2015 6,110
Improved profitability
Adjusted EBITDA1 up 6.5% at constant
exchange rates to €272 million Dec. 2015 HY16
(HY15: €259 million)
Adjusted EBITDA margin
16.7%
Adjusted EBITDA margin grew to 16.3%
16.3%
16.1%
(+65 bps to 16.7% excluding acquisitions)
EPS +8.0% to €0.46 (HY15: €0.43)
HY16 HY16
HY15
1 Adjusted EBITDA = EBITDA excluding non-recurring items (excl. acquisitions)
3
Second Quarter 2016 highlights
Revenue (€ million)
Revenue €867million 867
827
Revenue growth of 8.4% at constant
exchange rates (2Q15: €827 million)
Organic growth of 5.3% with a comparable
2Q15 2Q16
growth of 3.6% (2Q15: 4.8%), helped by
easier comparables and a positive selling day Adjusted EBITDA (€ million)
impact 150
136
Adjusted EBITDA growth
Adjusted EBITDA of €150 million up
from €136 million in 2Q15 2Q15 2Q16
Organic Adjusted EBITDA +10.7%
Adjusted EBITDA margin
17.3% 17.6%
Adjusted EBITDA margin +80 bps to 17.3%,
16.5%
driven by
Favorable sales mix (prescription glasses,
more Exclusive Brand frames)
2Q16 2Q16
2Q15
Cost discipline (excl. acquisitions)
4
Higher share of Exclusive Brand frames leading
to improved profitability
Exclusive Brand share increased more than 10pp in HY16
to nearly 70% of prescription frames, driven by
Improved assortment with strong style and technical
features
Strong in-store communication, merchandizing and
integration in the customer journey
Active brand portfolio management (reduction of lower-
equity third party brands)
Comprehensive staff training
Aligned incentive schemes
5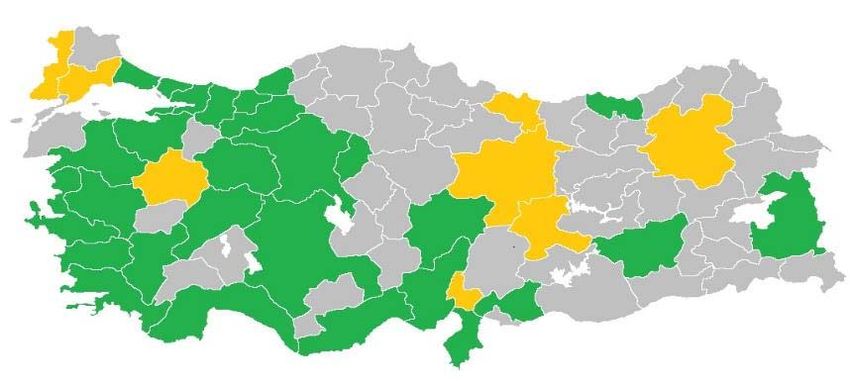
New Lens Tender supplier partnership agreements
leading to higher service and profitability
Lens Tender 2016 delivers price reductions, improvements in lens service level
and reduction of lead times
More harmonized lens portfolio reduces costs and complexity in the supply chain for both
GrandVision and suppliers (SKUs reduction of >50%)
New harmonized portfolio offers the widest ranges available, the latest technologies and
makes upgrade opportunities globally available (Blue protect, Driver lens, UV protect, etc.)
Shift to GrandVision Exclusive Brands for lenses delivers reduction in costs while offering a
differentiated, trusted solution to our consumers
GrandVision Exclusive Lens Brands:
6
Omni-channel update: Apollo Optik launches
online store in Germany
Germany is the first G4 country to pilot
GrandVision’s omni-channel platform
Apollo now with a combined nationwide
owned store network and online shop
Online features:
Product range: prescription glasses, and sunglasses
Buy online or try in store
Free delivery at home or pick up in store
Connection with store for additional services (online
booking eye tests, etc.)
Further development steps to follow
7
Strategic priorities

       Strengthen and deploy group’s global capabilities

       Drive further comparable growth

       Optimize the existing store network

       Expand in current markets, also through bolt-on acquisitions

       Enter new markets

                                                                      8
Segment
                         and Financial
                         Performance

EYE CARE, WE CARE MORE
Comparable growth development
Comparable growth is impacted by the timing of commercial campaigns, the level of
previous years’ comparables and the number of selling days
Strong comparable growth in 4Q14 and 1Q15 led to strong comparables in 1Q16, which
have moderated in 2Q16
2Q16 also benefited from a positive selling day impact related to the timing of Easter in
some markets (negative impact in 1Q16)
6.1%
5.5%
5.2%
4.8%
4.3%
4.1%
3.8% 3.7% 3.6%
2.3% 2.2%
1.6%
0.9%
FY13 FY14 FY15 1Q14 2Q14 3Q14 4Q14 1Q15 2Q15 3Q15 4Q15 1Q16 2Q16
10Segment Review: G4
HY16 Highlights G4 – key figures HY16 2Q16
Revenue growth of 2.9% at constant Revenue growth (constant fx rates) 2.9% 4.6%
Revenue growth (organic) 2.4% 4.1%
exchange rates, with organic revenue
Comparable growth 1.8% 3.2%
growth of 2.4%
Adj. EBITDA growth (constant fx
6.6% 12.6%
rates)
Comparable growth of 1.8% (HY15: 5.8%)
Adj. EBITDA growth (organic) 5.9% 12.1%
Total number of stores increased Adj. EBITDA margin 21.7% 23.0%
from 2,953 to 2,997
Adj. EBITDA +6.6% at constant exchange
rates, to €220 million, with organic EBITDA
growth of +5.9%
Adj. EBITDA margin improved to 21.7% in
HY16 from 20.9% in HY15, driven by higher
share of prescription glasses and Exclusive
Brand frames.
13Segment Review: Other Europe
HY16 Highlights Other Europe – key figures HY16 2Q16
Revenue growth of 2.6% at constant Revenue growth (constant fx rates) 2.6% 4.1%
exchange rates, with organic revenue Revenue growth (organic) 1.7% 3.2%
growth of 1.7% Comparable growth 0.8% 2.1%
Adj. EBITDA growth (constant fx
3.6% 4.5%
Comparable growth of 0.8% (HY15: 3.3%) rates)
Adj. EBITDA growth (organic) 2.6% 3.4%
Total number of stores increased from
Adj. EBITDA margin 13.9% 14.9%
1,730 to 1,787 mainly as a result of store
openings
Adj. EBITDA +3.6% at constant exchange
rates to €61 million
Adj. EBITDA margin increased from 13.8%
in HY15 to 13.9% in HY16
14Segment Review: Americas & Asia
HY16 Highlights Americas & Asia- key figures HY16 2Q16
Revenue growth of 38.0% at constant Revenue growth (constant fx rates) 38.0% 40.3%
exchange rates, with organic revenue Revenue growth (organic) 14.6% 17.2%
growth of 14.6% Comparable growth 9.2% 9.7%
Adj. EBITDA growth (constant fx
49.4% 37.7%
Comparable growth of 9.2% (HY15: 9.7%) rates)
Adj. EBITDA growth (organic) 49.2% 29.6%
Total number of stores increased from 1,188
Adj. EBITDA margin 4.2% 5.0%
to 1,427
Adj. EBITDA increased 49.4% at constant
exchange rates to €9 million (HY15: €7
million)
Organic adj. EBITDA growth of 49.2%
Adj. EBITDA margin increased from 3.7% in
HY15 to 4.2% in HY16
15Comparable growth >20% in Turkey in HY16
June
43 53 68 84 101 123
39 stores 2016: 143
stores stores stores stores stores stores
stores
2007 … 2010 2011 2012 2013 2014 2015 2016
Acquired The first
Established Joined
several optical retail
from scratch GrandVision
optical TV campaign
by HAL
retailers with in Turkey
Investment
3-7 stores
Growth momentum driven by Continued expansion in 2016
Performance of new stores
Successful TV commercials
Successful sunglass campaigns
Improved product availability from more
efficient replenishment process
Improved sales mix
Already open (29 cities) To be opened in 2016 (7 cities)
14Adjusted EBITDA and margin development
512
500
449
400
400 372
348
16.3%
300 16.1%
16.0% 16.0% 272
259
200 15.3%
14.8%
14.5%
100
0
2011 2012 2013 2014 2015 HY15 HY16
Adjusted EBITDA (€ million) Adjusted EBITDA margin (%)
15Financial Position in HY16
change
in millions of EUR (unless stated otherwise) HY16 HY15
versus prior
year
Free cash flow 92 124 - 32
Capital expenditure 63 64 -1
- Store capital expenditure 48 44 4
- Non-store capital expenditure 15 20 -5
Acquisitions 10 4 6
Net debt 911 863
Net debt leverage (times) 1.7 1.8
Adj. net debt/EBITDA ratio to decreased to 1.7x despite increase
of net debt position
Lower Free Cash Flow generation in HY16 entirely due to timing
of payments
16Financial objectives and dividend policy
Annual revenue growth rate >5% at constant exchange rates
Medium term
financial Average annual EBITDA growth in high single digits
objectives
Net debt / EBITDA ratio of max. 2.0x
Intention to pay ordinary dividend in line with medium to long-term financial
performance
Dividend One dividend payment per year
policy
Target to increase DPS over time
Ordinary dividend payout ratio 25-50%
17Questions and Answers
18Annex EYE CARE, WE CARE MORE
Consolidated Income Statement

                                              HY16           HY15
  Consolidated Income Statement (€ million)

  Revenue                                            1,670          1,611
  Cost of sales and direct related expenses           -457           -442
  Gross profit                                       1,213          1,168

  Selling and marketing costs                         -839           -811
  General and administrative costs                    -187           -180
  Share of result of associates                          2              3
  Operating result                                     189            180

    Financial income                                    3              4
    Financial costs                                    -9            -12
  Net financial result                                 -6             -8
  Result before tax                                   182            172
  Income tax                                          -56            -54
  Result for the year                                 127            118

  Attributable to:
    Equity holders                                    117            109
    Non-controlling interests                          10              9

                                                                            20
Summarized Consolidated Balance Sheet
Summarized Consolidated Balance Sheet (€ million) 30 June 2016 31 December 2015
Property, plant and equipment 418 431
Intangible assets 1,450 1,480
Other non-current assets 155 152
Non-current assets 2,023 2,063
Inventories 297 264
Other current assets 312 274
Cash and cash equivalents 188 198
Current assets 797 736
Total assets 2,820 2,799
Total equity 871 832
Borrowings 770 776
Other non-current liabilities 251 236
Non-current liabilities 1,021 1,011
Trade and other payables 539 534
Borrowings 325 362
Other current liabilities 64 61
Current liabilities 928 956
Total equity and liabilities 2,820 2,799
21Consolidated Cash Flow Statement
HY16 HY15
Cash Flow Statement (€ million)
Cash flows from operating activities
Cash generated from operations 205 222
Tax paid -50 -34
Net cash from operating activities 155 188
Cash flows from investing activities
Acquisition of subsidiaries, net of cash acquired -10 -4
Purchase of property, plant and equipment -53 -51
Proceeds from sales of property, plant and equipment 2 5
Purchase of intangible assets -10 -13
Proceeds from sales of intangible assets 1 -
Other non-current receivables -1 1
Interest received 2 2
Net cash used in investing activities -69 -59
Cash flows from financing activities
Purchase of treasury shares -2 -51
Proceeds from borrowings 51 179
Repayments of borrowings -55 -309
Interest swap payments -2 -1
Acquisition of non-controlling interest - -1
Dividends paid to non-controlling interest -7 -8
Dividends paid to shareholders -35 -
Interest paid -7 -10
Net cash generated from/ (used in) financing activities -58 -201
Increase / (decrease) in cash and cash equivalents 28 -73
Movement in cash and cash equivalents
Cash and cash equivalents at beginning of the year -82 54
Increase / (decrease) in cash and cash equivalents 28 -73
Exchange gains/ (losses) on cash and cash equivalents -1 1
Cash and cash equivalents at end of year -55 -18
22Contact us
Investor Contact
investor.relations@grandvision.com
+31 (0)88 887 01 00
Media Contact
media.relations@grandvision.com
+31 (0)88 887 01 00
Social Media
https://www.linkedin.com/company/grandvision
@grandvisionnv
https://www.facebook.com/grandvisionNV
23You can also read