First-half 2021 report - Straumann
←
→
Page content transcription
If your browser does not render page correctly, please read the page content below

First-half 2021 report
                                         Webcast for investors, analysts and media

                                         Basel, August 12, 2021

1

        Disclaimer
        This presentation contains certain forward-looking statements that reflect the current views of
        management. Such statements are subject to known and unknown risks, uncertainties and other
        factors that may cause actual results, performance or achievements of the Straumann Group to
        differ materially from those expressed or implied in this presentation. The Group is providing the
        information in this presentation as of this date and does not undertake any obligation to update
        any statements contained in it as a result of new information, future events or otherwise.
        The availability and indications/claims of the products illustrated and mentioned in this
        presentation may vary according to country.

    2

2

                                                                                                             1
Agenda
    Highlights                                 Guillaume Daniellot

    Business & regional review                 Peter Hackel

    Recent achievements & strategy in action   Guillaume Daniellot

    Outlook 2021                               Guillaume Daniellot

                                               Guillaume Daniellot
    Q&A and upcoming events
                                               Peter Hackel

3

    Highlights
                                   Guillaume Daniellot, CEO

4

                                                                     2
Growth further accelerates in the second quarter
                 FIRST-HALF REVENUE                                                            ORGANIC GROWTH1                                                          CORE PROFITABILITY

                         CHF 986m                                                                           +63%                                                   EBIT margin 28.8%
                      CHF 516m revenue in Q2                                                          +103% in Q2                                                           IFRS EBIT margin 28.3%
                                                                                               60 bps currency effect in Q2

                        IMPLANTOLOGY                                                               ORTHODONTICS                                                                   OUTLOOK2

               Immediacy thriving                                                         DTC strengthened                                                                             Raised
                   BLT, BLX penetrating the market,                                    Brazilian DTC market entered with Smilink                                      Revenue growth above 30%,
                    TLX to be fully launched in Q3                                            DrSmile: strong performance                                        profitability nearly reaching 2019 level

    5    1   Organic growth excluding FX and M&A effects   2 Barring   unforeseen events, assuming the pandemic will not negatively impact the patient flow and excluding FX effects

5

        Very solid two-year average growth rate
        Organic revenue growth

                 NAM                                                                       EMEA
                                                                                             Q2 2020                       -38.0%
                   Q2 2020                     -41.6%
                                                                                             Q2 2021                      101.5%
                   Q2 2021                     135.2%

                                                                                                                                                           APAC
                                                                                                                                                             Q2 2020                   -11.7%
                                                                                                                                                             Q2 2021                   62.8%

                               LATAM
                                 Q2 2020                          -60.3%
                                 Q2 2021                          163.6%                                                      Group
                                                                                                                                Q2 2020                   -35.9%
                                                                                                                                Q2 2021                   103.3%
                                                                                                                                2y CAGR                   16.1%
    6

6

                                                                                                                                                                                                            3
Business and regional review
                                           Peter Hackel, CFO

7

        Record half-year result
        Revenue development by quarter (in CHF million, rounded)

                                600

                                500

                                400

                                300

                                200
                                       Q1   Q2   Q3   Q4   Q1   Q2   Q3   Q4   Q1   Q2
                                      2019 2019 2019 2019 2020 2020 2020 2020 2021 2021

    8

8

                                                                                          4
Strong revenue growth in the first half of 2021
Revenue development (in CHF million, rounded) Regional share of
62.9% organic growth
in CHF
63.1%
organic
Change in organic growth
57.0% 67.3% 68.1% 75.3%
9
9
EMEA and North America report triple-digit growth
EMEA Revenue change (organic)
Germany, Iberia, Russia, UK
56% 101.5%
and Turkey strong
Premium implants picking up
45%* of Group fast
27.0%
12.7% 13.1% 13.4%
0.1%
7.4% 5.9% Challenger brands e.g.
Q2 Q3 Q4 Q1 Q2 Q3 Q4 Q1 Q2 Neodent performing well
2019 2020 2021
-38.0%
North America 135.2%
Canada growing faster than
US
Premium and value implants
29%* of Group 18.8% 23.5% 19.4%
27.0%
drive growth, strongly lifted by
7.7% 8.8% 5.3%
digital and DSOs
Q2 Q3 Q4 Q1 Q2 Q3 Q4 Q1 Q2
2019 2020 2021
-41.6%
10 * refers to H1
10
5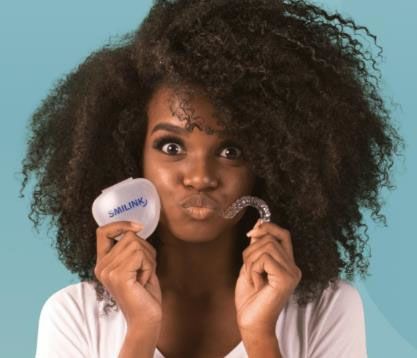
Latin America and Asia Pacific show strong growth
Asia Pacific Revenue change (organic)
74.4% Increased market share led by
56% 62.8%
China, Japan and Taiwan
Premium and challenger
20% of Group* 16.0%
23.4% 24.5%
17.9% implant brands drive growth,
11.0%
challengers growing faster
Q2 Q3 Q4 Q1 Q2 Q3 Q4 Q1 Q2
2019 2020 -11.7% 2021
Orthodontics growing well
-22.1%
Latin America 163.6%
Continued strong growth led by
Brazil, Argentina, Chile
Neodent biggest growth
23.8% contributor
6% of Group* 2.9%
17.6% 17.3% 13.4%
7.2% Digital solutions going very
well, Virtuo Vivo launched
Q2 Q3 Q4 Q1 Q2 Q3 Q4 Q1 Q2
2019 2020 -4.5% 2021
-60.3%
11 * refers to H1
11
Very dynamic growth in all businesses with clear aligners
in the leading position
Implant systems Digital & restorative Biomaterials Orthodontics
12
12
6
Core financials at a glance
                                                 % of        Margin   Change
      In CHF million, rounded        H1 2021                                           Comments
                                               revenue       change    in %
      Revenue                        985.5     100.0%                 62.9%
      COGS                           (233.8)   23.7%placeholder       33.4%
      GROSS PROFIT                   751.7     76.3%         530bps   74.9%         FX headwind -30bps

      Operating expenses             (467.7)   47.5%                  41.9%
      EBIT                           284.0     28.8%        1220bps   183.4%        FX headwind -30bps

      Financial result                (9.6)     1.0%                  (20.6%)
      Associates                      (1.0)     0.1%                  (47.6%)
      Income tax                     (45.9)     4.7%                  264.6%
      NET PROFIT                     227.4     23.1%        1090bps   209.1%
      Basic EPS                      14.19                            216.3%

 13

13

      Reported financials at a glance
                                                 % of        Margin   Change
      In CHF million, rounded        H1 2021                                           Comments
                                               revenue       change    in %
      Revenue                         985.5    100.0%                 62.9%
      COGS                           (233.9)   23.7%placeholder       27.3%
      GROSS PROFIT                    751.6    76.3%         660bps   78.4%         FX headwind -30bps

      Operating expenses             (473.0)   48.0%                  (4.5%)
      EBIT                            278.6    28.3%        4050bps      *         FX headwind -120bps

                                                                                Thereof earn-out adjustment
      Financial result                (58.6)    5.9%                  163.4%          DrSmile 49.0m

      Associates                      (1.0)     0.1%                  (47.7%)
                                                                                In H1 2020 positive tax effect
      Income tax                      (44.4)    4.5%                     *           due to impairments
                                                                                Earn-out adjustment DrSmile
      NET PROFIT                      174.6    17.7%        3320bps      *                -500bps

      Basic EPS                       10.87                              *

 14   *   Negative prior year base

14

                                                                                                                 7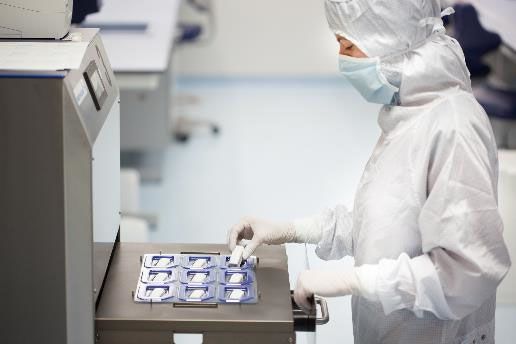
Overview: core results reconciliation

 15   1   Other finance expense refers to an earn-out adjustment for DrSmile

15

      Core gross margin above 76%
      In %, rounded                                                                   530bps
                                                                                           560bps

                                                                               76.2

 16

16

                                                                                                    8
Core EBIT margin almost at 29%
      In %, rounded
                                               1220bps
                                                       1250bps
      2510bps thereof
       = impairments

 17

17

      Core net profit margin improved to 23%
      In CHF million, rounded
                                             1090bps

       thereof CHF 150m
          impairments

                                Net profit                       Net profit
                                 margin                           margin
                                 12.2%                            23.1%

 18

18

                                                                              9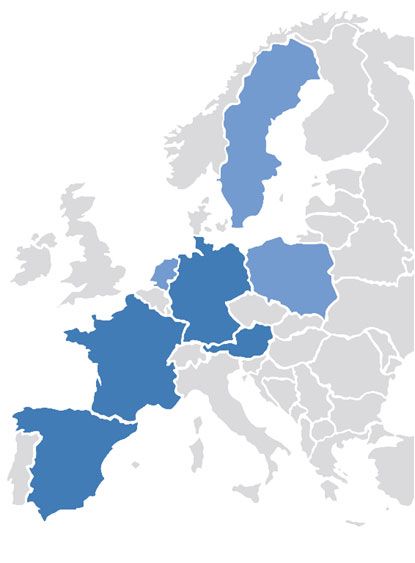
Historically high free cash flow              Operating cash flow   In CHF million   Y/Y change

      In CHF million, rounded                            HY1 2020             60.7
                                                         HY1 2021             256.7          +423%

                                         1940bps

            FCF margin                                                           FCF margin
               1.9%                                                                21.3%

 19

19

      Recent achievements & strategy in action
                                Guillaume Daniellot, CEO

20

                                                                                                        10
Seizing opportunities in the premium implant market
Immediacy segment
Parallel walled Apically tapered Fully tapered
TL BL BLT BLX TLX
1986 2007 2014 2019 2021
21 Straumann share Market opportunity Source: STMN Group market model & data 2020
21
Immediacy driving growth in the premium implant business
BLX and TLX winning new customers
BLX is now available in 67 countries
Immediacy solutions drive growth in the edentulous segment
TLX on track for full launch in 2nd half of 2021
ITI World Symposium in September
22
22
11Capturing the huge potential in the value market
PREMIUM
EMEA NAM
Challenger
CHALLENGER
Challenger
Eco
LATAM APAC
Straumann share Market opportunity
23
Source: STMN Group market model & data 2020
23
Global presence covering all price points
EMEA
NAM
APAC
LATAM
24
24
12Orthodontics business growing very significantly
High-performance material ClearQuartz
Launched worldwide except for China
Software feature Collaborator
Enabling doctors to collaborate on cases with
their staff, other doctors and treatment planning
services
ClearPilot 2.0 software update
Simple treatment planning for doctors
Visualization of treatment outcomes to
show patients
Mobile view e.g. for tablet computers
25
25
Expansion of direct-to-consumer brands for doctor-led clear
aligner treatment
DrSmile further expanding in Europe Entering the DTC segment in Brazil
Established: Agreement signed to fully acquire Smilink
Austria Doctor-led direct-to-consumer clear aligner
France treatment provider
Germany
Spain
Recently rolled out:
Netherlands
Poland
Sweden
26
26
13Investing in people to further capture opportunities
>800 new colleagues since December 31
Headcount
8500 Mainly in:
8169 Operations
8000 supporting Neodent and implant volume growth
Orthodontics
7500
DTC activity (DrSmile development) and production
7340
7273
7000
6500
6000
2020 HY 2020 FY 2021 HY
27
27
New Chief Information Officer to drive digital
transformation
Christian Ullrich
Chief Information Officer and EMB member
as of October 1st
Impressive track record in leading digital
transformation of global companies
28
28
14Outlook 2021
29
Outlook raised
Dental practices operating, healthy patient flows
Market Group expects softer tailwind in the second half of the year
environment Pandemic remains unpredictable
Strong first-half of 2021
Our revenue
Group aims to achieve organic revenue growth of above thirty
and percent
profitability1 Profitability (core EBIT margin) expected to nearly reach the
2019 level
1 Barring unforeseen events, assuming the pandemic will not negatively impact the patient flow and excluding FX effects
30
30
15Questions & answers
&
31
Calendar of upcoming events
2021 Event Location
September 1 Stifel Cross Sector Conf Virtual
September 8 Roadshow Geneva
September 9 Roadshow Zurich
September 15 UBS Best of Switzerland Conference Virtual
September 16 J.P. Morgan CEO Call Series Virtual
September 17 Bank of America Global Healthcare Conference Virtual
September 22 Bernstein Strategic Decision Conference Virtual
October 28 Third-quarter results Webcast
32
32
16Straumann Group’s currency exposure
Revenue breakdown H1 2021
Exchange rates development Jan 2020 - Jun 2021
CHF 160
Other 1%
17%
EUR 140
BRL 34%
4%
120
CNY 100
11%
80
USD/CAD/AUD 12/2019 03/2020 06/2020 09/2020 12/2020 03/2021 06/2021
33%
USDCHF EURCHF CNYCHF BRLCHF
Total cost breakdown H1 2021
Other CHF FX sensitivity
Average exchange rates (rounded) (+/- 10%) on FY
BRL 8% 14%
8% 2019 2020 HY1 2021 Revenue
CNY 1 EURCHF 1.11 1.07 1.09 +/- 31m
5%
1 USDCHF 0.99 0.94 0.91 +/- 27m
EUR 1 BRLCHF 0.251 0.185 0.170 +/- 4m
36%
USD/CAD/ 1 CNYCHF 0.144 0.136 0.140 +/- 11m
.
AUD
33 29%
33
Thank you
34
17You can also read


