Unilever First Half 2016 Results
Paul Polman / Graeme Pitkethly
         21st July 2016
←
→
Page content transcription
If your browser does not render page correctly, please read the page content below
Unilever First Half 2016 Results
Paul Polman / Graeme Pitkethly
21st July 2016
SAFE HARBOUR STATEMENT
This announcement may contain forward-looking statements, including ‘forward-looking statements’ within the meaning of the United
States Private Securities Litigation Reform Act of 1995. Words such as ‘will’, ‘aim’, ‘expects’, ‘anticipates’, ‘intends’, ‘looks’, ‘believes’,
‘vision’, or the negative of these terms and other similar expressions of future performance or results, and their negatives, are intended to
identify such forward-looking statements. These forward-looking statements are based upon current expectations and assumptions
regarding anticipated developments and other factors affecting the Unilever Group (the “Group”). They are not historical facts, nor are they
guarantees of future performance.

Because these forward-looking statements involve risks and uncertainties, there are important factors that could cause actual results to
differ materially from those expressed or implied by these forward-looking statements. Among other risks and uncertainties, the material
or principal factors which could cause actual results to differ materially are: Unilever’s global brands not meeting consumer preferences;
Unilever’s ability to innovate and remain competitive; Unilever’s investment choices in its portfolio management; inability to find sustainable
solutions to support long-term growth; customer relationships; the recruitment and retention of talented employees; disruptions in our
supply chain; the cost of raw materials and commodities; the production of safe and high quality products; secure and reliable IT
infrastructure; successful execution of acquisitions, divestitures and business transformation projects; economic and political risks and
natural disasters; financial risks; failure to meet high and ethical standards; and managing regulatory, tax and legal matters.
These forward-looking statements speak only as of the date of this document. Except as required by any applicable law or regulation, the
Group expressly disclaims any obligation or undertaking to release publicly any updates or revisions to any forward-looking statements
contained herein to reflect any change in the Group’s expectations with regard thereto or any change in events, conditions or circumstances
on which any such statement is based.

Further details of potential risks and uncertainties affecting the Group are described in the Group’s filings with the London Stock Exchange,
Euronext Amsterdam and the US Securities and Exchange Commission, including in the Group’s Annual Report on Form 20-F for the year
ended 31 December 2015 and the Annual Report and Accounts 2015.
Paul Polman
4G growth: Consistent, Competitive, Profitable & Responsible

            Consistent                                                Competitive
                                               Unilever
   +4.3%                             +4.7%                +5.7%                          +6.5%
                           +4.1%
           +2.9%                                                                                            +4.1%
                                               Market                      +2.3%

   2013    2014             2015     H1 2016   H1’16       PC               Food           HC               Refresh
           Underlying sales growth                        Underlying sales growth   Nielsen market growth

             Profitable                                               Responsible

           Core operating                                               Sustainable
              margin                                                   living brands

             +50bps                                                          1%
                                                                        faster growth

                H1 2016                                                     H1 2016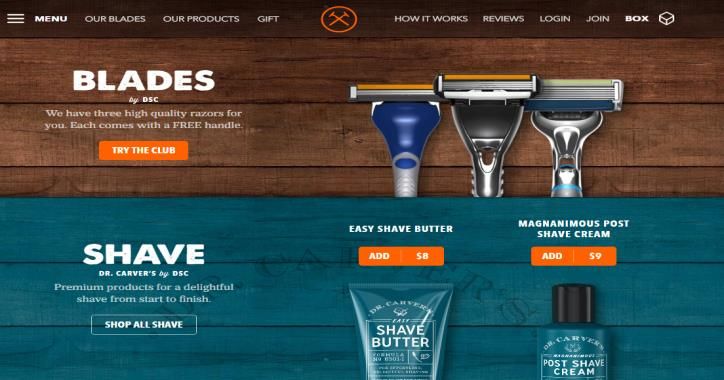
A volatile and increasingly fragmented world

      Global growth downgraded… again                             Consumer demand slowing

                  2016 projected GDP
                                                    5%
                        -90bps

     4.0%

              3.6%
                        3.4%                                                                                      EM
                                  3.2%              0%
                                          3.1%
                                                                                                                  D
                                                    -3%

                                                         Mar-13      Dec-13     Sep-14      Jun-15      Mar-16
     Oct'14   Oct'15   Jan'16    Apr'16   Jul'16          2013                                             2016

Source: IMF                                        Source: Nielsen volume market growth in Unilever categories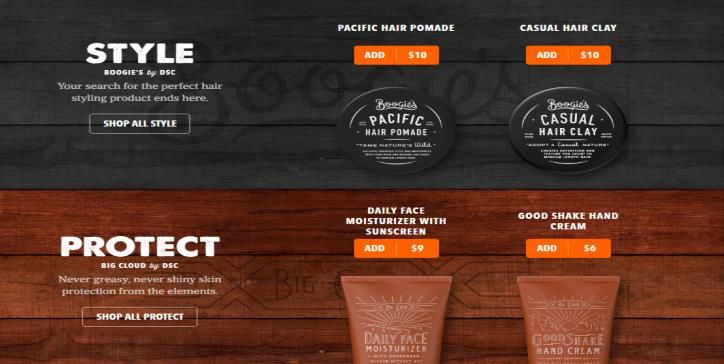
Building agility and resilience
Step up in innovation
Portfolio management
3 key initiatives:
1. Net Revenue Management
2. Organisation: Connected 4 Growth
3. Zero Based Budgeting
Innovation with global scale

   Brands with purpose           Differentiating technology           Faster roll-outs

     Dove +6% USG in H1              Magnum +6% USG in H1         Rolled out to 36 markets in H1

                  Up to 30% reduction in roll-out time for global launches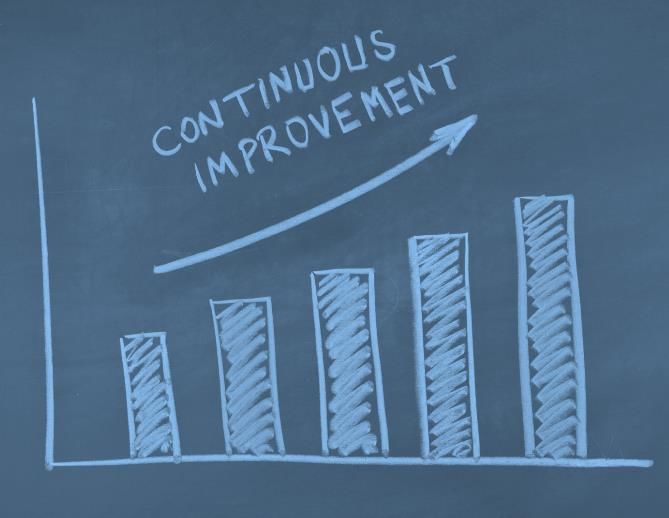
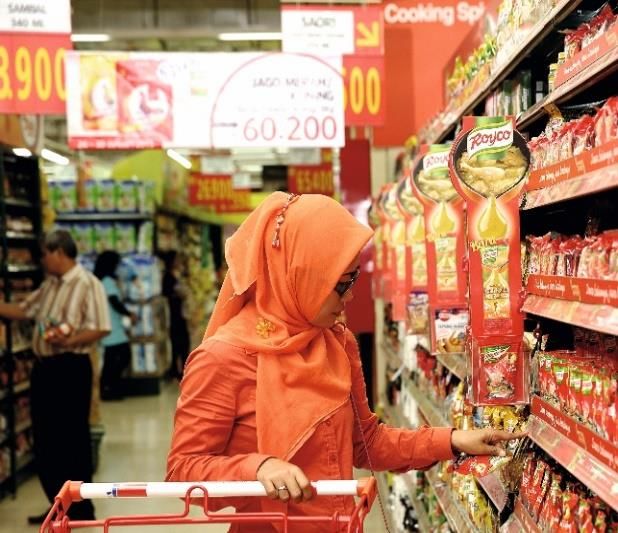
Innovation made locally relevant

     Local insight                     Local execution                    Local brands

                                     Example: Sunsilk Hijab         Kalina          Lakmé

                                                                    Marmite

                                                                                    Bango

                     Up to 50% reduction in lead time on local launches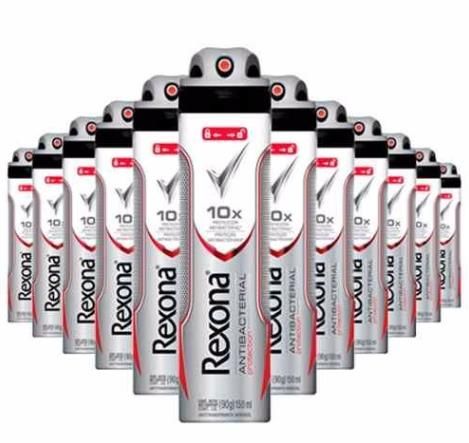
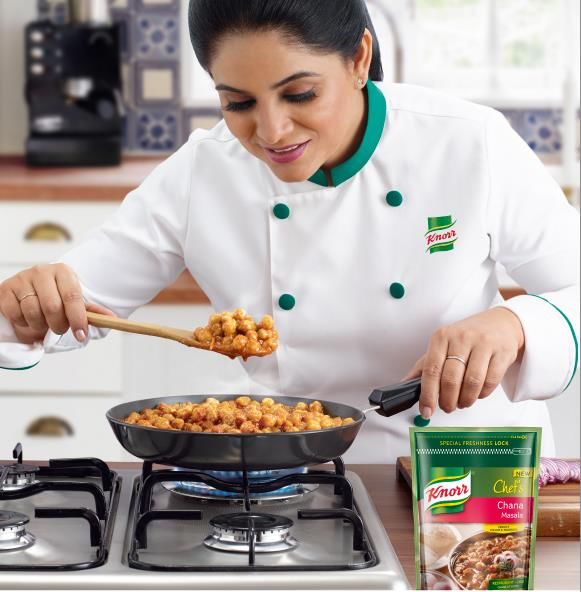
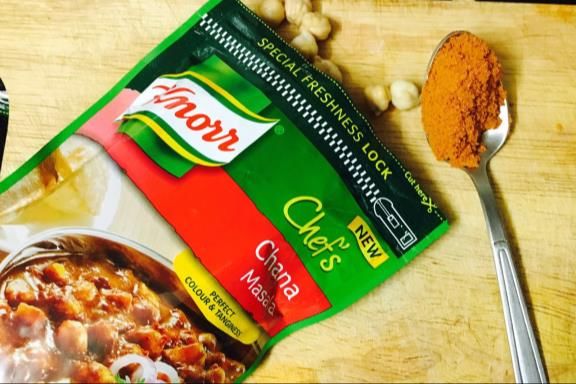
Innovation in high-growth segments

                     TRESemmé Botanique
                                          Ben & Jerry’s          Lux
 NATURALS                                  Non-Dairy        Silicone-free

                                                                                                FREE-FROM

  Lipton Pure Leaf
                                                                            Neutral detergent
                      Knorr meal makers

                                          AYURVEDIC

                                                          FAL Ayurvedic      Indulekha           Ayush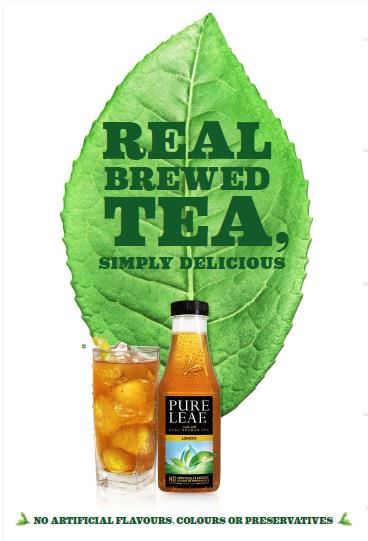
Building agility and resilience: Portfolio management

  Clear category strategies    Portfolio evolution           Flexibility in our business model
                                 % turnover
                              18%          19%
                              19%          19%

                              35%          24%       Foods

                                              38%     PC
                              28%

                              2008         2015
Subscription-based male grooming;
Dollar Shave Club
Takes us further into the male grooming category
$42bn market
Growing faster than personal care
Innovative and disruptive brand
3.2 million loyal club members
Products and dialogue across male grooming
Category leaders in Direct to Consumer
Attractive subscription model
Proprietary & extendable technologyBuilding agility and resilience: 3 key initiatives
Net Revenue Management Organisation: Connected 4 Growth Zero Based Budgeting
More global and more local
The next wave of savings
ZBB and Connected 4 Growth: €1bn p.a. savings by 2018Graeme Pitkethly
4G growth driven by strategy
    Building premium in Personal Care      Accelerated growth in Foods

                   Price>120
               Brands
               index  > 120
                price index                                                  2.3%
                                                         1.5%

                 +8%                    (0.6%)

                                        2014             2015                H1'16
                H1 USG%                                  USG%

     Improved margins in Home Care         Improved ROIC in Ice Cream

                                 9.8%                  15%
                   7.6%                               +130bps
                                                        15%
    6.3%                                            +300bps
    2014           2015         H1'16
                  COM%                      Estimated H1’16 MAT, vs. H1’14
Performance driven by Emerging Markets
Asia / AMET / RUB Latin America North America Europe
€11.3bn €3.8bn €4.5bn €6.7bn
USG 5.5% USG 14.7% USG 0.7% USG 0.1%
UVG 4.0% UVG (0.4%) UVG 0.5% UVG 1.8%
Emerging markets +8.0% USG with +2.9% UVGH1 2016: Turnover
USG +4.7%
0.7%
2.5% (7.6%)
2.2%
€27.0bn €26.3bn
H1 2015 UVG UPG M&A FX H1 2016H1 2016: Core operating margin up 50bps
+50bps
(80bps)
+80bps
15.0%
14.5%
H1 2015 Gross Margin Brand & Marketing Overheads H1 2016
InvestmentH1 2016: Core earnings per share up 7.5% in constant rates
0.4%
1.5% (1.0%)
(1.6%) (6.2%)
8.2%
Core EPS +1.3% in current rates
€0.91 €0.92
H1 2015 Operational Minority JVs, associates Financing and Tax Currency H1 2016
performance interests and other number of
income sharesCash flow
Free cash flow €0.8bn Improving working capital
Moving annual total working capital % turnover
2013 2014 2015 H1 2016
Usual seasonal outflow of working capital in H1
-3.8%
-5.0%
Exceptionally low working capital at 31 Dec’15 -6.1% -6.6%M&A funded by strong cash flow and increased net debt
Net debt Acquisitions & disposals
€bn
Last 6 years
12.6
Acquisitions* (€11.5bn)
7.6 Net proceeds from disposals €3.8bn
Total (€7.7bn)
Jun'10 Jun'16
*Jun’13 adjusted for HUL *businesses, minorities, Leverhulme family rightsPaul Polman
Priorities and outlook unchanged
Priorities Outlook
Growth ahead of markets Growth in H2 lower than H1:
• Challenging markets
Steady improvement in COM% • Tougher comparators
Margin improvement front-weighted:
Strong cash flow • B&MI increase in H2
• Higher restructuring in H2In summary
Building agility & resilience Sustainable, attractive & growing dividend
Step up in innovation
Portfolio management
3 key initiatives:
+64%
1. Net Revenue Management
over 7 years
2. Organisation: Connected 4 Growth
3. Zero Based BudgetingUnilever First Half 2016 Results
Paul Polman / Graeme Pitkethly
21st July 2016You can also read