NORTHERN GULF SEASONAL CLIMATE OUTLOOK - Grazier & Landholder Information
←
→
Page content transcription
If your browser does not render page correctly, please read the page content below
NORTHERN GULF SEASONAL
   CLIMATE OUTLOOK
Grazier & Landholder Information
            May 2021

 How are you positioned for the dry season?
  Take a look at this edition for insights on how to
    better manage your cattle over the winter.
                     In this issue…
❖ A review of the wet season – and it is good news for
  most graziers in the Northern Gulf.
❖ Strong pasture growth in 2021 following above-average
  rainfall events for much of the region.
❖ Above-average temperatures expected for June.
❖ No indication of any ENSO event for the upcoming
  2021-22 wet season.
❖ Drought conditions eased across much of Australia.

                     John McLaughlin
 NACP Climate Project Officer & Rangelands Project Officer
                   Northern Gulf Region

                                                             1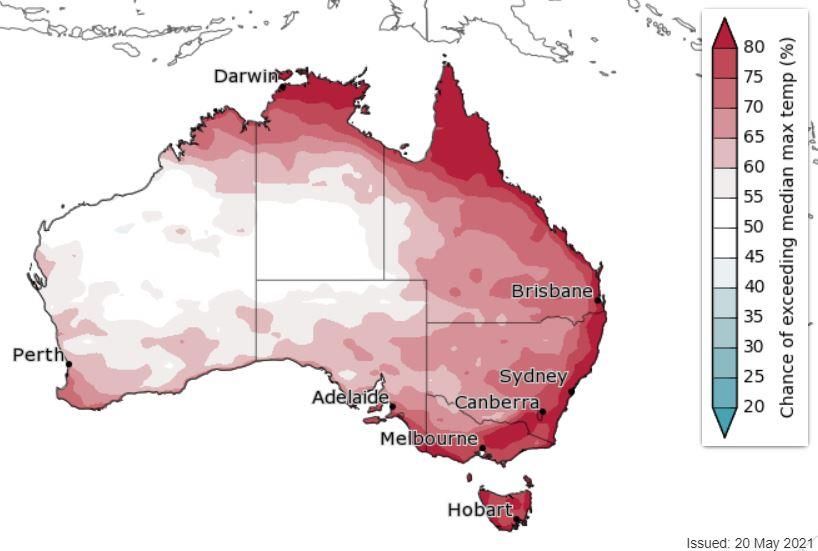
Reviewing the 2020-21 Wet Season
The wet season is over – let us take a look back at rainfall from October to April across
the Northern Gulf to see how we are positioned moving into the dry!
The Northern Gulf region had an enjoyable wet season as the La Nina event was largely successful in
bringing above-median rainfall to most areas. The season ended with some late April rainfall, as
demonstrated in the table below, that boosted rainfall totals across the entire region.
The exception this wet season was to the west of the Northern Gulf. Towards Normanton (including
Vanrook & Iffley Stations), rainfall totals fell just short of annual medians. This is a disappointing result
for those that were hoping for strong rainfall and an associated pasture response. However, given
the position that these areas were in before the late April rain (70mm), it is a good end to the year.

  For the most part the 2020-21 Wet Season was fortunate for graziers
 across the gulf. After a very poor 2019-20 season the rainfall was much
 needed, and producers should have adequate feed on hand to manage
                            the 2021 dry season.

                      Wet Season Rainfall Totals                             Recent Rainfall
                        (1st October 2020 - 23rd May 2021)            (1st April 2021 - 23rd May 2021)
  Location           Median     Actual     + or -                 Median     Actual      + or -
                                                     Rainfall                                      Rainfall
                     Rainfall   Rainfall   Median                 Rainfall   Rainfall   Median
                                                    Percentiles                                   Percentiles
                      (mm)       (mm)       (mm)                   (mm)       (mm)       (mm)
    Normanton           810       777        -33        44%         16         72         56         84%

    Vanrook Stn         888       841        -47        46%         21         105        84         89%

     Iffley Stn         559       532        -27        47%          2         20         18         70%

      Croydon           705      1022       317         88%         14         98         84         98%

   Esmeralda Stn        625       756       131         71%          9         65         56         88%

    Georgetown          687      1013       326         84%         19         129        110        93%

   Abingdon Stn         784      1197       413         90%         13         95         82         91%

    Mt Surprise         696      1026       330         83%         20         50         30         77%

     Forsayth           692      1115       423         92%         14         104        90         93%

     Einasleigh         654      1061       407         90%         16         64         48         83%

     Greenvale          581       839       258         84%         29         101        72         87%

     Almaden            746       975       229         79%         24         60         36         82%

     Chillagoe          799       941       142         69%         21         63         42         81%

     Dimbulah           673       901       228         74%         26         115        89         93%
12-Monthly Rainfall Anomalies for Queensland
                                  1st May 2020 to 30th April 2021
This figure illustrates the rainfall anomolies from across Queensland for the last 12 months, i.e. the period
from the 1st of May 2020 to the 30th of April 2021. This provides an annual summary of rainfall from the
end of the last wet season (2019-2020) to the end of this wet season (2020-21). This shows that the La
Nina event did not bring with it the widespread rainfall that many expected. For the Northern Gulf
Region, rainfall was particularly high, however, North Queensland stood alone in this regard. The
Capircorn Coast and Southeast Queensland suffered major deficits in rainfall over the past 12-months.
For Western and Central Queensland the season was more or less average.

  Most of the Northern Gulf region received above average rainfall for the 2020-21 wet season.
   However, for much of Queensland, the La Nina event simply did not live up to expectations.
AUSTRALIA DROUGHT MAP
The map below shows the Australian Drought Map for the previous 12 months from 1st April 2020 to 30th April
2021. The drought conditions for this period are very minimal across across Australia – which is great news as
these have continued to shrink throughout the wet season. For North Queensland, the last 12-months has
not resulted in any serious rainfall deficincies, as defined by the Burea of Meterology.

SOIL MOISTURE
Soil moisture in April 2021 is average
to slightly above average for most
regions in the Northern Gulf. Late
April rain contributed to this.
Significant rainfall events across
southern Australia in March 2021
(Victoria and NSW) have caused well
above average soil moisture levels for
many regions. This includes parts of
Southern Queensland.

Soil moisture, together with
  sunlight & temperature,
   largely govern growth
   conditions for pasture.
PASTURE GROWTH
Pasture Growth in the Northern Gulf for
2021 was encouraging. Although the
region did not get early rainfall in
November and December 2020, pasture
growth in 2021 has resulted in a good body
of feed on the ground moving into the dry.

Pasture Growth in the Northern Gulf region for
April 2021 (Right) was good. This is indicated by the
green shades across the map, and some grey which
indicates Average growth. Some late April rainfall
across much of the region has helped to prolong the
growing season by another few weeks.

We would typically look at the ‘Most
Likely Tercile for Pasture Growth’ in this
section. However, given the growing
patterns of North Queensland pastures,
this metric is not useful (see next page).

A look back at the pasture growth from February
to April of 2021 demonstrates strong pasture
growth for much of the Northern Gulf region.

A poor month of rainfall in March looked to have
stemmed pasture growth pushing into Autumn.
However, some strong downpours in April coupled
with good, consistent rainfall in February has
resuted in good pasture growth across much of the
region for this period.
PASTURE GROWTH – The Times that Matter
Understanding the variation in Pasture Growth in the different seasons can help to interpret maps.

      Period               Median Pasture Growth (kg DM/ha)               % of Pasture Growth
                                       Can range from:
                                     • 1,000 – 2,000 (grey)
 January to March                                                                  75%
                                    • 2,000 – 2,500 (green)
                                     • 2,500 – 3,000 (blue)
    April to June               Generally ranges from 50 – 200                     6%
 July to September                Generally ranges from 0 - 50                     1%
                                        Can range from:
                                         • 50 – 100 (red)
October to December                                                                19%
                                       • 100 – 500 (orange)
                                      • 500 – 1,000 (yellow)
RAINFALL OUTLOOKS (75% probability of occurring*)
The Northern Gulf regions climate is characterised by summer wet seasons and a long, dry winter
period. This means that very little rainfall occurs across much of the region in the 6-months from
May to October – as demonstrated in the table below.
The drivers of climate in the Northern Gulf are active over summer. Without active climate drivers in winter,
rainfall is not only rare but difficult to predict. We recommend being very cautious of predictions made
throughout this period, especially those that involve ‘likelihood’ related predictions (i.e. ‘above-median
rainfall’). The table below shows how rare winter rainfall is across the Northern Gulf. The graph below provides
a rainfall forecast for the 3-months from June to August – which supports this trend.
Median Monthly Rainfall (mm)
Northern Gulf Region
Jan Feb Mar Apr May June July Aug Sep Oct Nov Dec Annual
Normanton 134 139 63 0 0 0 0 0 0 4 26 70 562
Vanrook 220 243 152 12 0 0 0 0 0 0 47 116 901
Iffley 134 139 63 0 0 0 0 0 0 4 26 70 562
Croydon 196 166 96 8 0 0 0 0 0 5 29 102 718
Esmeralda 173 142 82 5 0 0 0 0 0 4 29 79 643
Georgetown 205 146 81 3 2 0 0 0 0 5 31 130 753
Abingdon 215 231 118 4 0 0 0 0 0 3 34 130 829
Mt Surprise 195 194 89 13 3 2 0 0 0 6 41 93 805
Forsayth 197 226 88 11 2 0 0 0 0 5 47 99 755
Einasleigh 140 146 79 4 0 0 0 0 0 6 36 72 620
Greenvale 128 147 74 14 7 6 0 0 0 9 37 81 633
Almaden 199 193 116 20 6 3 1 0 0 11 39 110 884
Dimbulah 172 177 116 16 5 5 0 0 0 10 43 108 848
Chillagoe 190 216 121 13 0 0 0 0 0 0 45 125 801
Rainfall Totals that have
a 75% chance of occurring
from
June to August 2021TEMPERATURE
June is looking like a slightly milder month than May, which had below average temperatures for
much of the country. For the Northern Gulf region, it is likely to be a warmer than average June.
Maximum Temperatures – June 2021
Daytime temperatures for June in North Queensland are predicted to be above average, though Western and
Central Australia will be close to normal.
Figure 1: Maximum Temperature information for the Northern Gulf; Chance of
exceeding the Median Maximum Temperature in June 2021.
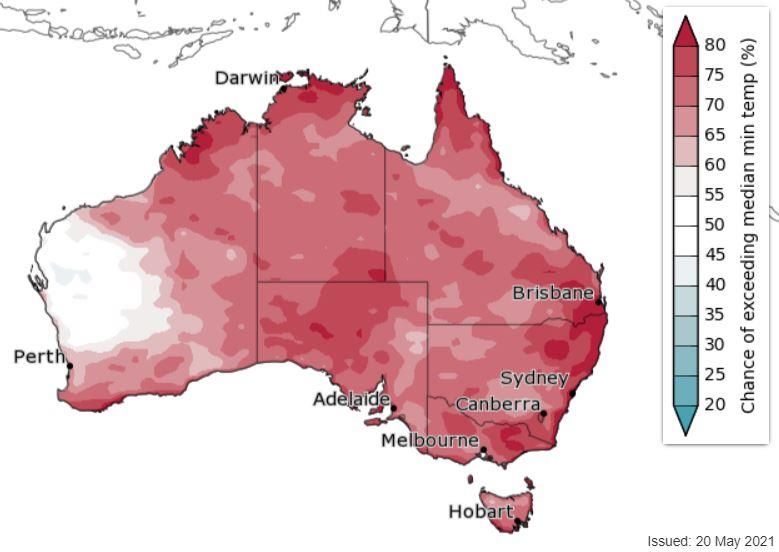
Minimum Temperatures – June 2021
June night-time temperatures are predicted to be slightly warmer than average for the Northern Gulf and
most of Australia.
Figure 2: Minimum Temperature information for the Northern Gulf; Chance of
exceeding the Median Minimum Temperatures in June 2021.CLIMATE DRIVERS – A glimpse into the next wet season!
At this time of the year there are no major Climate Drivers impacting North
Queensland. Instead, we can glance at the ENSO Outlook to look for early indications
of what to expect for the 2021-22 wet season.
The ENSO Outlook is INACTIVE. This means the El Niño–
Southern Oscillation (ENSO) is neutral with no indication
that El Niño or La Niña will develop in the coming months.
All seven climate models surveyed by the Bureau suggest
a neutral ENSO state is the most likely scenario through
the remainder of the southern hemisphere autumn and
winter.
ENSO Outlook – Monthly Sea Surface Temperature Anomalies
The El Niño–Southern Oscillation (ENSO) is currently neutral. All of the international climate models
surveyed by the Bureau anticipate NINO3.4 will remain neutral until at least October.
ENSO events—El Niño or La Niña—typically begin to develop during the southern hemisphere autumn to
winter, before strengthening in winter to spring (August/September). By this time, the accuracy of
predictions becomes much better. So, let’s keep an eye on how this develops, and by August we should
have a good indication of what to expect!WHERE CAN YOU FIND MORE INFORMATION?
Bureau of Meteorology Climate Website
This page is updated every fortnight. There is a lot of information you can get from this page, including ENSO
situation and forecasts, and rainfall and temperature maps. The maps can be zoomed in to a regional level for
perspective. Click on http://www.bom.gov.au/climate/
Climate Drivers
The Madden-Julian Oscillation (MJO) http://www.bom.gov.au/climate/mjo/
ENSO Wrap-Up http://www.bom.gov.au/climate/enso/
The Indian Ocean Dipole (IOD) http://www.bom.gov.au/climate/iod/
Southern Oscillation Index http://www.bom.gov.au/climate/enso/history/ln-2010-12/SOI-what.shtml
Rainfall
Recent Rainfall http://www.bom.gov.au/jsp/awap/rain/index.jsp
Rainfall Outlook http://www.bom.gov.au/climate/outlooks/#/rainfall/summary
Northern Rainfall Onset http://www.bom.gov.au/climate/rainfall-onset/
Temperature http://www.bom.gov.au/climate/outlooks/#/temperature/summary
Drought http://www.bom.gov.au/climate/drought/
Soil Moisture http://www.bom.gov.au/climate/drought/#tabs2=Soil-moisture
The Long Paddock Website
A Queensland Government initiative providing seasonal climate and pasture condition information to the
grazing community. Click on https://www.longpaddock.qld.gov.au/
Pasture Growth https://www.longpaddock.qld.gov.au/aussiegrass/?tab=aussie-grass-maps
CliMate app
This is a great free program where you can access a whole lot of climate information about your district,
including how the season is going compared to average, when it is likely to rain, what the trends are, and much
more. Click on the link https://climateapp.net.au/
You need to register, which is a simple process, but write down your username and password as you will need
to put them in from time to time.
Northern Australia Climate Program Website
The ‘Northern Australia Climate Program’ (NACP) is a partnership between the Queensland Government, Meat
and Livestock Australia Donor Company and USQ, targeted at helping the grazing industry better manage
drought and climate risks through a range of research, development, and extension activities. NACP is funded
by the Drought and Climate Adaptation Program. Click on https://nacp.org.au/about
Still need more information?
Contact John McLaughlin on 0411 294 331 or email John.McLaughlin@northerngulf.com.au
1You can also read