Capital management strategy - Rafael Lizardi Senior vice president, chief financial officer Dave Pahl Vice president, head of investor relations

Page created by Louis Cross
 
CONTINUE READING
Capital management strategy - Rafael Lizardi Senior vice president, chief financial officer Dave Pahl Vice president, head of investor relations
Capital management strategy

Rafael Lizardi
Senior vice president, chief financial officer
Dave Pahl
Vice president, head of investor relations
February 4, 2020
Capital management strategy - Rafael Lizardi Senior vice president, chief financial officer Dave Pahl Vice president, head of investor relations
Agenda for this call

 • Capital management strategy and scorecard
 • Historical view of our capital allocation
 • R&D allocation priorities and results
 • 300-millimeter Analog update
 • Free cash flow* growth and outlook
 • Cash returns
      – Share repurchases
      – Dividends

 * Free cash flow (FCF) = Cash flow from operations minus capital expenditures   2
Capital management strategy - Rafael Lizardi Senior vice president, chief financial officer Dave Pahl Vice president, head of investor relations
Key takeaways from our discussion today
 • We remain focused on consistent execution of our capital management strategy.

 • Our business model is designed around four sustainable competitive advantages. We
   invest with a long-term view to strengthen and leverage these competitive advantages.

 • Our disciplined allocation of resources to R&D and our initiatives are delivering growth
   in the best products (analog and embedded) and the best markets (industrial and
   automotive).

 • Our 300-millimeter Analog manufacturing strategy is a unique advantage and will
   provide benefits for a long time.

 • We remain committed to returning free cash flow to owners.

                                                                                              3
Capital management: objective and strategy

Objective:
   Maximize long-term growth of
   free cash flow per share

                                  Strategy:
                                    1. Great business model: built around
                                       four sustainable competitive advantages
                                    2. Discipline: allocate capital to the
                                       best opportunities
                                    3. Efficiency: constantly strive for more
                                       output per $ of input
                                                                                 4
Grow, generate and return
 • TI is in a unique class of companies able to grow, generate and return cash to
   shareholders for a long time to come

 • Focused on the best products and best markets within the semiconductor industry:
    – Best products: analog and embedded – large, fragmented, used in everything electronic
    ‒ Best markets: industrial and automotive – fastest growing due to increasing content

 • Our business model is designed around four competitive advantages:
    – Manufacturing and technology
    – Broadest portfolio of analog and embedded products
    – Reach of market channels
    – Diverse and long-lived positions (high terminal value)

                                                                                              5
Capital management 2019 scorecard
   Metric                                        Long-term objective                                                            Target                   Result
Free cash flow
                       Maximize long-term growth of free cash flow per share.                                              25 – 35% of revenue (TTM)       
generation

                       Invest to support new technology development and revenue growth. Extend our low-cost
Capital expenditures   manufacturing advantage, including 300 millimeter. Recognize it may run higher if there is an            ~6% of revenue             
                       opportunity to extend long-term manufacturing advantage.

                       Maintain high levels of customer service, minimize inventory obsolescence and improve
Inventory              manufacturing asset utilization. Will vary based on percent of direct revenue, market conditions         115 – 145 days             
                       and consignment levels.

                       Provide necessary liquidity in all market conditions. Recognize there may be times for strategic      10% revenue (TTM) +
Cash management                                                                                                                                            
                       buildup or drawdown of cash.                                                                            dividends (NTM)

                       Be fully funded on a tax-efficient basis. Have annual free cash flow reflect what is available to
Pensions                                                                                                                          Fully funded             
                       owners by minimizing one-shot calls for cash, unless there is a P&L or cash advantage.

                       Increase rates of return with some leverage on balance sheet when economics make sense. Avoid           When economics
Debt                                                                                                                                                       
                       concentrated maturities and ensure strategic flexibility.                                                make sense
                       Return all free cash flow cash via repurchases and dividends. Recognize there may be times for
Cash return                                                                                                                    All free cash flow          
                       strategic build up or draw down of cash.
                                                                                                                                  40 – 60% of
Dividends              Provide a sustainable and growing dividend to appeal to a broader set of owners.                                                    
                                                                                                                           current year free cash flow

                                                                                                                           Free cash flow – dividends
Repurchases            Accretive capture of future free cash flow for long-term owners.                                                                    
                                                                                                                                    (TTM)

                                                                                                                                                                  6
Ten-year view of our capital allocation

                                          7
Where and why we’ve allocated our capital
         Capital allocated: $81B                                         Purpose
                                  (2010–2019)

R&D, Sales/Mktg, CapEx, Inv                               Organic growth of business

        Share Repurchases                                 Accretive capture of future free cash flow
                                                          for long-term investors

                 Dividends
                                                          Appeal to broader set of investors

               Acquisitions                               Inorganic growth

                              0    10    20     30   40

                                                                                                       8
R&D investments are targeted at the best
opportunities

                                           9
Disciplined allocation of R&D strengthens portfolio
               Market                  R&D             % of TI revenue
              segment              investments          2013      2019
          Industrial             Up broadly              30%     36%

          Automotive             Up broadly              12%     21%

                                 Down, but more
          Personal electronics                           32%     23%
                                 selective
          Communications         Analog up slightly,
                                                         15%     11%
          equipment              Embedded down

          Enterprise systems     Flat, at low levels     6%       6%

          Other                  Flat, at low levels     5%       3%

                                                                         10
Disciplined allocation of R&D strengthens portfolio
               Market                  R&D               % of TI revenue
              segment              investments            2013      2019
          Industrial             Up broadly                  30%   36%
                                                       42%                 57%
          Automotive             Up broadly                  12%   21%

                                 Down, but more
          Personal electronics                               32%   23%
                                 selective
          Communications         Analog up slightly,
                                                             15%   11%
          equipment              Embedded down

          Enterprise systems     Flat, at low levels         6%     6%

          Other                  Flat, at low levels         5%     3%

                                                                                 11
Industrial: our largest and most diverse market
      TI end markets                                    TI industrial market
            2019 revenue                                     13 sectors
                  Enterprise                      40%
                   & Other                                                Lighting

                                                                          Industrial transport

                                                                          Retail automation & payments
                                                  30%                     Power delivery
        Comms
       Equipment                                                          Motor drives

                                                                          Pro audio, video & signage
                                     Industrial
                                                  20%                     Appliances

                                                                          Test & measurement
     Personal
                                                                          Aerospace & defense
    Electronics
                                                                          Medical
                                                  10%
                                                                          Grid infrastructure

                                                                          Building automation
                        Automotive
                                                                          Factory automation & control

                                                  0%

                                                                                                         12
300-millimeter Analog manufacturing
is an advantage

                                      13
Chip cost is ~40% less on 300 millimeter

             Illustration of the GPM impact from 300 mm
                                              Built on   Built on
                                              200-mm     300-mm
                                               wafer      wafer
         Sales price of example part           $1.00      $1.00

         Cost of goods:     Chip cost          $0.20      $0.12
                            Assembly, test,
                                               $0.20      $0.20
                            other
                            Total              $0.40      $0.32

         Gross margin %                        60%        68%

                                                                    *Unpackaged
                                                                                  14
Impact of 300-millimeter Analog grows

      12

      10

       8
 $B
       6                                                                          150/200 mm
                                                                                  300 mm
       4

       2

       0
           2010    2011   2012   2013   2014   2015   2016   2017   2018   2019

             •    300-millimeter Analog ~47% of total Analog revenue
             •    Incremental Analog growth mostly on 300 millimeter
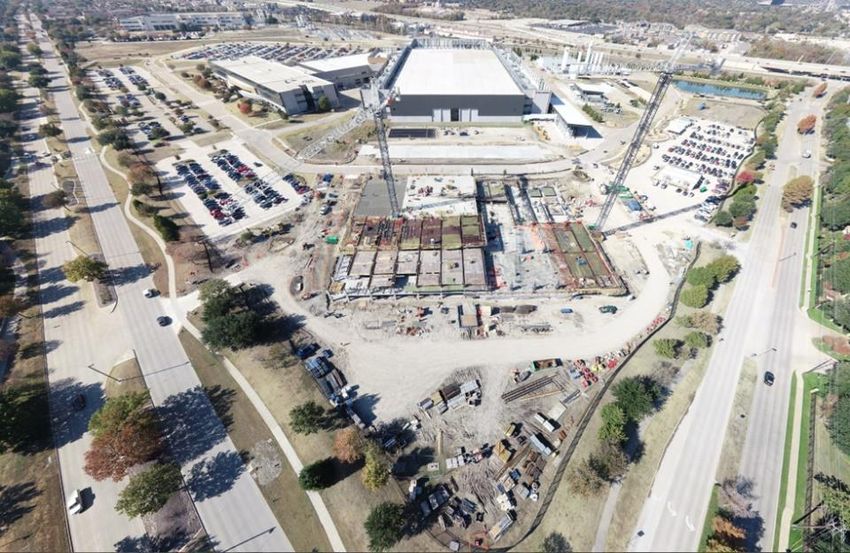
                                                                                               15
Investing for growth 300-millimeter Analog
                             Next fab in Richardson, Texas

        Rendering of future site                            Existing factory and parking
                                                           garage construction underway
                                      New factory
                                      New parking garage
                                                                                           16
Free cash flow growth and outlook

                                    17
Free cash flow per share growth continues
    7.00
                2019 year on year:
    6.00        • Free cash flow per share decreased 1%
                • Free cash flow margin increased to 40%
    5.00        • Share count reduced by 1.4%                                                                           *

    4.00

$
    3.00
                                                                                         11% trend
                                                                                         (2004 through 2019)
    2.00

    1.00

      -
           2004      2005       2006   2007   2008   2009   2010   2011   2012   2013   2014   2015      2016   2017   2018   2019
           * Delta due to tax reform                                                                                                 18
Analog and Embedded have proven growth record
                  18            Transformation of TI's portfolio
                  15

                  12
     Revenue $B

                                                                                     Wireless (legacy)
                  9                                                                  Other segment
                                                                                     Embedded
                  6                                                                  Analog

                  3

                  0
                       2008 2009 2010 2011 2012 2013 2014 2015 2016 2017 2018 2019

                        Analog and Embedded:
                        • 10-year growth trend of 6%, five-year 6%
                        • Gaining on average ~30 – 40 bps of market share annually
                        • Now >90% of revenue, can drive top-line growth
                                                                                                         19
Cash returns

               20
Cash generation                                            50%
                                                                    Free cash flow as % of revenue
  and returns                                                40%                S&P 500
                                                                         TI 92nd percentile
                                                             30%

                                                             20%

                                                             10%

                                                              0%

                                                             -10%
60%                                                          40%
                            Cash returns as % of revenue              Return on invested capital
50%                                   S&P 500                                 S&P 500
                                                             30%
40%
                                     TI 97th percentile

30%                                                          20%
                                                                     TI 95th percentile
20%
                                                             10%
10%                                                                                                  21

0%    Source: S&P Capital IQ, Public filings as of 1/12/20
                                                              0%
Cash returned to owners continues to grow
                Total cash returned
      9

      8

      7

      6
 $B
      5

      4

      3

      2

      1

      0

                 Dividends paid   Stock repurchases

                                                      22
Accretive capture of future free cash flow for
long-term investors
                                                     46% reduction in shares outstanding
                                  1.8
    Basic shares EoP (billions)

                                  1.5

                                  1.2

                                                                                                                   932M
                                  0.9
                                        2004 2005 2006 2007 2008 2009 2010 2011 2012 2013 2014 2015 2016 2017 2018 2019

                                    •   Repurchase steadily when discounted cash flow value exceeds stock price
                                    •   Disciplined with stock-based compensation
                                    •   Shares outstanding reduced by 1.4% in 2019, 46% reduction since 2004
                                    •   $13.2B of authorization remaining as of end of Q4 2019
                                                                                                                          23
Sustainability and growth of dividends
                                                                                                                                     $3.60

                                                   TXN dividend per share                                                    $3.21

                                                                                                                     $2.63

                                                                                                             $2.12

                                                                                                     $1.64
                                                                                             $1.40
                                                                                     $1.24
                                                                             $1.07

                                                                     $0.72
                                                     $0.49   $0.56
                                   $0.41   $0.45
                           $0.30
  $0.09   $0.11    $0.13

  2004    2005     2006    2007    2008    2009     2010     2011    2012    2013    2014    2015    2016    2017    2018    2019 4Q19*4

          •       Increased dividend 16 consecutive years, including 17% increase in Q4 2019
          •       ~20% CAGR (5 & 10 year)
          •       2019 dividend payments used 52% of 2019 free cash flow
          •       Yield is 3.0% (as of 1/31/2020)
                                                                                                                                             24
Summary
• TI is in a unique class of companies able to grow, generate and return cash to
  shareholders for a long time to come

• Our business model is designed around four competitive advantages
   – Manufacturing and technology
   – Broadest portfolio of analog and embedded products
   – Reach of market channels
   – Diverse and long-lived positions (high terminal value)

• Looking forward: continued growth of free cash flow per share drives returns
   – Top-line growth driven by the best products (analog and embedded) and the best markets
     (industrial and automotive)
   – 300-millimeter Analog manufacturing strategy will provide benefits for a long time
   – Continued returns through share repurchases and dividends
                                                                                              25
Risk factors and non-GAAP measures
This presentation is a statement of management’s intentions and describes a strategy that TI intends to
pursue as management, in its judgment, deems appropriate. The application of this strategy during any
given period may vary depending on market conditions and other factors that management deems
relevant. This presentation includes forward-looking statements intended to qualify for the safe harbor
from liability established by the Private Securities Litigation Reform Act of 1995. See Item 1A of TI’s most
recent Form 10-K for a detailed discussion of risk factors that may cause results to differ materially from
the forward-looking statements. TI undertakes no obligation to update forward-looking statements to
reflect subsequent events or circumstances.

This presentation contains non-GAAP financial measures, specifically free cash flow (FCF) and ratios based on it.
See www.ti.com/ir for reconciliation to GAAP. Free cash flow per share is not an alternative to earnings per share
as an indicator of TI’s performance, and investors should not consider presentation of free cash flow per share as
implying that stockholders have a contractual or other right to the cash.

                                                                                                                26
You can also read