Steel and Iron Ore Market Perspectives - Sergio Espeschit Vale's Director for Middle East 17th Middle East Iron and Steel Conference Dubai ...

Page created by Kathy Hall
 
CONTINUE READING
Steel and Iron Ore Market Perspectives - Sergio Espeschit Vale's Director for Middle East 17th Middle East Iron and Steel Conference Dubai ...
Steel and Iron Ore Market Perspectives
Sergio Espeschit
Vale’s
V l ’ Di
       Director
            t ffor Middl
                   Middle E
                          Eastt
17th Middle East Iron and Steel Conference
Dubai, December 11th, 2013
Steel and Iron Ore Market Perspectives - Sergio Espeschit Vale's Director for Middle East 17th Middle East Iron and Steel Conference Dubai ...
Disclaimer

    “ This presentation may include statements that present Vale's expectations
    about future events or results. All statements, when based upon expectations
    about the future and not on historical facts,  facts involve various risks and
    uncertainties. Vale cannot guarantee that such statements will prove correct.
    These risks and uncertainties include factors related to the following: (a) the
    countries where we operate, especially Brazil and Canada; (b) the global
    economy; (c)
               ( ) the
                    h capital
                           i l markets;
                                  k     (d) the
                                              h mining
                                                   i i and d metalsl prices
                                                                        i    and
                                                                               d their
                                                                                  h i
    dependence on global industrial production, which is cyclical by nature; and (e)
    global competition in the markets in which Vale operates. To obtain further
    information on factors that may lead to results different from those forecast by
    Vale, please consult the reports Vale files with the U.S. Securities and Exchange
    Commission (SEC), the Brazilian Comissão de Valores Mobiliários (CVM), the
    French Autorité des Marchés Financiers (AMF) and The Stock Exchange of Hong
    K
    Kong  Li it d and
          Limited,    d in
                        i particular
                              ti l the
                                     th factors
                                         f t      di
                                                  discussed
                                                          d under
                                                                d “Forward‐Looking
                                                                    “F      d L ki
    Statements” and “Risk Factors” in Vale’s annual report on Form 20‐F.”
2
Steel and Iron Ore Market Perspectives - Sergio Espeschit Vale's Director for Middle East 17th Middle East Iron and Steel Conference Dubai ...
Agenda

Iron ore and steel market outlook

Vale’s expansion projects

Vale in Oman
Steel and Iron Ore Market Perspectives - Sergio Espeschit Vale's Director for Middle East 17th Middle East Iron and Steel Conference Dubai ...
Iron ore seaborne demand and global crude steel production will grow
34% and 23% respectively until 2020, mainly driven by Asia and Emerging
Economies                Crude Steel Production

    Rest of the World (Mt)                World (Mt)                            Asia (Mt)

        Growth
      Growth   2012
             2012    ‐ 2020:
                  – 2020:    +21%
                          +21%               Growth
                                           Growth   2012
                                                  2012    ‐ 2020:
                                                       – 2020:    +23%
                                                               +23%                Growth
                                                                                 Growth   2012
                                                                                        2012    ‐ 2020:
                                                                                             – 2020: 24%24%

                                    Seaborne Iron Ore Imports

     Growth
   58%   45%2012
       Growth    – 2020:
                34%
              2012        +25%
                   ‐ 2020:35%
                           25%             Growth
                                            Growth2012
                                                   2012– ‐2020:
                                                           2020:+34%
                                                                 34%             Growth
                                                                                  Growth2012
                                                                                         2012– ‐2020:
                                                                                                 2020:35%
                                                                                                       35%

 The shift to Asia will continue but at lower pace
 Seaborne iron ore market penetration is much higher in Asia and emerging economies than developed
nations
 Developed/traditional economies have more availability of scrap or captive mines (NAFTA, CIS, Europe)
Source: Vale estimates
Steel and Iron Ore Market Perspectives - Sergio Espeschit Vale's Director for Middle East 17th Middle East Iron and Steel Conference Dubai ...
Steel intensity of GDP indicates that China, the main market for iron ore
has a long way to go before peaking

                                                                                   Steel intensity of GDP

                                               1.400
                         on per Capiita (kg)

                                                                                                South Korea (1970 to 2011)

                                  )g 1.200
                                   K
                                   (
                                   at                      China (1978 to
                                    i 1.000
                                    p
                                    ac                     2011)                                             Japan (1980 to 2011)
                                     r
                                     e
                                     p 800
                 onsumptio

                                     n                                                                                              USA (1947 to 2011)
                                     o
                                     it
                                      p
                                      m 600                                                                                         Germany (1970 to 2011)
                                      u
                                      s
                                      n
       de Steel Co

                                      o
                                      cl   400
                                       e
                                       e
                                       ts
                                        e 200                                     Brazil (1947 to 2011)
                                        d
                                        u
    Crud

                                        rC
                                                                                 India (1950 to 2011)
                                                  0
                                                       0             10.000         20.000          30.000           40.000             50.000

                                                                              GDP per capita (US$, 2005, Real)

 Source: WSA, IMF, Vale analysis
Steel and Iron Ore Market Perspectives - Sergio Espeschit Vale's Director for Middle East 17th Middle East Iron and Steel Conference Dubai ...
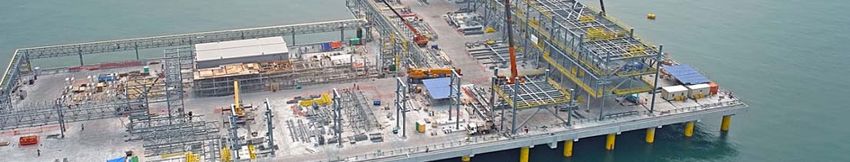
MENA continues to be the top net importing steel region in the world. The
delay in steel projects in the region means that it will likely remain for
some years more

                 MENA Crude Steel Production and Finished Steel Demand (Mt)
                                Crude Steel Production                 Finished Steel Consumption
           60
                        CAGR 2009‐2017: 8.5%                                      CAGR 2009‐2017: 4.6%
           50

           40

           30

           20

           10

             0
                     2009        2010        2011       2012        2013e       2014e      2015e       2016e       2017e

 *MENA: Saudi Arabia, Qatar, UAE, Oman, Bahrain, Iraq, Kuwait, Jordan, Syria, Egypt, Libya, Algeria, Morocco, Tunisia ‐
 Source: CRU
Steel and Iron Ore Market Perspectives - Sergio Espeschit Vale's Director for Middle East 17th Middle East Iron and Steel Conference Dubai ...
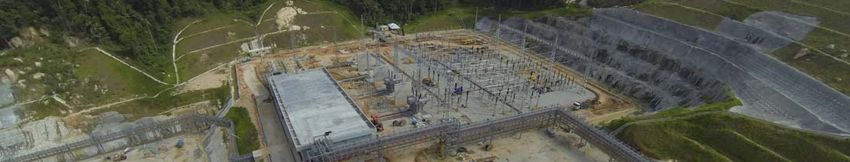
The integration of steel mills and growth of DRI production in MENA is the
main driver of seaborne DR pellet demand

                       MENA DRI Production and DR Pellet Demand Forecast (Mt)
                                       DRI Production              DRP Seaborne Demand
    50
                                                                                   CAGR 2013‐2018: 11.1%
    40

    30

    20

    10

      0
             2007     2008      2009      2010      2011        2012   2013e   2014e   2015e   2016e   2017e   2018e

 *MENA: Saudi Arabia, Qatar, UAE, Oman, Bahrain, Egypt, Libya
 Source: Midrex, Vale estimates (base case)
Steel and Iron Ore Market Perspectives - Sergio Espeschit Vale's Director for Middle East 17th Middle East Iron and Steel Conference Dubai ...
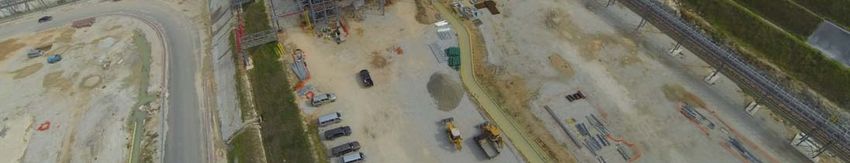
Vale’s total iron ore supply will increase smoothly in the coming years

                      Vale’s total iron ore supply
                                              pp y forecast (Mt)
                                                            ( )
                                                                     453
                                                      411
                                         376
                            348
              321

              2014f         2015f        2016f       2017f           2018f

                        Own Production      Third Parties Purchase
Steel and Iron Ore Market Perspectives - Sergio Espeschit Vale's Director for Middle East 17th Middle East Iron and Steel Conference Dubai ...
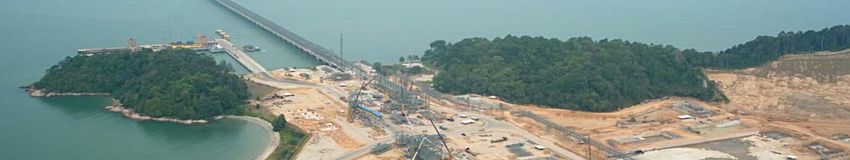
Quantity and Quality

                                                 (Mt)

                                             Average quality:
                                 64.02%            Fe             65.00%
                                  4.45%           SiO2            2.89%
                                  1.26%           Al2O3           1.07%
                                 0.048%             P             0.049%
                                   23%    Seaborne market share    29%

 ¹ S11D expected to reach 90Mt in 2018.
Steel and Iron Ore Market Perspectives - Sergio Espeschit Vale's Director for Middle East 17th Middle East Iron and Steel Conference Dubai ...
Our projects based in our strategy will deliver lower cost, better quality
and lower environmental impact through innovative technologies such as
dry processing and truckless mining

                 ((US$/t
                     $/                  IIron Ore
                                               O Industry’s
                                                   I d t ’ Cost
                                                            C t Curve
                                                                C
               CFR China)                  (Seaborne + China domestic)
                                                                          ~ 30% higher
                                                                         cost producers

                            Vale’s current and
                            future position in
                              the cost curve

                                                                                          (Mt)

 Source: Vale estimates
The shift to Asia challenge
Our logistic strategy through Very Large Ore Carriers, Transfer Stations and
Distribution Center was designed to better compete in Asia combining low
cost, high quality and flexibility to offer better customer service.

 Economies of scale              Sohar         Shorter time to          SOHAR
  and lower carbon    Valemax   Malaysia     market, optimized lot
     emissions                   & FTS         size and blends       A real example

                                                             Sohar

                                                                                  FTS
                                                                              (Philippines)
                                                               DC Malaysia
                                           Valemax
Vale is investing US$ 37 billion in its iron ore strategy, recovering market share,
  reducing cost, improving quality and extending mine life. US$ 18 billion already
  invested and US$ 19 billion to be invested up to 2018
                                                                                               Capex          Increase
MAIN                                                                                        (US$ billion)                   Reduce          Improve
FOCUS         Approved Projects                                Start up      Product                          Volume
                                                                                                                             costs           quality
                                                                                                               (Mtpy)

              Carajás Additional 40 Mtpy + Serra Leste         2H13‐           SF                       7.9      50
              (new processing plant) and CLN 150               1H14
     OLUME

              Mtpy
                  j S11D & CLN 230 Mtpy
              Carajás                     py (mine
                                             (     +           2H16‐           SF                     19.7       90
    VO

              processing plant, railway and port)              2H18

              Conceição Itabiritos                              2H13           PF                       1.2      12
    QUALITY
          Y

              Vargem Grande Itabiritos                          2H14           PF                       1.9      10

              Conceição Itabiritos II                           2H14         PF/SF                      1.2      19

              Cauê Itabiritos                                   2H15         PF/ SF                     1.5      24

              Oman and Tubarão VIII Pelletizing Plants         2H11‐            P                       2.6
      RISE

                                                               1H14
      DED
ENTERPR
 EXTEND

              Teluk
                l k Rubiah
                      b h (DC,
                           (   Malaysia)
                                 l     )                        2H14            ‐                       1.4       ‐

              VLOC fleet* (19 own + 16 chartered) &               ‐             ‐              3.9 & 0.3          ‐
              Floating Transfer Staions / Tubarão P1 up
              grade
                 d

              215 Mt of additional capacity: 65Mt of depletion replacement and 150Mt net growth
*VLOC fleet Capex not included in       the US$ 37 billion total. Equivalent Shipowners capex considered for chartered tonnage equivalent
S11D (mine and plant): the largest project in the iron ore industry

             Equipment’s Stockyards
                                       Nominal capacity: 90 Mtpy.
                                       Start‐up: 2H16.
                                       Total Capex: US$ 19.67 billion
                                        (including logistics)
                                       Stripping ratio: 0
                                                         0.27.
                                                           27
                  Processing plants    Mass recovery: 100%.
                                       Truckless mining, dry processing, no tailings
                                        dam and 70% reduction on greenhouse gases
                                        emissions.
                                       Water saving and forest preservation

                                                                               Earthworks
Conceição Itabiritos II
Q li & Extending
Quality E   di mines
                 i   life
                     lif                    DRP Market
                                                   k
 Refurbishment of existing Conceição plant (new process flow) to process compact
  tab tes.
 itabirites.
                    Primary crushing construction
                                                     Production capacity: 19 Mty.

                                                     Production split: 32% sinter feed and 68% pellet
                                                    feed.
                                                     Estimated CAPEX: USD 1.19 billion.

                                                     Start‐up: 2H14.

                                                       Expected quality: Fe: ~68.10%
                                                                         SiO2+Al2O3: ~2.66%
                                                                         P: ~ 0.023%
Pelletizing Plant Tubarão VIII

                                  Eighth pelletizing plant in
                                   Tubarão Complex
                                  Nominal capacity: 7.5 Mtpy.
                                  Start‐up: 1H14.
                                  Total Capex: US$ 1,321 million
                                  Realized capex until 3Q13: US$ 1,035million
Update ‐ Construction of Malaysia DC ‐ Pictures of August & September
                                                            September, 2013
Oman Industrial Complex          Pelletizing Plant
Total Investment: US$ 2 billion   Shareholders: 70%Vale and 30% Oman Oil
                                  Company
Vale: US$ 1.25 billion
                                  Capacity: 9 million tons
SIPC: US$ 0.25 billion
Oman Shipping:
        pp g US$
               $ 0.50 billion     Distribution Center
                                  Shareholders: 100% Vale
                                  Capacity: Handling of 40 million tons
Vale Oman – Reliable and Consistent Supplier Just in Time Supplier
                                                                                                      (kt)                                Production
                                                                                                         900,000
                                                                                                         800,000
                                                                                                         700,000
                                                                                                         600,000
                                                                                                         500 000
                                                                                                         500,000
                                                                                                         400,000
                                                                                                         300,000
                                                                                                         200,000
                                                                                                         100,000
                                                                                                               0

                                                                                                                   Apr‐11
                                                                                                                            Jul‐11
                                                                                                                                     Oct‐11
                                                                                                                                              Jan‐12
                                                                                                                                                       Apr‐12
                                                                                                                                                                Jul‐12
                                                                                                                                                                         Oct‐12
                                                                                                                                                                                  Jan‐13
                                                                                                                                                                                           Apr‐13
                                                                                                                                                                                                    Jul‐13
                                                                                                                                                                                                             Oct‐13
                                       Quality
                                                Fe %
    68.00
    67.50
    67.00
    66.50
    66.00
    65.50
    65.00
    64.50
    64.00
                13

                                                                                                 13
                         13
                                  13
                                           13
                                                    13
                                                             13
                                                                      13
                                                                               13
                                                                                        13
            Jan‐1

                                                                                             Oct‐1
                     Feb‐1
                              Mar‐1
                                       Apr‐1
                                                May‐1
                                                         Jun‐1
                                                                  Jul‐1
                                                                           Aug‐1
                                                                                    Sep‐1
Vale in Oman
                       O      – Proud to be here
More than 60% of Omanis after 2 years of operation
Creating Value:
The challenges of being a transforming company

     Sustainable and                 Environmentally                    Job Generation                    Local Supply
         Social                     Friendly Operation                                                       Chain
      Responsibility
         p         y                                                                                      Development
                                                                                                                 p

   • Social projects projected to   • Investment of more than        • Omanization rate of over 65%   • Invested more than US$18
   contribute to the development    US$50 million to control                                          million in local Omani
   of the communities in Oman       emissions in the air, soil and   • Majority of Omani employees    companies in 2013
                                    water                            from North Al Batinah, the
                                                                     region where we operate
Th k you!! – ‫ﺷﻜﺮا‬
Thank        ً‫ﺷﻜ ا‬
Vale Volunteers in Oman
You can also read