Q2 2018 Investor Presentation - Dunkin' Brands Investor Relations
←
→
Page content transcription
If your browser does not render page correctly, please read the page content below
Q2 2018 Investor Presentation
Forward Looking Statements
•   Certain information contained in this presentation, particularly information regarding future economic
    performance, finances, and expectations and objectives of management constitutes forward-looking
    statements. Forward-looking statements can be identified by the fact that they do not relate strictly to historical
    or current facts and are generally contain words such as “believes,” “expects,” “may,” “will,” “should,” “seeks,”
    “approximately,” “intends,” “plans,” “estimates” or “anticipates” or similar expressions. Our forward-looking
    statements are subject to risks and uncertainties, which may cause actual results to differ materially from those
    projected or implied by the forward-looking statement.

•   Forward-looking statements are based on current expectations and assumptions and currently available data
    and are neither predictions nor guarantees of future events or performance. You should not place undue reliance
    on forward-looking statements, which speak only as of the date hereof. We do not undertake to update or revise
    any forward-looking statements after they are made, whether as a result
    of new information, future events, or otherwise, except as required by applicable law. For discussion of some of
    the important factors that could cause these variations, please consult the “Risk Factors” section of the
    Company’s most recent Annual Report on Form 10-K. Nothing in this presentation should be regarded as a
    representation by any person that these targets will be achieved and the Company undertakes no duty to
    update its targets.

•   Regulation G
    This presentation contains certain non-GAAP measures which are provided to assist in an understanding of the
    Dunkin’ Brands Group, Inc. business and its performance. These measure should always be considered in
    conjunction with the appropriate GAAP measure. Reconciliations of non-GAAP amounts to the relevant GAAP
    amount are available on www.investor.dunkinbrands.com.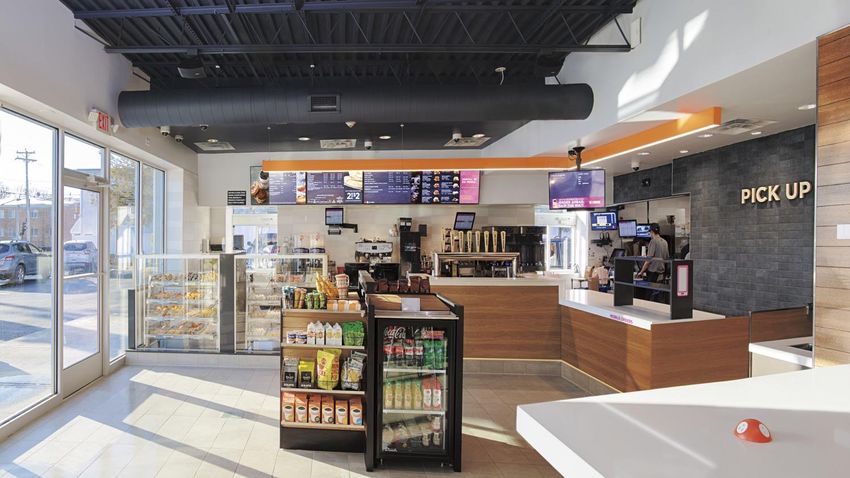
ASSET-LIGHT

   70
YEARS OF BRAND           SIGNIFICANT U.S. &
                                              100%
                                               FRANCHISED
   HERITAGE               GLOBAL GROWTH          BUSINESS
                            OPPORTUNITY

          Dunkin’ Brands is unique in the QSR space
76%       18%
          OF 2017
OF 2017   SEGMENT
SEGMENT   REVENUE
REVENUE

             6%
              OF 2017
              SEGMENT
              REVENUE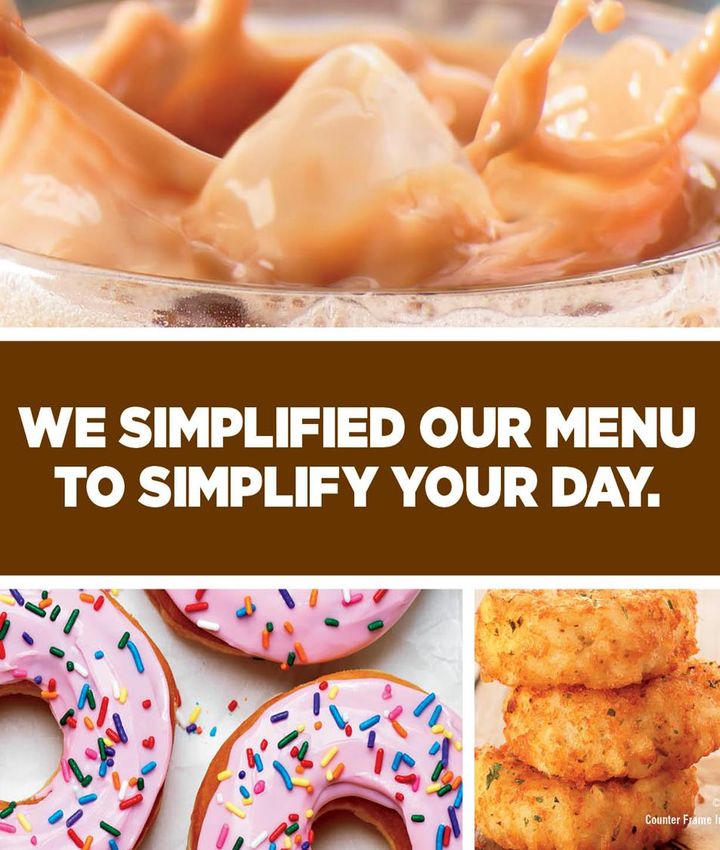
Dunkin’ Donuts U.S.
Dunkin’ is a Brand that can Win
                                                                                                             12 consecutive
                                                            Over 5 billion cups of                           years of being
                   9,000+                                   Dunkin’ coffee
                                                            consumed in 2017*
                                                                                                             named #1 Coffee
                                                                                                             chain by
                   U.S. Stores                                                                               consumers

 $8.5B
                                                #1 seller of donuts
                                                #1 seller of bagels                               #2 seller of muffins
                                                #1 seller of hot flavored coffee                  #2 seller of iced espresso**
Systemwide                                      #1 seller of iced brewed coffee**
Sales in 2017

       Broad DD product accessibility:
                                                                                          5-year growth in
       Ready-to-drink bottled iced coffee,
                                                                                          breakfast sandwich
       K-cups, and bagged coffee in
                                                                                          servings
       grocery and retail

  *Total cups coffee in U.S. restaurants and CPG channels                        **Source: NPD/CREST for LTM May 2018
OUR FOCUS:
BEVERAGE-LED,
 ON-THE-GO
Broad
                  Accessibility
         Unparalleled        Broad
     Unparalleled               Restaurant
         Convenience Accessibility
     Convenience               Excellence

   Menu
    Menu                               Brand
                                        Brand
Innovation
  Innovation                          Evolution
                                      Evolution

                 AMERICA’S
                MOST LOVED
               BEVERAGE-LED,
                 ON-THE-GO
                   BRAND

                                                  8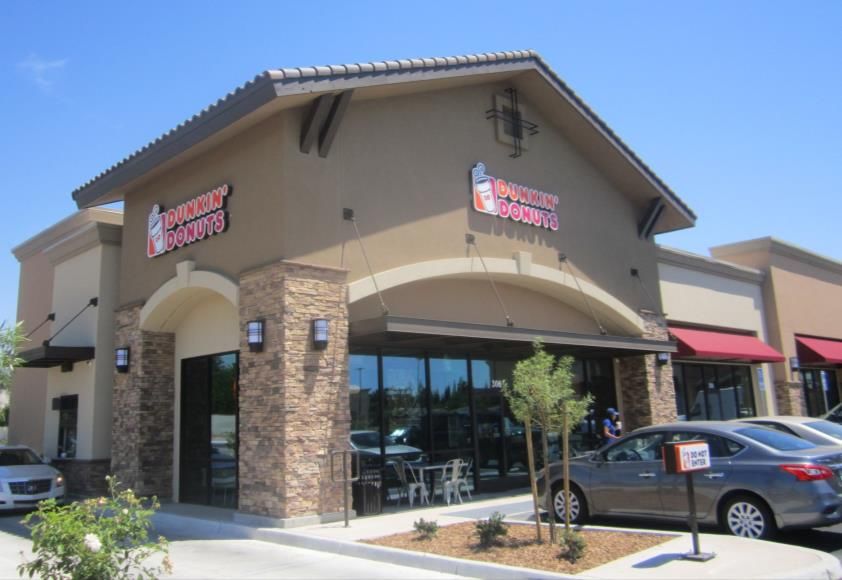
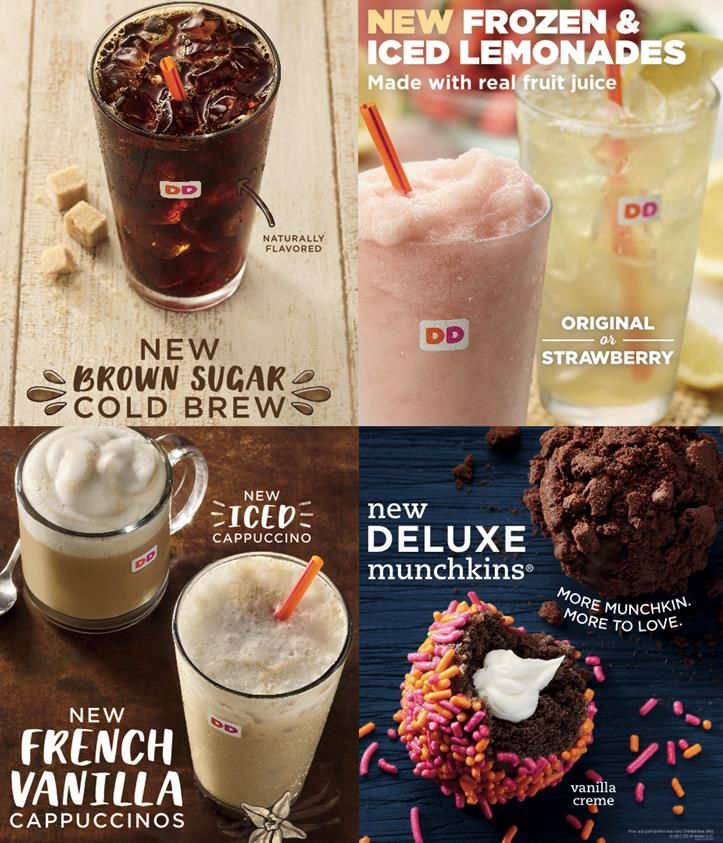
Menu Innovation: Menu Strategy
MENU STRATEGY

• Grow and protect the core
• Expand product innovation
   • Beverage-led
   • Flavor news
   • Food pairings
   • Premium pours
• Create second daypart
• Drive traffic with value
                              10
Unparalleled Convenience: Mobile and Digital Innovation
INDUSTRY LEADING DIGITAL
   & MOBILE INNOVATION

• ~9 million DD Perks Members
• On-the-Go Mobile Ordering
  represents ~3% of transactions
   • Strong retrial rate of 80%
• Navigating balance between loyalty
  member recruitment and meaningful
  engagement
• Integrating mobile ordering with
  Google Assistant and GM
  Marketplace delivering unparalleled
  convenience, broad accessibility to
  guests
Broad Accessibility: Restaurant Growth
 & Consumer Packaged Goods (CPG)
DD U.S. NET DEVELOPMENT
      1,000 net new restaurants by end of 2020
          90%+ outside northeast markets
                          Growth to accelerate   ~50 NextGen concept
 Greater than 275 net
                          with NextGen design     restaurants open by
new restaurants in 2018
                                release                 YE 2018*

                                                                                 14
                                                  *Between new builds and remodels
2016 NEW MARKET
UNIT ECONOMICS
• Traditional restaurants in top developing markets
• Includes markets such as FL, CA, GA, & TN
AVERAGE BEVERAGE AVERAGE UNIT
MIX: VOLUMES
~40% $850K – 950K
AVERAGE INITIAL CASH-ON-CASH
CAPEX RETURNS
As of April 2018
Standalone, traditional Dunkin Donuts Restaurants only
$450K – 550K 20% - 25%
*Not disclosing specific markets for competitive reasons; these are the expected returns
1 Number is rounded; represents the average initial capex for cohort
2 Number is rounded; represents the average unit volume for cohort
3 Number is rounded; represents the average cash-on-cash return for cohortLeveraging CPG to Build Brand in New Markets
• $860M in retail sales in 2017
• $710M CPG SKUs
Grab and Our
• $150M Dunkin’ RTD Coffee Go Brands/
• Dunkin’ Donuts Iced Coffee Your Home
named #3 best-selling new brand
in 2017 by IRI, within food and
beverage category
• 6 out of every 10 cups of Dunkin’ Brewed
coffee consumed in the U.S. came On-the-Go
from a Dunkin’ CPG product
• Opportunity for new product
innovation across brandsRestaurant Excellence: Menu Simplification
MENU SIMPLIFICATION:
Making Room for
Future Innovation
• Rolled out nationally in Q1 2018
• Eliminated 10% of required menu
items
• Slow-moving, complex, off-strategy
items
• Improved menu consistency across
the country
• Key benefits: Guest and crew
satisfaction, speed of service,
accuracy, labor efficiency,
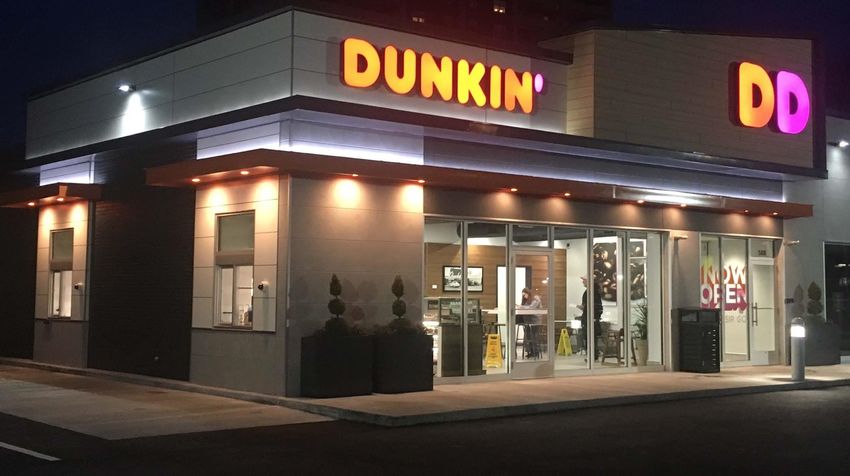
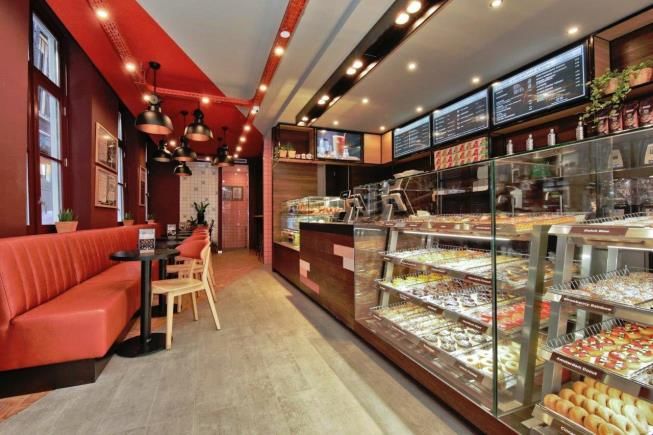
franchisee profitability 18Brand Evolution: Next Generation Restaurant
Dunkin’ Donuts
NextGen Restaurant
   Corona, CA

                     20
Dunkin’ Donuts
NextGen Restaurant
Quincy, MA
21Baskin-Robbins U.S.
Modernizing to attract younger guests
Key initiatives include:
• New premium products (e.g.
  Sundae Shakes, Cookie Cakes)
• Enhancing convenience with
  new ways to order:
    • Digital in-store ordering
    • New e-Commerce website
    • Home delivery
• Testing conceptual next
  generation store design

                                        23
International
Focusing on strategic markets and long-term
growth opportunities
• Stabilizing Dunkin’ Donuts International by
  positioning it as coffee-focused while
  maintaining strong donut and bakery equity
   • Opened ~60 newly-designed restaurants
     across 8 international markets
• Baskin-Robbins International is focused on ice
  cream gallon consumption across the business:
  through stores, delivery, and consumer
  packaged goods
• Delivery continues to be opportunity with tests
  underway across a number of key markets

 Baskin-Robbins is the #1 quick-service brand in the Middle East   Baskin-Robbins   25
                                                                         UK
Financial Targets
Our Financial Targets
2018                                                       Long-Term (Through 2020)
DUNKIN’ DONUTS U.S.                                    DUNKIN’ DONUTS U.S.
•   ~1% comp store sales growth                        •    Low-single digit comp store sales growth
•   >275 net new unit development                      •    1,000 net new unit development

BASKIN-ROBBINS U.S.
                                                       BASKIN-ROBBINS U.S.
• Low-single digit comp store sales growth
                                                       •    Low-single digit comp store sales growth
•   0-10 net unit development
                                                       •    0-10 net unit development
Low-to-mid single digit % revenue growth
                                                       Low-to-mid single digit % revenue growth
Mid-single digit % operating and adjusted
                                                       Mid-to-high single digit % operating and adjusted
 operating income growth*
                                                        operating income growth
Low-single digit reduction to 2017 G&A expense*
                                                       G&A 2%-3% annual growth
25% effective tax rate
                                                       ~28% effective tax rate
$2.48- $2.56 GAAP Diluted EPS*
$2.68 - $2.72 Non-GAAP Diluted EPS*
       *Guidance reflects update as of July 26, 2018
The “Perks” of
Investing in Reliable and diversified
Dunkin’ Brands financial results
Asset-light, 100%
franchised model
Strong free cash flow
conversionYou can also read