www.iaeedc-chapter.com - IAEE DC Chapter
←
→
Page content transcription
If your browser does not render page correctly, please read the page content below
www.iaeedc-chapter.com
Welcome!
  May 2020
Lunch & Learn
                www.iaeedc-chapter.com
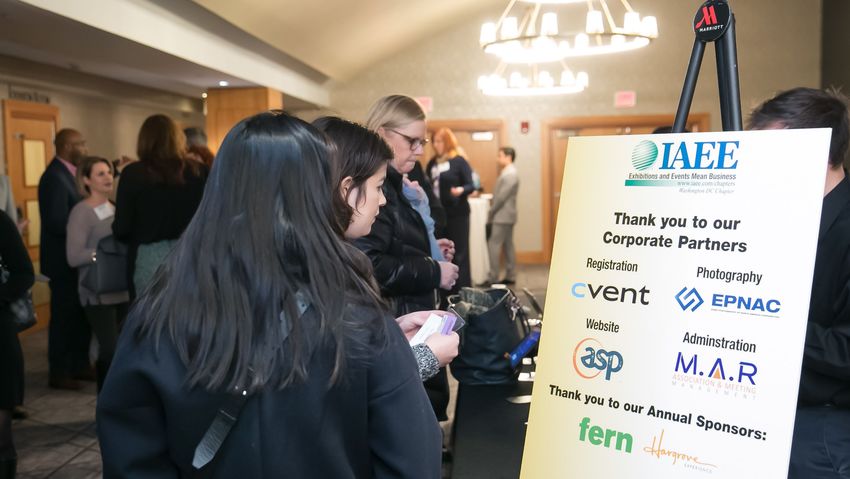
Sponsorships – Annual Partners

Website       Registration    Signage      Newsletter

          Audio Visual
                             Photography   Administration

                                                            www.iaeedc-chapter.com
IAEE DC COVID-19 Community Outreach
Your generosity has helped the chapter has raise
$690 to support the Capital Area Food Bank. The DC
chapter is providing a $500 match to these
donations. This donation will purchase approximately
420 pounds of food.
Humane Rescue Alliance (HRA) takes in an average
of 30 animals per day. The team works around the
clock to provide for all of the animals, but shelter
space and resources are limited. Volunteers are
needed to foster or help at the shelter.
Visit the chapter website at www.iaeedc-chapter.com for more
information on how you can give of your time and talents.
www.iaeedc-chapter.com
IAEE DC Chair's Charity

The Michael J. Fox Foundation’s (MJFF) agenda is focused on building improved
knowledge about the lived experience of Parkinson's disease, finding an objective test
for Parkinson’s, engaging patients in research and supporting the development of new
treatments and a cure.

           88 cents of every $1.00 is put towards research
To learn more about this amazing foundation and the important work they are doing to find a cure for
Parkinson's disease, visit their website at https://www.michaeljfox.org/. When registering for an IAEE DC
Chapter event, you can donate by giving online here.

                                                                                                 www.iaeedc-chapter.com
Call for Chapter Volunteers
                        Committees
     We need just a few hours of your time to serve on chapter
     committees. Opportunities range from communications,
     community service, marketing, program, special events,
     sponsorship, nominating and young professionals.

                  Board of Directors
     Want to be part of the vision for the chapter? Complete the
     interest form to inform leadership of your interest to serve
     on the chapter board of directors. The board meets four to
     six times per year.

     Visit the chapter website at www.iaeedc-chapter.com to
     learn more about these opportunities or to complete the
     interest form.

                                                                    www.iaeedc-chapter.com
We Need Your
      Support
 Become a sponsor of a future
    program and/or event.

Visit the website at www.iaeedc-
           chapter.com
      or contact the Chapter
      Administrator for more
            information
 iaeedc@myassociationhq.com
                                   www.iaeedc-chapter.com
Stay Connected – Visit IAEE Member Resources

                                           www.iaeedc-chapter.com
Globally recognized designation that demonstrates the
highest professional standard throughout the
exhibition and event management arena

Curricula reflects the latest thinking in exhibitions and
events management

Emphasis on practical knowledge

Candidates must have at least three (3) years of
fulltime experience in the exhibitions and events
industry

                                             www.iaeedc-chapter.com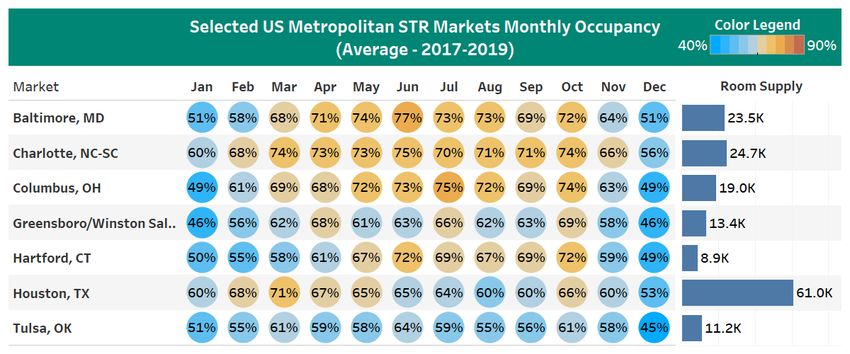
Audience Engagement Opportunities
                        (aka Door Prizes)
• Three opportunities to win door prizes today
• Rules of engagement
   • Question will be asked
   • First correct response in the chat feature will win one of three prizes
 • Door prizes
   • Round trip airfare for two and a 2-night stay at Seminole Hard Rock Hotel and
     Casino, compliments of Fort Lauderdale. Travel must be booked in 2021,
     some blackout dates will apply.
   • Round trip airfare for two and 2-night stay at Diplomat Beach Resort,
     compliments of Fort Lauderdale. Travel must be booked in 2021, some
     blackout dates will apply.
   • 25,000 World of Hyatt Points, compliments of Hyatt National Sales

                                                                               www.iaeedc-chapter.com
Question #1
What are the dates and
location of Expo! Expo! 2020?
www.iaeedc-chapter.comSTR Data –
Powering the
Future
www.iaeedc-chapter.comOur Panel for Today
www.iaeedc-chapter.comwww.iaeedc-chapter.com
RevPAR Growth: The Downturn is Officially Here
Total U.S. 1/1990 – 03/2020
 20

 10

  0
                   111 Months            56 Months             115 Months
-10                (out of 112)                                (out of 119)

-20

-30

-40

-50
                                                                                                        -51.9
-60
   1990                           2000               2010                                                2020
                                                            Source: STR. 2020 © CoStar Realty Information, Inc.   15
What happened then? 9/11 and 2009 Source: 2020 STR, LLC / STR Global, Ltd. trading as "STR". © CoStar Realty Information, Inc. Any reprint, use or republication of all or a part of this presentation without the prior written approval of STR is strictly prohibited. Any such reproduction shall specifically credit STR as the source. This presentation is based on data collected by STR. The information in the presentation should not be construed as investment, tax, accounting or legal advice. 16
ADR Rebound After External Shock Takes Time
Total U.S., 12MMA , Monthly ADR % Change, Indexed to Event

               09/01 - 09/04 (9/11)                 09/08 - 05/13 (Lehman Bros)

 0%

-2%

-4%                    -3.9%

-6%

-8%

-10%                                       -9.9%
       0   6             12           18       24           30           36       42               48                    54
                                                                                       Source: STR. 2020 © CoStar Realty Information, Inc.   17
2009: Top25 Transient Demand Rebounds Quickly
Lux & UU Class, Segmentation, by Month
Transient Demand % Change Group Demand % Change
15
10 7 Months
5
0
-5
-10
-15
-20
-25
Sep 08 Dec 08 Mar 09 Jun 09 Sep 09 Dec 09
Source: STR. 2020 © CoStar Realty Information, Inc. 182009: Top25 Group ADR > Transient ADR
Lux & UU Class ADR, by Segmentation, by Month
Transient Group
$200
$150
$100
Sep 08 Dec 08 Mar 09 Jun 09 Sep 09 Dec 09
Source: STR. 2020 © CoStar Realty Information, Inc. 19What happens now? Source: 2020 STR, LLC / STR Global, Ltd. trading as "STR". © CoStar Realty Information, Inc. Any reprint, use or republication of all or a part of this presentation without the prior written approval of STR is strictly prohibited. Any such reproduction shall specifically credit STR as the source. This presentation is based on data collected by STR. The information in the presentation should not be construed as investment, tax, accounting or legal advice. 20
Group ADR Will Drop
 12 MMA, 1/2019 – 03/2020

              Demand % PC   ADR % PC
3
2
1
0
-1
-2
-3
-4
-5
-6
-7
     Apr-19                       Jul-19   Oct-19       Jan-20
                                                    Source: STR. 2020 © CoStar Realty Information, Inc.   21
Segmentation: No Corporate Demand
Total U.S., Segmentation KPIs, % Change, week ending April 25
Transient Group
Occupancy -87.4 -84.3
ADR -45.8 -44.7
RevPAR -93.2 -91.3
Source: STR. 2020 © CoStar Realty Information, Inc. 22Weekly Room Demand: Slowly Increasing (?)
Total U.S., by Week
25
23.1
20
Millions
15
10 8.6
7.2
5
0
7-Mar 14-Mar 21-Mar 28-Mar 4-Apr 11-Apr 18-Apr 25-Apr
Source: STR. 2020 © CoStar Realty Information, Inc. 23Top 25: Still 5 Markets With Occupancy Under 20%
Occupancy %, Week end April 25
Oahu Island, HI
Orlando, FL
Minneapolis/St Paul, MN-WI
Boston, MA
New Orleans, LA
San Francisco/San Mateo, CA
Anaheim/Santa Ana, CA
Washington, DC-MD-VA
Nashville, TN
St Louis, MO-IL
Seattle, WA
Denver, CO
Chicago, IL
Tampa/St Petersburg, FL
Miami/Hialeah, FL
Philadelphia, PA-NJ
Houston, TX
Phoenix, AZ
Dallas, TX
Detroit, MI
San Diego, CA
Atlanta, GA
Los Angeles/Long Beach, CA
Norfolk/Virginia Beach, VA
New York, NY
0 5 10 15 20 25 30 35 40 45
Source: STR. 2020 © CoStar Realty Information, Inc. 24What happens next? Source: STR 2020 © CoStar Realty Information, Inc. 25
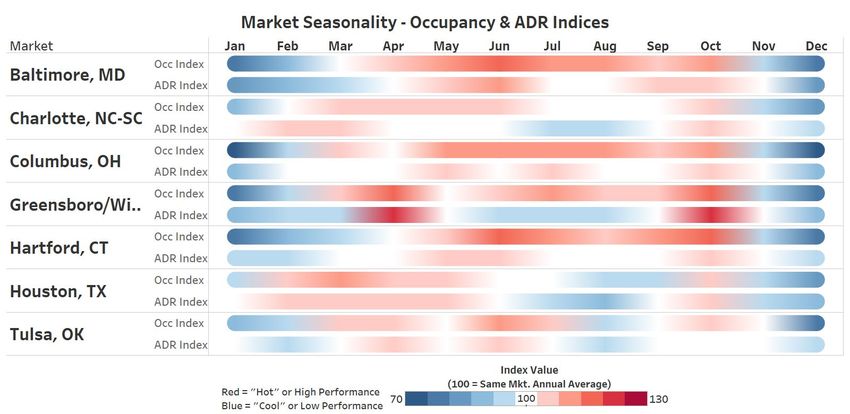
Markets with Most Hotel Availability Sept-Feb
Markets Over 8,500 rooms w/ Avg. Occupancy under 75%, Rooms in 000’s

                                                                                   94.5

                    38.8
     35.5
                                    29.3
                                                    20.8
                                                                                                               17.3
                                                                    13.3

 Baltimore, MD   Charlotte, NC   Columbus, OH   Greensboro, NC   Hartford, CT   Houston, TX                 Tulsa, OK
                                                                                      Source: STR. 2020 © CoStar Realty Information, Inc.   26
Source: STR. 2020 © CoStar Realty Information, Inc. 27
Source: STR. 2020 © CoStar Realty Information, Inc. 28
Determining the Rate Options
Q1 & Q4 Avg. Group ADR

                                                Q4 Group ADR
                                                Q1 Group ADR                             $121
   $119
                         $118

                  $113
          $111                                                      $111          $110

                                  $104 $104                                $105

                                                     $98

                                                           $91

                                                                                                                $85
                                                                                                                          $83

 Baltimore, MD   Charlotte, NC   Columbus, OH     Greensboro, NC   Hartford, CT   Houston, TX                   Tulsa, OK

                                                                                                                                        2929
                                                                                      Source: STR. 2020 © CoStar Realty Information, Inc.
Large Markets Grow Rapidly
Largest % In Top 26 Markets, March 2020
Rooms In
Market Construction % Of Existing
Nashville, TN 5,878 12%
New York, NY 14,051 11%
Orlando, FL 8,737 7%
Miami/Hialeah, FL 3,897 7%
Boston, MA 3,802 6%
Los Angeles/Long Beach, CA 6,640 6%
Tampa/St Petersburg, FL 3,045 6%
Dallas, TX 5,751 6%
Detroit, MI 2,732 6%
Anaheim/Santa Ana, CA 3,211 6%
Source: STR. 2020 © CoStar Realty Information, Inc. 30Forecast as of March 30
Key Performance Indicator Outlook (Absolute Values)
For
U.S. Outlook
Comparison
2020 2021
Year 2019 2013
Forecast Forecast
Occupancy 66.1% 37.9% 59.7% 62.3%
ADR $131 $113 $117 $110
RevPAR $87 $43 $70 $68
-20% Source: STR 2020 © CoStar Realty Information, Inc. 31Question #2
To earn your Certified in Exhibition Management (CEM)
credential, how many modules must be successfully
completed?
Answer
Nine (9) modules are required to earn a CEM credential
www.iaeedc-chapter.comwww.iaeedc-chapter.com
35

            Prior Recessions

 Shift in       Shift in       Shift in
location       numbers          size
Tertiary Market 2008-2011
Winston Salem Event Count 2008-2011
600
500
400
300
200
100
-
January February March April May June July August September October November December
2008 2009 2010 2011
36Tertiary Market 2008-2011
Winston Salem Average Square Footage Used 2008-2011
2,500
2,000
1,500
1,000
500
-
January February March April May June July August September October November December
2008 2009 2010 2011
37Tertiary Market 2008-2020
Winston-Salem Average Events & Square Footage by Year
2,500
2,000
1,500
1,000
500
-
2008 2009 2010 2011 2012 2013 2014 2015 2016 2017 2018 2019 2020
Average Number of Events Average Square Footage Used
38Secondary Market 2008-2011
Hartford Event Count 2008-2011
500
450
400
350
300
250
200
150
100
50
-
January February March April May June July August September October November December
2008 2009 2010 2011
39Secondary Market 2008-2011
Hartford Average Square Footage Used 2008-2011
3,000
2,800
2,600
2,400
2,200
2,000
1,800
1,600
1,400
1,200
1,000
January February March April May June July August September October November December
2008 2009 2010 2011
40Secondary Market 2008-2020
Hartford Average Events & Square Footage by Year
7,000
6,000
5,000
4,000
3,000
2,000
1,000
-
2008 2009 2010 2011 2012 2013 2014 2015 2016 2017 2018 2019 2020
Average Number of Events Average Square Footage Used
41Primary Market 2008-2011
New York Event Count 2008-2010
2,000
1,800
1,600
1,400
1,200
1,000
800
600
400
200
-
January February March April May June July August September October November December
2008 2009 2010 2011
42Primary Market 2008-2011
New York Average Square Footage Used 2008-2011
3,000
2,500
2,000
1,500
1,000
500
-
January February March April May June July August September October November December
2008 2009 2010 2011
43Primary Market 2008-2020
New York Average Events & Square Footage by Year
4,500
4,000
3,500
3,000
2,500
2,000
1,500
1,000
500
-
2008 2009 2010 2011 2012 2013 2014 2015 2016 2017 2018 2019 2020
Average Number of Events Average Square Footage Used
44What will recovery look like?
46

            Prior Recessions

 Shift in       Shift in       Shift in
location       numbers          size
Thank You kwhite@knowland.com
www.iaeedc-chapter.com
Question #3
What is one of the three non-profits that were
        highlighted in today's session?

                       Answer
  Michael J. Fox Foundation for Parkinson's Research, IAEE DC Chair’s Charity
                  donate here to support the Chair’s Charity.
                           Capital Area Food Bank
                          Humane Rescue Alliance

                                                                        www.iaeedc-chapter.com
Resources and Reminders
• Virtual IAEE Exhibition Day: June 3
• No cost to participate
• Register at www.iaee.com
• Industry Websites for Resources
• www.iaee.com
• www.eic.org
• www.ceir.org
• Recording of Webinar
• www.iaeedc-chapter.com
www.iaeedc-chapter.comYou can also read