CONSUMER CONFIDENCE REFLECTED IN E-COMMERCE GROWTH - Consumer Connect Q4 2018 Joan Driggs Vice President Content and Thought Leadership - IRi
←
→
Page content transcription
If your browser does not render page correctly, please read the page content below
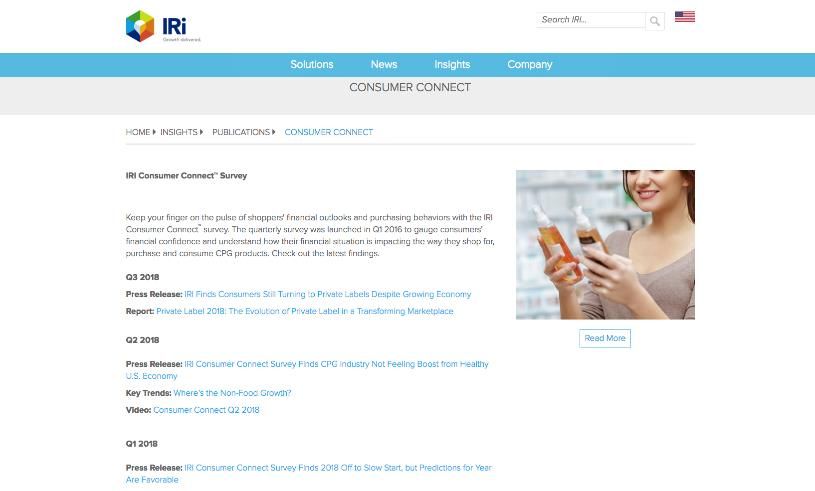
Consumer Connect Q4 2018

CONSUMER CONFIDENCE
REFLECTED IN
E-COMMERCE GROWTH
Joan Driggs
Vice President
Content and Thought Leadership
February 2019

Consumer Connect Q4 2018
IRI’s Consumer Connect Survey is published after each calendar quarter and reflects shoppers’ reported
economic health, as well as behaviors and attitudes toward purchasing and utilizing CPG and health
care products.

For the most recent quarter, October – December 2018, we focus on respondents’ e-commerce attitudes
and behaviors. To review past Consumer Connect reports, click here.

                                                             © 2019 Information Resources Inc. (IRI). Confidential and Proprietary.   2
Executive Summary

   Consumer confidence has remained favorable             Hand-in-hand with consumer confidence is the
   over the past several years. Still, 30 percent of      growing and evolving e-commerce channel.
   respondents to IRI’s Consumer Connect Survey           Consumers are increasingly comfortable with
   report they struggle financially.                      online purchasing and retailers of all stripes are
                                                          investing in their online offerings.
   Notably, Gen Xers, followed by Millennials, are
   the most likely to report they struggle to afford      Non-food items, particularly personal care
   needed groceries. But these generations are            and home care products, are tops in online
   increasingly working their way out of debt and         purchases. IRI E-Market Insights reports that
   into greater financial stability. Some 55 percent of   vitamins, pet food and supplies, and skin care
   total Consumer Connect Survey respondents              products are the top selling items.
   report their households are in good financial
   shape, up 4 percentage points from Q3 2018.            Pure-play retailers garner well more than
                                                          half of all online CPG purchases, but traditional
   While 2019 is off to a rocky start, with a partial     brick-and-mortar retailers continue to invest
   government shutdown and trade challenges               and win share of the e-commerce pie.
   attributed to tariffs, consumers at the close of
   2018 were buoyed by their strong household
   financial health and were spending accordingly.

                                                               © 2019 Information Resources Inc. (IRI). Confidential and Proprietary.   3
Consumer Sentiment Is Up Nearly One Point Versus Q4 2017
However It Inched Up Marginally Since Q3 2017

                                             Consumer Sentiment Index
                                                   Total U.S.
          100.0%                                                                                              In Q4 2018, consumer
 100.0%
                                                                                                              sentiment increased
                                                                                              99.5%           as incomes rose and
  99.5%
                                                                                                              unemployment declined.
                                                 99.0%
  99.0%
                                                                                                                98.7%
                                                         98.6%
  98.5%
                                                                                                                                           98.2%

  98.0%

                      97.5%
  97.5%                                                                                                                     97.6%
                              97.0%                                                 97.3%
  97.0%

                                                                 96.8%
  96.5%
                                         96.4%
  0.0%
       Q1           Q2         Q3      Q4         Q1      Q2      Q3             Q4             Q1             Q2             Q3             Q4
      2016         2016       2016    2016       2017    2017    2017           2017           2018           2018           2018           2018

                                                                                                                                          Average = 100
                                                                                                                     Source: Consumer Connect™, Q4 2018

                                                                        © 2019 Information Resources Inc. (IRI). Confidential and Proprietary.     4
Fifty-five Percent of Consumers Report
Their Financial Situation Is Healthy
Especially Seniors and High-income Households
Households Having Good Financial Health
% of Households, Total U.S.
> $100K 82%
Q4 2018 55%
64%
Income
$55K-$99.9K
$35K-$54.9K 55%
Q3 2018 51%
< $35K 30%
Q2 2018 55%
Millennials 53%
Generation
Q1 2018 56%
Gen X 51%
Boomers 52%
Q4 2017 53%
Seniors 67%
Source: IRI Consumer Connect™, Q4 2018
© 2019 Information Resources Inc. (IRI). Confidential and Proprietary. 5Among Generations, Gen X Report Having the Most Difficulty
Affording Needed Groceries, Followed by Millennials
34%
of Millennials
30% 36%
of consumers of Generation Xers
have difficulty
affording needed 32%
of Boomers
groceries
20%
of Seniors
Source: Consumer Connect™, Q4 2018
© 2019 Information Resources Inc. (IRI). Confidential and Proprietary. 6Online Shopping to Save Money Is Increasingly
Popular Among Millennials and Gen X Consumers
Online Shopping Value Perceptions
by Generation
Online order/in-store pick-up 38%
(click-and-collect) allows me 49%
48%
convenience without the 38%
added shipping fee 24%
20%
Buying online allows 31%
me to find lower-priced 21%
food and beverage options 20%
12%
Buying online allows 23%
me to find lower-priced 28%
23%
OTC medication 23%
options 18%
Buying online allows 29%
me to find lower-priced 45%
beauty/personal care 35%
27%
product options 14%
30%
Buying online allows 43%
me to find lower-priced 36%
home care options 27%
19%
Total U.S. Gen X Seniors
Millennials Boomers
% of respondents, Top 2 Box Summary
Source: IRI Consumer Connect™, Q4 2018
© 2019 Information Resources Inc. (IRI). Confidential and Proprietary. 7In Addition to Convenience, Free and Fast Shipping
Are Also Main Drivers for Online Shopping
Capabilities That Drive Channel Selection
57%
Online purchasing 68%
with 69%
56%
free delivery 43%
47%
Online purchasing 56%
with 61%
45%
fast delivery 32%
40%
Online purchasing 52%
with 50%
39%
in-store pick up 23%
30%
Online purchasing 42%
of freshly 42%
28%
prepared items 16%
20%
Subscription services 26%
for frequently purchased 33%
17%
grocery items 11%
Total U.S. Gen X Seniors
Millennials Boomers
% of respondents, Very/Important Summary
Source: IRI Consumer Connect™, Q4 2018
© 2019 Information Resources Inc. (IRI). Confidential and Proprietary. 8E-Commerce Sales Are Shining Star of CPG Omni-Channel Universe
$58.9 Billion E-Commerce CPG Sales
52 Weeks Ending 12/30/2018
E-Commerce Sales are
35.4%
Increase from year ago
11% …but represent
of total
CPG Sales…
64%
of total
Omni-Channel Growth
Source: IRI E-Market Insights Dashboard, January 2019; the categories include the 145 releasable E-Commerce categories from IRI E-Market Insights; 52 weeks ending 12/30/2018.
© 2019 Information Resources Inc. (IRI). Confidential and Proprietary. 9TOP
Categories: Top, Bottom, and Growing
Top 10 E-Commerce Categories
by Dollar Sales
Dollar Sales Dollar Sales E-Commerce Share of
($millions) % Change vs YA Omni-Channel Sales
Vitamins $7,410.1 35% 49.9
Pet Supplies $5,652.7 44% 56.3
Pet Food $3,503.7 42% 23.1
Skin Care $3,354.5 30% 46.0
Coffee $2,232.9 26% 18.7
Weight Control $1,907.1 24% 33.2
39.6
Cosmetics—Facial $1,399.8 15%
Fragrances—Women’s $1,385.1 21% 67.4
Cosmetics—Eye $963.9 23% 31.7
Hair Conditioner $946.3 43% 29.9
Source: IRI E-Market Insights Dashboard, January 2019; sales are the sum of 145 tracked categories
Source: IRI Market Advantage, IRI E-Market Insights, latest 52 weeks ending 12/30/18
© 2019 Information Resources Inc. (IRI). Confidential and Proprietary. 10GROWTH
Categories: Top, Bottom, and Growing
E-Commerce Categories With the Most Growth
by Dollar Sales % Change
Dollar Sales Dollar Sales E-Commerce Share of
($millions) % Change vs YA Omni-Channel Sales
Gastrointestinal—Liquid $338.9 310% 23.1
Hot Cereal $273.3 151% 17.2
Adult Incontinence $359.1 84% 15.8
Lunches—Rfg. $48.9 81% 2.0
Cold/Allergy/Sinus Tablets $469.2 78% 9.1
Appetizers/Snack Rolls—Frozen $48.5 77% 2.4
Breakfast Food—Frozen $87.8 74% 2.6
Dough/Biscuit Dough—Rfg. $31.2 74% 1.7
Baking Mixes $62.9 72% 4.1
Cream Cheese/Cr Chs Spread $38.4 70% 2.2
Source: IRI E-Market Insights Dashboard, January; sales are the sum of 145 tracked categories
Source: IRI Market Advantage, IRI E-Market Insights, latest 52 weeks ending 12/30/18
© 2019 Information Resources Inc. (IRI). Confidential and Proprietary. 11Traditional Brick-and-Mortar Retailers Need to Invest
in Customer Experience Both Online and In-Store
Channel Dollar Sales ($millions) % of Total E-Commerce
Total E-Commerce-RMA—E-Commerce $58,618.3 100%
Online Multi-Category (ex. Amazon, Peapod, FreshDirect) $32,226.8 55%
B&M Multi-Category (ex. Walmart, Kroger, CVS) $11,421.0 19%
Online Specialty (ex. Chewy, Birchbox) $4,965.1 8%
Brand / DTC (ex. Dollar Shave Club, Keurig, Lindt) $2,439.8 4%
B&M Specialty (ex. Petco, Sephora) $2,196.2 4%
Pure Marketplace (ex. eBay) $894.7 2%
Meal Kits $9.6 0%
Channel Dollar Sales ($millions) % of Total E-Commerce % of B&M Multi-Category
B&M Multi-Category $11,421.0 19% 100%
Mass $4,259.4 7% 37%
Grocery $2,120.5 4% 19%
Drug $1,919.4 3% 17%
Club $1,303.4 2% 11%
Dollar $54.0 0% 0%
2018 CY, Sum of 145 Tracked E-Market Insights Categories
© 2019 Information Resources Inc. (IRI). Confidential and Proprietary. 12E-Commerce Sales Are Evenly Split Between Click & Collect
and Delivery Fulfillment Methods
Sales mixes are opposite when comparing edible and non-edible categories, however.
Fulfillment Type Share For Brick & Mortar Multi-Category Retailers
(Walmart, Kroger, Etc.)
34%
53%
63%
66%
47%
37%
All Tracked Categories Edible Categories Non-Edible Categories
Delivery/Ship Click & Collect
Source: IRI eMarket Insights 3.0, IRI Market Advantage, 52 Weeks Ending 12/30/18, Aggregate of 145 Tracked Categories, Based on Aggregate of Retailers with Multiple Fulfillment Types
© 2019 Information Resources Inc. (IRI). Confidential and Proprietary. 13Reviews and Opinions Posted in Social Media
Influence Consumers’ Purchase Decisions
Social Media Influence on Brand Behavior
by Generation
46%
I will switch to a 56%
new brand if
58%
I’ve read a
good review online 45%
32%
21%
I like to share 31%
my opinions about
31%
brands on
social media 20%
6%
Total U.S. Gen X Seniors
Millennials Boomers
% of respondents, Top 2 Box Summary
Source: IRI Consumer Connect™, Q4 2018
© 2019 Information Resources Inc. (IRI). Confidential and Proprietary. 14Convenience and Choice Are Key Drivers
Towards Online Grocery Shopping
Benefits of Online Shopping
by Generation
21%
33%
Online ordering
makes it easier to find
needed grocery items 25%
21%
11%
Total U.S. Gen X Seniors
Millennials Boomers
% of respondents, Top 2 Box Summary
Source: IRI Consumer Connect™, Q4 2018
© 2019 Information Resources Inc. (IRI). Confidential and Proprietary. 15Nearly 54% of the Younger Generations Feel They
Are Less Likely to Make Impulsive Purchases Online
Propensity to Make Additional Purchases
by Generation
50%
54%
I am less likely to make
impulse purchases
when buying online 54%
49%
44%
Total U.S. Gen X Seniors
Millennials Boomers
% of respondents, Top 2 Box Summary
Source: IRI Consumer Connect™, Q4 2018
© 2019 Information Resources Inc. (IRI). Confidential and Proprietary. 16Many Consumers, Especially Seniors Clip Coupons and
Look to Retailers’ Circulars During Their Shopping Trips
Circulars/Coupons Behavior
by Generation
67%
68%
Compare prices in
66%
retailers’ circulars
67%
69%
60%
58%
Clip coupons from
59%
circulars/newspapers
59%
66%
35%
51%
Download coupons from
43%
online deal sites
34%
18%
Total U.S. Gen X Seniors
Millennials Boomers
% of respondents, Frequently/Occasionally Summary
Source: IRI Consumer Connect™, Q4 2018
© 2019 Information Resources Inc. (IRI). Confidential and Proprietary. 17Download of Coupons and Price Comparison on Retailer
Websites Tops Among the Money-Saving Opportunities
Purchase Behavior in the Coming Year
Download coupons from a
54%
retailer/manufacturer website
Compare prices on area
retailers’ websites to find the 53%
lowest prices on needed items
Order online and
23%
pick up in store
Order online for
22%
home delivery
Use online subscription services
11%
for some of my grocery items
Use online meal kit
5%
delivery services
% of respondents, Frequently/Occasionally Summary
Source: IRI Consumer Connect™, Q4 2018
© 2019 Information Resources Inc. (IRI). Confidential and Proprietary. 18In 2019, More Grocery Spending Will Happen Online
Online
U.S. Grocery
Shopping
Consumers
Value Perceptions,
Who Shop byOnline
Generation
(%)
59% • While online shopping still represents a small part of the
overall grocery market, KPMG reports a growing
48% number of consumers plan to shift more of their food
buying online in 2019.
• In an effort to remain relevant with shoppers, more
traditional brick-and-mortar retailers, including grocery
chains, mass merchants and drug chains, are investing
heavily in their online shopping offerings. These
retailers face the double challenge of improving the
shopper experience both online and in-store.
• Look for more retailer investments in mobile interfaces,
such as payments and endless aisle assortment, as
2018 2019 (projected)
they work to catch up with consumers already
2018 Grocery Retail Consumer Perception Survey comfortable using their mobile devices to manage
routine tasks.
Source: https://www.digitalcommerce360.com/2018/10/26/more-grocery-purchases-will-move-online-in-2019/
© 2019 Information Resources Inc. (IRI). Confidential and Proprietary. 19Highlights: E-Commerce Sales Benefit From Consumer
Comfort With Technology and Financial Health
Even shoppers working to stay within budgets are turning to online shopping;
they leverage ability to make price comparisons and download coupons.
An increasing number of consumers look for reviews and recommendations
from online sources to help them make buying decisions.
Home care items top the list of online purchase categories, followed by
beauty/personal care products. However, vitamins rank as most purchased item.
Fifty percent of consumers report they are less likely to make impulse purchases
when shopping online; highest among high-income groups and millennials.
Online orders with free/fast delivery are gaining traction among high-income
consumers and those with kids.
Online shoppers appreciate delivery options, easy ordering, and
lower-priced options.
© 2019 Information Resources Inc. (IRI). Confidential and Proprietary. 20MORE INFO AVAILABLE
IRI Consumer Connect Analysis since 2016:
https://www.iriworldwide.com/en-
US/Insights/Publications/Consumer-Connect
E-Market Insights 3.0 Press Release:
https://www.iriworldwide.com/en-US/News/Press-
Releases/IRI-Announces-Enhancements-to-Industry-
Leading-E-Commerce-Measurement-and-Insights-Solution
© 2019 Information Resources Inc. (IRI). Confidential and Proprietary. 21Joan Driggs
Joan.Driggs@IRIworldwide.com
Vice President, Content and Thought Leadership
THANK YOU Sam Gagliardi
Sam.Gagliardi@IRIworldwide.com
Senior Vice President, E-Commerce
© 2019 Information Resources
© Inc.
2019(IRI).
Information
Confidential
Resources
and Proprietary.
Inc. (IRI). 22
Confidential and Proprietary.You can also read