US TARGET DATE FUNDS: EFFECTS ON RISK-TAKING AND STOCK MARKET DYNAMICS
←
→
Page content transcription
If your browser does not render page correctly, please read the page content below
US TARGET DATE FUNDS: EFFECTS ON RISK-
      TAKING AND STOCK MARKET DYNAMICS

                                 Jonathan A. Parker
                                   MIT and NBER
                            EFAMA Research Workshop
                                June 17, 2021
Talk based on:
Parker, J. A., A. Schoar, and Y. Sun, “Retail Financial Innovation and Stock Market Dynamics:
The Case of Target Date Funds,” MIT manuscript, June 2021
Cole, A., J. A. Parker, A. Schoar, and D Simester, “Household Portfolios and Retirement Saving
over the Life Cycle” MIT manuscript, June 2021
Duarte, V. , J. Fonseca, A. Goodman, and J. A. Parker, “Simple Allocation Rules and Optimal
PortfolioChoice Over the Lifecycle”
                                  Jonathan A. Parker
BACKGROUND
Over past 40 years in the US:
  defined contribution (DB) => defined contribution (DC)

“Typical” Americans – e.g. those w/out high net worth,
and previously reliant Share
                       on home        equity,
                             of retirement      Social Security, and
                                           wealth
DB in retirement – moved to choosing:
   – Levels of retirement saving
   – Financial portfolio allocations

This paper: document current portfolio allocations and
retirement saving over the working lives of typical
Americans

                                                                       2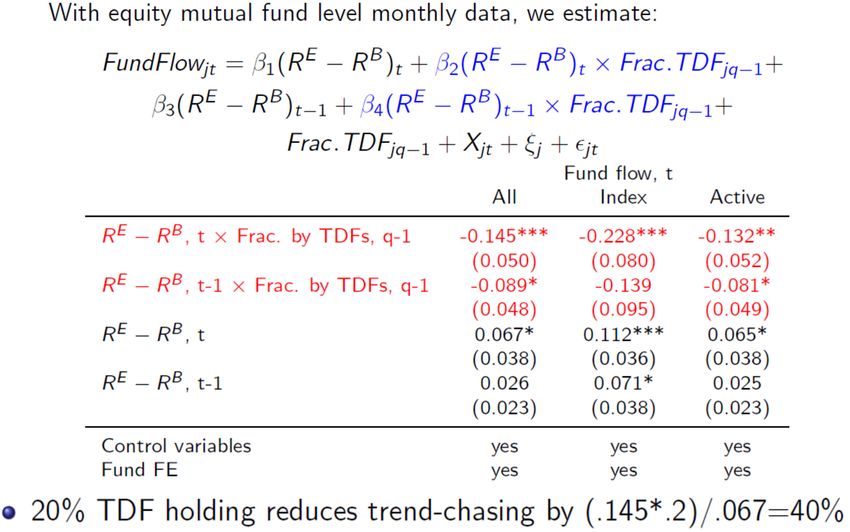
TARGET DATE FUNDS
THE RISE OF TDFS IN THE US

THE RISE OF TDFS IN THE US
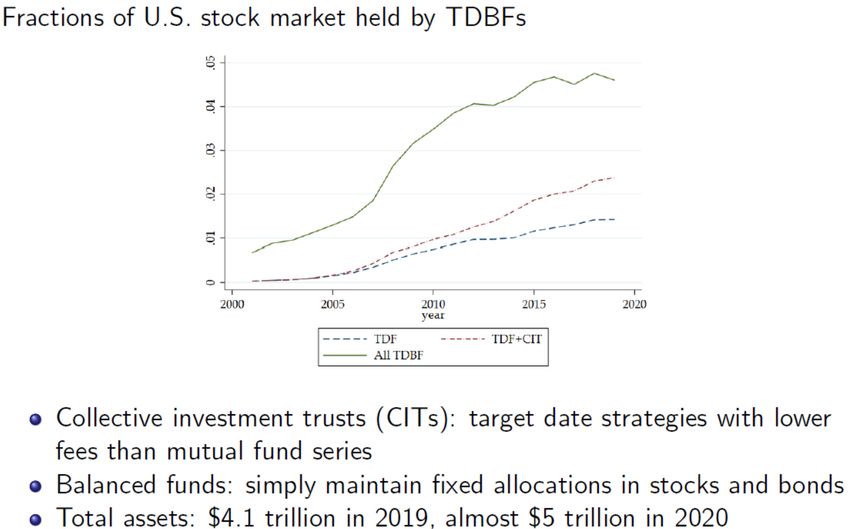
THE RISE OF TDFS IN THE US
OUTLINE OF TALK
 1. TDFs have contributed to households
    investing a greater share of their wealth in
    stocks, and changed the lifecycle pattern

 2. TDFs have changed stocks market
    dynamics

 3. Are TDFs optimal? How can they can
    and will become more customized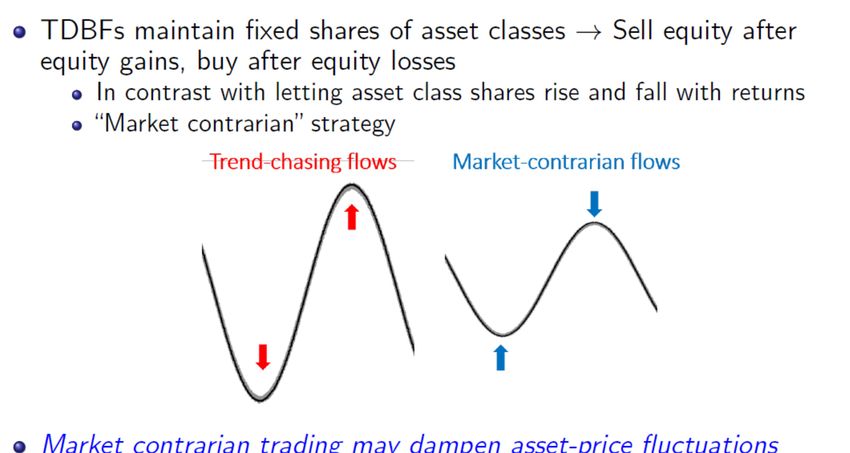
I. TDFS     AND HOUSEHOLD PORTFOLIOS

Analyze anonymized, account-level data on millions of
customers holding trillions in assets at one large US
financial services company
Cover the typical American household
    Not low income and not high wealth
    Overweight retirement as share of investable wealth
    Not randomly selected
    Missing assets at other institutions
    May be missing spouse
Sample: December 31, 2006 to December 31, 2019

                                                          8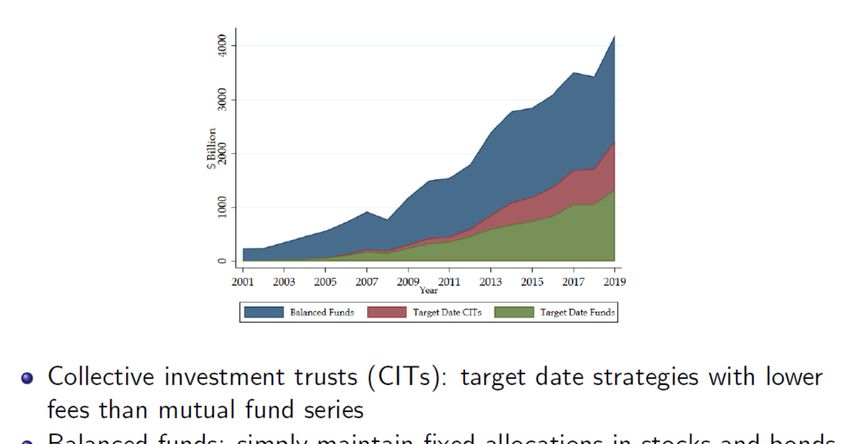
SUBSAMPLE
Define subsample of individuals so:
• Reflects an large/important set of US investors
• Can be constructed in our data and nationally representative
  to understand subsample relative to US population
   • E.g. What share of population? What share of wealth?

    Retirement Investors: Individuals age 25-
    65, with retirement wealth between 10th and
    90th age-specific percentiles (from 2016 SCF)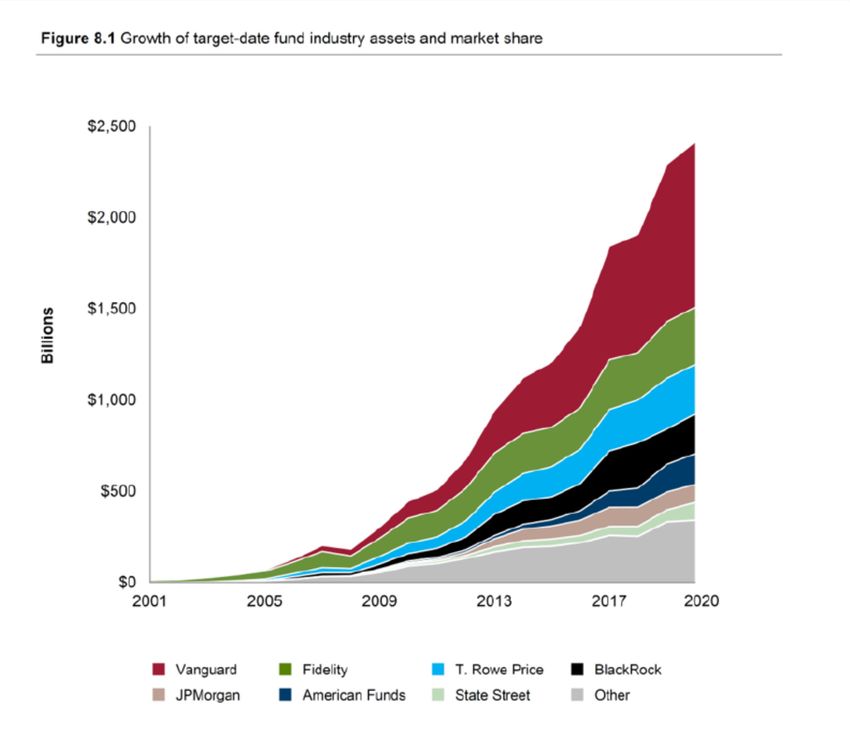
PORTFOLIO BEHAVIOR OVER TIME
         Average equity share

     Equity share > SCF due partly to TDFs
EQUITY SHARES DECREASING IN AGE
• Not driven by income: controlling for log income leads to more decline in
first half of working life (Table IV)
• Declining pattern holds within each third of (initial) income distribution
(Table IV)
• Similar with “price-constant” portfolios (Table A.8)
Jonathan A. ParkerNEW: NOW HIGH AND DECREASING
EQUITY SHARE ACROSS AGES
AMERIKS ZELDES (1990S) OUR SAMPLE (2006-18)
This declining pattern in the cross-section is a change from pre-2000
Note: Sample from AZ that most closely matches: equity owners
Jonathan A. ParkerCOHORT EQUITY SHARES BY AGE
• Consistent with the effect of TDFs:
• At younger ages: equity shares are increasing for each cohort and
are higher for younger cohorts
• At older working ages: decline with age following age 45PEOPLE DECREASE SHARE AS AGE
COHORT EQUITY SHARES BY AGE
AMERIKS ZELDES OUR SAMPLE
New: equity shares increasing for young cohorts, decreasing for older
cohorts vs. all cohorts were increasing equity shares pre-2000
Note: Sample from AZ that most closely matches: equity owners
Jonathan A. ParkerLIFECYCLE INVESTMENT PATTERNS
AMERIKS ZELDES OUR SAMPLE
Controlling for time effects or controlling for cohort effects, the new
hump-shaped pattern is a change from pre-2000 where flat or increasing
Note: Sample from AZ that most closely matches: equity owners
Jonathan A. ParkerWHY?
Target Date Fund Share by Cohort
16DID TDFS CAUSE CHANGES IN PORTFOLIOS?
Compare employees arriving at firm in 2 years pre-PPA 2006 and non-TDF default
investment to those arriving in 2 years after and having a TDF as QDIA fund
Age Enrolled. 25-34
17EQUITY SHARES OVER TIME: MIDDLE AGE
Age Enrolled 55-65
18SAVINGS RATES
1. Average retirement savings rates increase steadily as over
the working life, doubling from age 25 to 65
2. In contrast to portfolio behavior, saving behavior has been
stable over time, and w/in a few years no difference if hired
before or after PPA 2006 and adoption of TDF as default
3. Thus financial innovation and regulation have had modest
(or offsetting) effects on retirement saving behavior
19OUTLINE OF TALK
1. TDFs have contributed to households
investing a greater share of their wealth in
stocks, and changed the lifecycle pattern
2. TDFs have changed stocks market
dynamics
3. Are TDFs optimal? How can they can
and will become more customizedTHE RISE OF TDFS
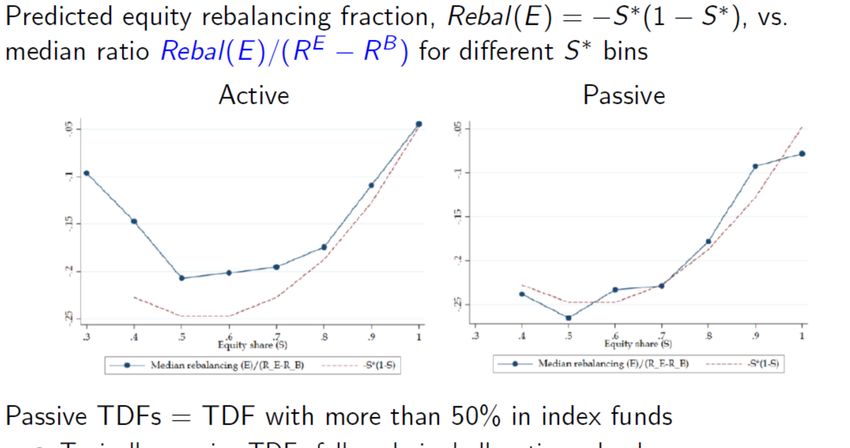
TD(B)FS ACTIVELY TRADE TD and Balanced Funds pursue contrarian trading strategies
KEY IMPLICATIONS
TDFS DO MAINTAIN EQUITY SHARE
FLOWS TO US EQUITY FUNDS Total US retail and intuitional share purchase/sale in dollars and stock market return less bond index return
FLOWS TO US EQUITY FUNDS TDF fund share purchase/sale in dollars and stock market return less bond index return
AT THE FUND LEVEL
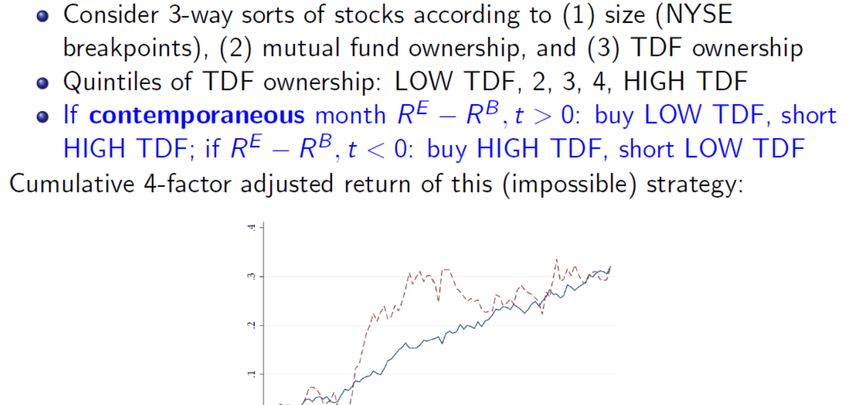
PRICE IMPACT?
PRICE IMPACT!
Regression analysis implies that
• For a stock with 1% TDF (indirect) ownership
• When the excess return on the stock market is
10% return
• The stock earns 0.1% lower return in that
month than one with no TDF ownership
– Even conditional on 4-factor model of stock
returns
This effect is large
Similar estimate using S&P index inclusionPRICE IMPACT! Why is this effect so large?
PRICE IMPACT! Why is this effect so large?
IMPLICATIONS
OUTLINE OF TALK
 1. TDFs have contributed to households
    investing a greater share of their wealth in
    stocks, and changed the lifecycle pattern

 2. TDFs have changed stocks market
    dynamics

 3. Are TDFs optimal? How can they can
and will become more customizedARE TDFS “OPTIMAL”?
• Optimal portfolio allocation can be constant over
the life cycle and independent of age and wealth
(Samuelson 1969, Merton 1969)
• Beyond these assumptions:
– With non-tradable (bond-like) labor income: equity
share declines as age
• Became the advice from economists and practitioners
– But many other factors, typically studied in isolation
• Current research: Solve for optimal saving
and portfolio behavior in a realistic(?)
environment
– How well do simple rules like embedded in
TDFs do at mimicking optimal behavior?
34REALISTIC ENVIRONMENT
Consider complex (realistic?) saving and portfolio problem
• Husband and wife
• Housing and non-housing consumption
• Gender-specific earnings profiles w/ stochastic, left-
skewed, shocks correlated over time
• Invest in stocks, bonds, ST accounts, with returns
correlated over time and with labor income
• Housing purchase vs. rent, and mortgages
• Realistic retirement accounts
• Simple tax and benefit system
• Bequest utility
• During retirement:
– pension that is a function of lifetime labor income
– mortality risk
– stochastic medical expenses.
35DEEP REINFORCEMENT LEARNING
Overview:
1. Decision rule parameterized as fully connected feedforward
neural networks as cells for multiple recurrent neural
networks
2. Stochastic gradient descent to maximize expected lifetime
utility over a large number of simulated lives
Benefits:
1. Faster
• Avoids numerical integration, handles discrete and continuous choices
2. Easier to use/program than dynamic programming methods
3. Mimics how investors, practitioners, or data scientists
actually determine optimal behavior: learning from how well
different choices work out
36LESSONS SO FAR
1. Higher average equity shares are optimal relative to those
embodied in current investment advice and in current TDFs.
2. Substantial variation.
• The 90th percentile of optimal equity share is ≈100“% after age 45
• The 10th percentile: roughly 20% for age 50 and older
37LESSONS SO FAR Distribution of the optimal share of assets invested in stocks in retirement accounts, by age (low risk aversion case)
LESSONS SO FAR
1. Higher average equity shares are optimal relative to those
   embodied in current investment advice and in current TDFs.
2. Substantial variation.
   •   The 90th percentile of optimal equity share is ≈100“% after age 45
   •   The 10th percentile: roughly 20% for age 50 and older
3. Following the portfolio of the typical (index, low-fee) TDF
   rather than optimal costs the equivalent of roughly 5% of
   consumption per year
4. But this is a significant improvement over holding a constant
   equity share such as 2/3 or, closer to the average optimum in
   our model across ages, 85%
My prediction: customization is coming, not just on financial
adviser desktop, or robo-adviser, but in fund form

                                                                            39
CONCLUSION
• TDFs have changed the lifecycle portfolio allocations of
typical American investors
– Higher share of financial wealth in equity: nearly 70% over the life cycle,
compared to 58% prior to 2000
– Average portfolio share of equity is hump shaped in age, peaking around age
50 and then decreasing as retirement approaches
– Due to general adoption, not just an enrollment and default effect of TDFs
– Little change in retirement saving rates
• TDFs have dampened the tendency for retail investor money
to flow into stock funds when the stock market is performing
well
– And is changing the return dynamics across stocks
– And may dampen aggregate market volatility as they grow
• There is a large scope for improving how well TDFs serve
investors by customizing them
40You can also read