COLUMBUS FREIGHT CHECK - Trends, Challenges and Opportunities OCTOBER 2, 2019 OCEAN MARKET PANEL DISCUSSION
←
→
Page content transcription
If your browser does not render page correctly, please read the page content below
COLUMBUS FREIGHT CHECK
OCTOBER 2, 2019
OCEAN MARKET PANEL DISCUSSION
Trends, Challenges and Opportunities
Bob Fredman, Big Lots (Moderator)
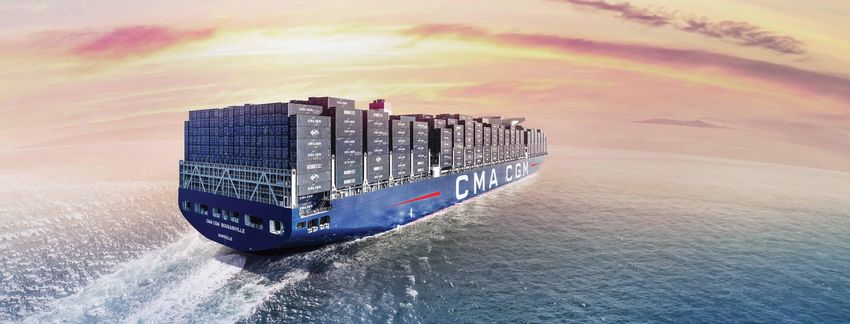
Joseph Voakes, CMA
James Setzke, Hapag Lloyd
Dan Sutton, Zim Linesle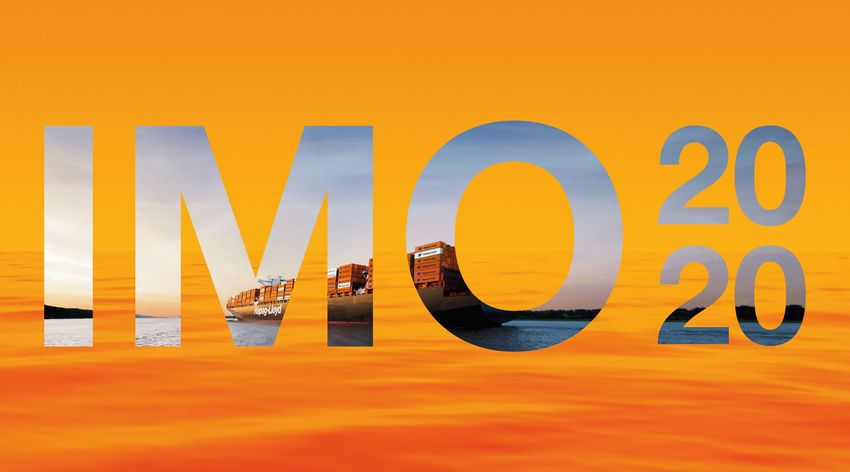
Panel Discussion Topics IMO2020 LOW SULPHUR FUEL WINTER BLANK SAILING PROGRAM CARRIER STRATEGIES FOR SOURCING SHIFTS
New Sulphur Cap – The IMO 2020 Regulations Update

  September 2019
What are the IMO 2020 Fuel Regulations?
The new fuel regulations, known as “the
Sulphur Cap”, require all marine carriers
to use low sulfur fuel (up to 0.5% sulfur
content) by January 1st, 2020*
The new regulations, introduced by the
International Maritime Organization (IMO) are
aimed to reduce marine pollution and
emissions
All shipping companies will be obliged to
comply and to significantly reduce emissions
on the high seas and in coastal areas
* There are indications that a grace period for the implementation of the IMO 2020
regulations will be given till end of Q1/20
2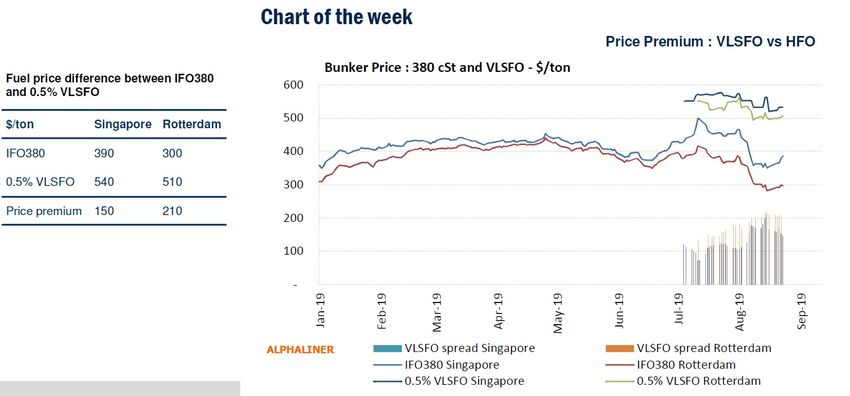
How will the Regulations Impact the Shipping Industry?
The new regulations will impact all the stakeholders in the industry. Compliance with
the new regulations is expected to create a significant cost impact
There are three ways for carriers to comply:
1. Buying compliant fuel at higher prices
2. Investing in and Installing new cleaning systems on board vessels (Scrubbers)
3. Deploying new type of vessels using Liquid Natural Gas (LNG)
All alternatives are expected to carry significant costs for the carriers
External sources estimate additional cost to the container shipping industry,
which can reach to a level of 20-30 Billion USD
3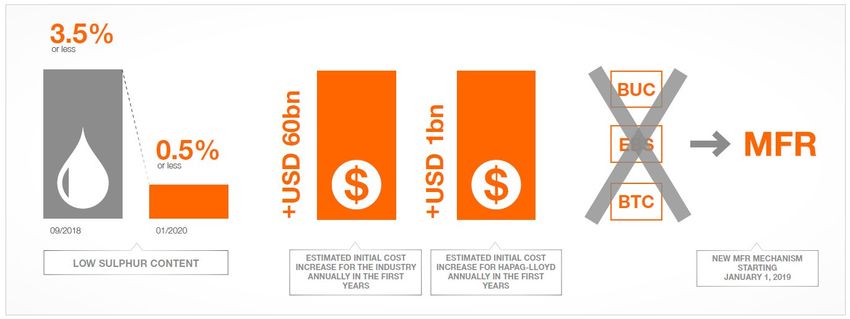
Using compliant fuels will be the dominant initial approach
 to IMO2020

                                                  16% of vessels
                                                  36% of capacity

                                                  0.7% of vessels
                                                  1.9% of capacity

Source: Alphaliner Weekly Newsletter 28.05.2019
                                                                     6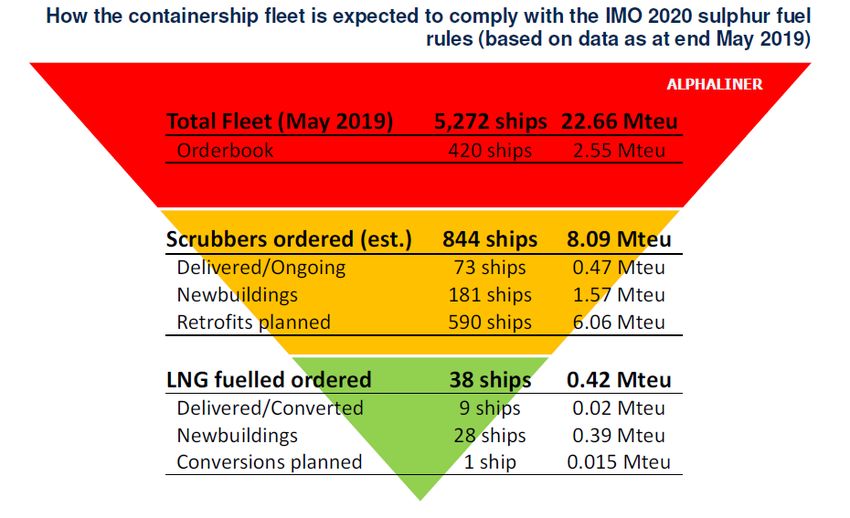
ZIM is well prepared for the
  IMO 2020 Regulations

                               7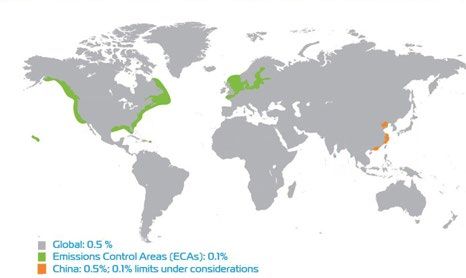
Low Sulphur IMO 2020 Regulation
Caring for the future today
August 2019
Low Sulphur IMO 2020 Regulation
                  For the benefit of:

                                                                      MARPOL ANNEX VI sets limits on SOx and NOx
                  Public Health:            Environment:                    emissions from ship exhaust
                  improved air quality,     reduction of acid rain,
                  reduction of              soil erosion,               Objective on January 1st, 2020
                  respiratory diseases      acidification of oceans
                                                                               Reducing average
                  APPLIES TO ALL SEA-GOING VESSELS WORLDWIDE:
                                                                               sulphur emissions
                                                                                  worldwide by
                            ~100,000                                                 85%
                                                                                                                   2

Low Sulphur IMO 2020 Regulation
What does this mean for our customers?
VLSFO will constitute approximately 90% of our fuel supply in 2020.
The cost of VLSFO 0.5O % is expected to be significantly higher than the present HSFO 3.50 %.
?
VLSFO 0.50% 90%
HSFO 3.50%
Low Sulphur fuels
6
Low Sulphur IMO 2020 RegulationLong-term contracts (more than 3 months validity)
For long-term contracts, BAF will be updated as of January 1st, 2020.
Fuel reference HSFO 3.50% will be replaced by VLSFO 0.50%
BAF Q1 2020 will be based on average price of VLSFO 0.50% of September/October/November 2019:
Dec 1st, Jan 1st,
Sept 19 Oct 19 Nov 19 2019 2020
Feb 20 Mar 20
Publication Application
BAF = $$ BAF = $$
average VLSFO price
BAF amounts per trade will be then updated on a quarterly basis as follows :
BAF = VLSFO 0.50% PRICE PER TON x TRADE COEFFICIENT
Tiers of USD 25 have been set-up in order to avoid revision of BAF in case of minor variation of VLSFO 0.50% price.
10
Low Sulphur IMO 2020 RegulationLong-term contracts (more than 3 months validity)
BAF simulation (for a selection of trades)*
HSFO or VLSFO price (usd/ton) 375,01 400,01 425,01 450,01 475,01 500,01 525,01 550,01 575,01 600,01 625,01 …, for each
400,00 425,00 450,00 475,00 500,00 525,00 550,00 575,00 600,00 625,00 650,00 25 usd
Far East to North Europe usd per teu 240 255 270 285 300 315 330 345 360 375 390 15,00
Far East to West Med usd per teu 240 255 270 285 300 315 330 345 360 375 390 15,00
Far East to WCNA usd per feu 405 432 459 486 513 540 567 594 621 648 675 27,00
Far East to ECNA usd per feu 660 704 748 792 836 880 924 968 1012 1056 1100 44,00
Far East to WCSA usd per teu 260 276 292 308 325 341 357 373 390 406 422 16,25
Far East to ECSA usd per teu 260 276 292 308 325 341 357 373 390 406 422 16,25
Far East to West Africa usd per teu 285 307 330 352 375 397 420 442 465 487 510 22,50
Far East to East Africa usd per teu 205 222 240 257 275 292 310 327 345 362 380 17,50
North Europe to Far East usd per teu 20 27 35 42 50 57 65 72 80 87 95 7,50
West Med to Far East usd per teu 20 27 35 42 50 57 65 72 80 87 95 7,50
WCNA to Far East usd per teu not applicable 2 5 7 10 12 15 17 2,50
ECNA to Far East usd per teu not applicable 5 10 15 20 25 30 35 5,00
WCSA to Far East usd per teu 80 85 90 95 100 105 110 115 120 125 130 5,00
ECSA to Far East usd per teu 80 85 90 95 100 105 110 115 120 125 130 5,00
West Africa to Far East usd per teu 165 177 190 202 215 227 240 252 265 277 290 12,50
East Africa to Far East usd per teu 10 18 27 36 45 53 62 71 80 88 97 8,75
*Above amounts are only given as an example of BAF quantum. Actual BAF tariffs will be communicated later on as per relevant regulations.
HSFO 2019 prices range. 11
Assumed VLSFO 2020 prices range - based on the factors available at the date of the publication of this document.
Low Sulphur IMO 2020 RegulationCMA CGM: fully compliant as of January 1st, 2020
Use Low Sulphur Fuel Oil
with 0.50% Sulphur
Install Advanced Air Quality Systems*
onboard our vessels will be
compliant
January 1st, 2020
Use LNG-powered vessels
* Exhaust Gas Cleaning Systems
5
Low Sulphur IMO 2020 RegulationAlphaliner Price Spreads between IFO380 and 0.5% VLSFO
For greener shipping
Financial Impact of IMO2020 for the Shipping Industry
Complying with the new low sulphur regulation will make the industry significantly greener, but
compliance will have a significant cost impact on the industry
To comply with the regulation, the industry will have to either start using low sulphur fuels or invest in new technologies that have yet to be thoroughly tested in
practice
In either case the costs will go up, because compliant fuels as well as investments to new technologies will be expensive
Experts are estimating an additional initial fuel cost of USD 60bn for the entire industry annually in the first years
Hapag-Lloyd is estimating its additional initial costs to amount up to USD 1bn for the company annually in the first years, based on the assumption that the spread
between HSFO and LSFO 0.5% will be USD 250
To recover fuel related costs caused by the IMO2020, Hapag-Lloyd is introducing a transparent and fair Marine Fuel Recovery (MFR) mechanism
2Hapag-Lloyd Marine Fuel Recovery
Simplify rate structure and will replace all existing
fuel charges with a new Marine Fuel Recovery (MFR)
mechanism
Marine Fuel Recovery Mechanism will be gradually implemented
from 1 January 2019
Transparent and easy-to-understand
It helps our customers predict and plan the price increases for
their trade routes
The MFR aiming at recovering costs arising from stricter
regulation
The calculation is based on average market data
3Transparent and easy-to-understand: The MFR mechanism is
based on a set of variables and average market data
The MFR is based on market data and derived out of averages for Market Class Vessels
Fuel consumption (per ton) Carried TEU
Based on Market Class Vessels, representing a typical service in the market on a Estimation of the carried TEUs per round voyage consists of
specific trade the nominal size of a market class vessel (eeSea) and
utilization based on Clean Cargo Working Group data
Considered per round voyage at average speed (CCWG)
Differentiation between days spent at sea and at port (eeSea data)
Example: East Asia – North Europe trade
19 different services per week considered
For each service its average vessel is determined
and considered in the calculation
A market class vessel for this trade is ~14,300 TEU
based on vessel size data from eeSea
14,000 – 22,000 TEU: 10 services
10,000 – 14,000 TEU: 5 services
8,000 – 10,000 TEU: 2 services
4,000 – 6,000 TEU: 2 services
Fuel price (per ton)
70% utilization based on the global average utilization
Based on market prices for different fuel types (source: Platts) outlined by CCWG
Fuel types included: HSFO or LSFO 0.5% and LSFO 0.1% 14,300 x 0.7 = 10, 010 TEU
4B l ank S ai l i ng s – F rom We e k 4 0 to 4 4
Sum of Vessel Capacity in TEU's Week
Alliance Service Vessel Name 40 41 42 44
OCEAN AASP/Soth China 2 COSCO VENICE 4,365
East Coast Express (ECX1)/China AW Loop2 (AW2) OOCL Chongqing 13,200
East Coast Express (ECX2)/China AW Loop1 (AW1) CMA CGM Adams 14,414
Gulf Coast China 1(GCC1)/ Pacific Gulf 6(PG6) APL California 6,350
Gulf Coast China 2(GCC2) COSCO Auckland 4,249
Pacific China Central 2(PCC2) /HRX/Yangste KOTA PURI 11,923
Pacific China Central1 (PCC1)/Hibiscus Express OOCL LUXEMBURG 8,063
Pacific China North1(PCN1)/bohai COSCO Italy 13,386
Pacific China South 2(PCS2) EVER Ursula 5,652
Pacific North West 1(PNW1)/Dhalia/ Pacific Northwest Loop
4(NP4) OOCL Vancouver 5,888
Pacific Northwest Pendulum (PNW2) APL Southampton 10,800
CMA CGM Aquila 11,356
Pacific Northwest Pendulum (PNW4) CSCL Bohai Sea 10,036
CMA CGM
PRX/AAS2/Pacific China South 1(PCS1)/South China Loop1(SC1) Bougainville 18,000
THE East Coast Loop2(EC2) Seaspand Hudson 10,000
East Coast Loop3(EC3) Houston Bridge 9,600
YM Uniform 8,626
Pacific North Loop1(PN1) MOL Creation 8,110
ONE Contribution 8,560
Pacific North Loop3(PN3) YM Ultimate 8,204
Pacific South Loop4(PS4) YM Milestone 6,589
Pacific South Loop5(PS5) ONE Commitment 8,560
YM Utmost 8,200
Pacific South Loop6(PS6) NYK Adonis 9,592
Pacific South Loop7(PS7) Aristomenis 9,954
2M PEARL TBA 0
Yulan/TP3 TBA 0
2M + Zim AMBERJACK/ZCP/TP10 TBA 0
ORIENT/ZP8/TP8 GUNVOUR Maersk 6,600
PELICAN/ZGX/TP88 TBA 0
Others PN2 TBA 0
PNS AS MORGANA 4,255
SCHUBERT 4,255
27 September Grand Total Copyright © 2017 Yusen Logistics. All rights reserved 81,129 99,363 54,443 13,852 1
2019You can also read