Bank of America Merrill Lynch U.S. Basic Industrials Conference - December 11, 2014
←
→
Page content transcription
If your browser does not render page correctly, please read the page content below
Bank of America Merrill Lynch
                    U.S. Basic Industrials Conference

December 11, 2014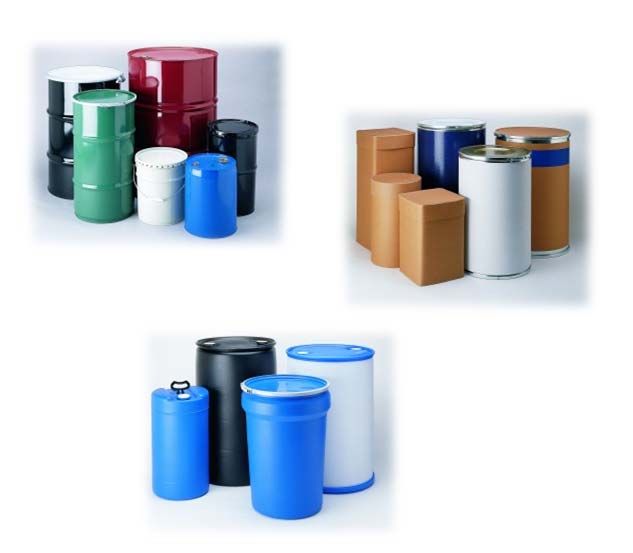
Safe Harbor

 Forward-Looking Statements
 This presentation contains certain forward-looking information within the meaning of the Private
 Securities Litigation Reform Act of 1995. The words “may,” “will,” “expect,” “intend,” “estimate,”
 “anticipate,” “aspiration,” “objective,” “project,” “believe,” “continue,” “on track” or “target” or the negative
 thereof and similar expressions, among others, identify forward-looking statements. All forward-looking
 statements are based on information currently available to management. Such forward-looking
 statements are subject to certain risks and uncertainties that could cause events and the Company’s
 actual results to differ materially from those expressed or implied. Please see the disclosure regarding
 forward-looking statements immediately preceding Part I of the Company’s Annual Report on Form 10-K
 for the fiscal year ended October 31, 2013. The company assumes no obligation to update any forward-
 looking statements.

 Regulation G
 This presentation includes certain non-GAAP financial measures like operating profit that excludes
 special items such as restructuring charges, acquisition-related costs, timberland gains and non-cash
 asset impairment charges that are volatile from period to period. Management of the company uses the
 non-GAAP measure to evaluate ongoing operations and believes that this non-GAAP measure is useful
 to enable investors to perform meaningful comparisons of current and historical performance of the
 company. All non-GAAP data in the presentation are indicated by footnotes. A table showing the
 reconciliation between GAAP and non-GAAP operating profit is presented on slide eleven of this
 presentation and on the Greif website at www.greif.com.

                                                                                                                     2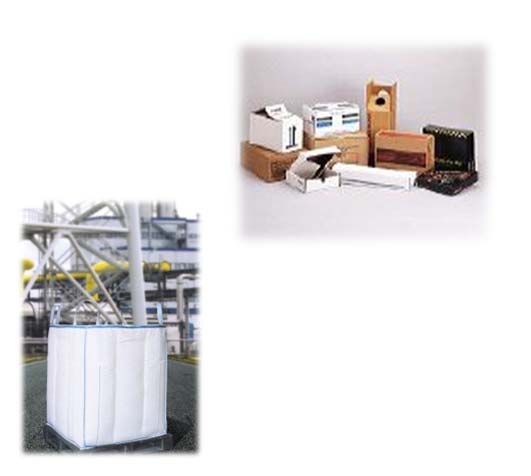
Our success is built on our strong heritage and foundation

                             •   Founded in 1877 as a packaging company
                             •   Initial public offering in 1926
                             •   Greif has endured and succeeded through 19
                                 recessions and 3 depressions
                             •   Our success is built on our strong heritage and
                                 foundation.
                             •   Continue to live The GREIF Way.

                                                                                   3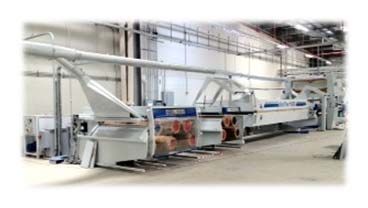
World’s Leading Industrial Packaging Company
Diversified Business Platform and Global Footprint
$4.4 Billion
Net sales for 12 months ended
July 31, 2014 13,500
Approximate number of
$4,422 1
employees worldwide
Rigid
Industrial Flexible Paper Land
Packaging Products Packaging Management
& Services & Services
$3,1061 $4401 $8481 $281
300
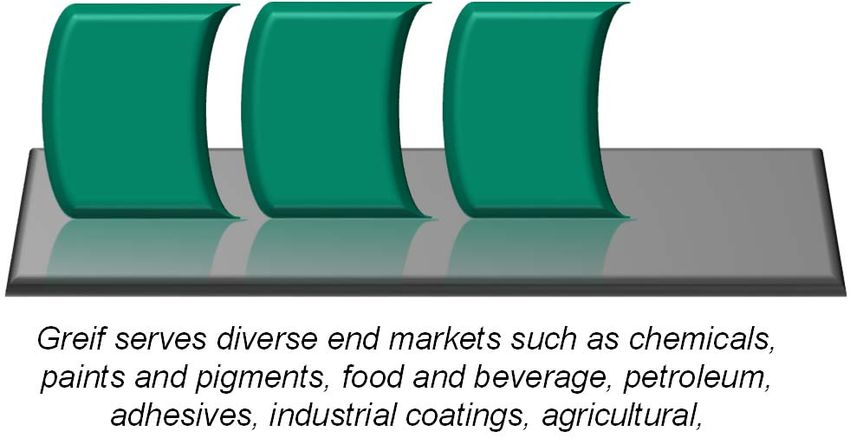
Greif serves diverse end markets such as chemicals, >50 Nearly 300 operations
paints and pigments, food and beverage, petroleum,
Operations in more than
adhesives, industrial coatings, agricultural,
50 countries
pharmaceutical, minerals and building products
1
Twelve months ended July 31, 2014, in millions of dollars (unaudited)
4
Safety is Priority #1
Greif Medical Case Rate
# of injuries per 100 employees

       4.2
                       3.8
                                  3.5
                                        3.2    67% decline
                                               2.7     2.6

                                                             1.9
                                                                    1.6    1.5    1.4

      FY05           FY06     FY07      FY08   FY09   FY10   FY11   FY12   FY13   FY14
    Source: Company Data

                                                                                         5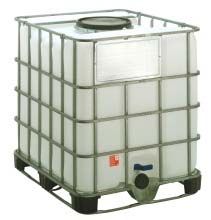
Maximizing Long-Term Shareholder Value
Greif Historic Stock Returns1
Cumulative percent change – November 2002 - October 2014

                                                                                       Growth Through
                             GBS                                                                                          Business
                                                          Earn & Grow                   Adjacencies &                                              Our Future
                        Transformation                                                                                   Integration
                                                                                         Extensions
                     • 2003-2005                      • 2006-2008                     • 2009-2011                 • 2012-2014                •   Earn right to grow
                     • GBS Transformation             • Leveraged GBS for cost        • Launched 3 growth         • Increased focus on cash •    Accelerating value
                       launched in 2003                 savings & capacity              platforms:                  and business integration     creation
                     • Obtained remaining               increases                       1. Flexibles              • Pursued additional
                       CorrChoice interest            • Strong go to market             2. LifeCycle Services       synergies across
                     • Average annual stock             strategy                           (rigid drum              businesses &
                       return = 33%                   • Executed M&A activities            reconditioning)          geographic regions
                                                        –IPS rollup                     3. IBC                    • Average annual stock
                                                        –Delta Petroleum              • Recession in Western        return = 2%
                                                        –Blagden Packaging              Europe
                                                      • Start of the Great            • Average annual stock
                                                        Recession                       return = 8%
                                                      • Average annual stock
                                                        return = 13%

              Nov-02 Jan-04                      Jan-06                Jan-08              Jan-10               Jan-12          Jan-14             Jan-16             Oct-17

         1
             Based on adjusted close price incorporating dividends and stock splits

                                                                                                                                                                               6
Transformation – Accelerating Value Creation

                                           Vision & aspiration

                                            “The Greif Way”

                                                 Strategy

       Deliver profitable                Optimize the portfolio                 Increase cash
       customer growth                       for the future                       efficiency
•   Best in class GBS               •   Portfolio optimization        •   SG&A efficiency
    processes linked as one             – Transform / fix                 – Businesses
    team focused on creating            – Protect the core                – Shared services / facilities
    customer value
                                        – Invest to grow                  – Corporate
                                        – Potential Divest
ComEx        OpEx      S&SC                                           •   Working capital reduction
                                    •   Resource allocation process

                                    Talent & organizational health

                                        Performance management

                            Collaboration & engagement across businesses

                                                                                                           7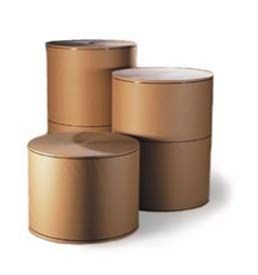
The Safe Choice – Best At Protecting Customers’ Products

Greif Aspiration
 Deliver value that meets                                                   The global leader in
 and exceeds our                                                            industrial packaging
 customers’ needs
                                                                            • Continually strive to
                                                  One                           increase shareholder
 • Our focus is always on the                                                   value
     customer                                   Promise
                                                                            •   Maintain high ethical
 •   Earn the right to be the                                                   standards in everything
     Safe Choice                                                                we do
 •   Our customer relationships                Long-term                    •   Relentless pursuit of
     are built on trust                        profitable                       excellence and
 •   Constant innovation to                     growth                          continuous cost
     differentiate                      One                  One                improvement
 •   Strive to deliver products        Team                 Purpose         •   Industry leader in
     with zero defects, on time                                                 sustainability

                     Work as one team across all geographies and businesses
                         • A safe work environment - zero accidents
                         • Committed to developing people and maintaining
                             an engaged team
                         •   Diversity working through The Greif Way
                         •   Performance management with clear accountability
                                                                                                          8
Diversified Business Platform
Twelve months ended July 31, 2014
(Dollars in millions)
Unaudited

                                                        Sales                      $   4,422
                                                        Operating Profit           $     302

 Rigid                               Paper                                 Flexible                         Land
 Industrial                          Packaging                             Products &                       Management
 Packaging                                                                 Services
 & Services

Sales                    $   3,106   Sales                     $    848    Sales                $    440    Sales              $    28
Operating Profit         $     169   Operating Profit          $    124    Operating Profit     $    (37)   Operating Profit   $    46

        •   Chemicals                  •   Corrugator Converters               •   Food                       • 251,350 acres in U. S.
        •   Paints                     •   Paper Converters                    •   Chemicals                        • Alabama
        •   Pigments                   •   Agricultural                        •   Mining and Minerals              • Louisiana
        •   Petroleum                  •   Advertising/Retail                  •   Fertilizer                       • Mississippi
        •   Agricultural                                                       •   Pharmaceutical             • 10,345 acres in Canada
        •   Pharmaceutical

                                                                                                                                         9
Strategy to Optimize Business Portfolio
Transform or Fix Invest To Grow
Unsatisfactory performance, but remain very strategic Businesses that have the potential for significant
to Greif’s portfolio & have upside potential to become profitable growth and are seen as key to building
financially attractive Greif’s next chapter.
Potentially Divest Protect the Core
Businesses that are (1) non-core (2) in unattractive Strategic businesses; Greif is the natural owner; future
markets (3) high risk or (4) perpetual underperformers growth expectations are low but attractive returns are
expected to continue.
10Select Fourth Quarter and Fiscal 2014 Financial Information
Greif, Inc. and Subsidiary Companies
Unaudited
$ millions
Three months ended Twelve months ended
October 31, 2014 October 31, 2014
Net sales $1,082 $4,378
GAAP to Non-GAAP Reconciliation
Operating profit $ 92.9 $ 297.9
Restructuring charges 5.6 16.1
Acquisition-related costs 0.4 1.6
Timberland gains - (17.1)
Non-cash asset impairment charges 19.5 42.0
1
Operating profit before special items $ 118.4 $ 340.5
2
Long-term debt $1,088
1
Preliminary amount above does not include any estimate for possible non-cash impairment of goodwill and intangible assets associated with Flexible Products & Services segment
as management is still completing its analysis. Total goodwill and intangible assets for this segment are $49.7 million and $13.2 million, respectively.
2
At October 31, 2014 and long-term debt was $1,207 at October 31, 2013.
11Performance Metrics
One Team
• Medical Case Rate
• Organizational Health Index
One Promise
• Customer Satisfaction Score
One Purpose
Value (%)
• Return On Net Assets
• Operating Working Capital
• Operating Profit
Gross Profit
SG&A
Drivers of Value
• Targeted growth by Business
• Innovation revenue mix 10%
12You can also read