INVESTOR PRESENTATION - H1 FY18 By Rod Bishop, Managing Director - Jayride.com
←
→
Page content transcription
If your browser does not render page correctly, please read the page content below

H1 FY18
INVESTOR PRESENTATION
By Rod Bishop, Managing Director
February 2018

WHO IS
    JAYRIDE?
        Travel E-commerce
        Marketplace for Ground
        Transport.

    B2C Travel
    Travellers use Jayride websites to
    compare and book ground transport
    including shared airport shuttles and
    private transfers.

    B2B Travel
    Travel brands use Jayride APIs to add
    new ancillary revenues by selling airport   Simple and powerful transport    World’s only geospatial extranet for passenger transport companies.
                                                  marketplace for travellers.
    transfers to their travellers.

    ijij AU head-office
    ijij International destinations
    ijij US largest market                              Technology                Global Preferred                International                  International
                                                        Partner                     Supplier                      Supplier                       Supplier
    ijij 2,000+ transport companies
    ijij 500+ airports
2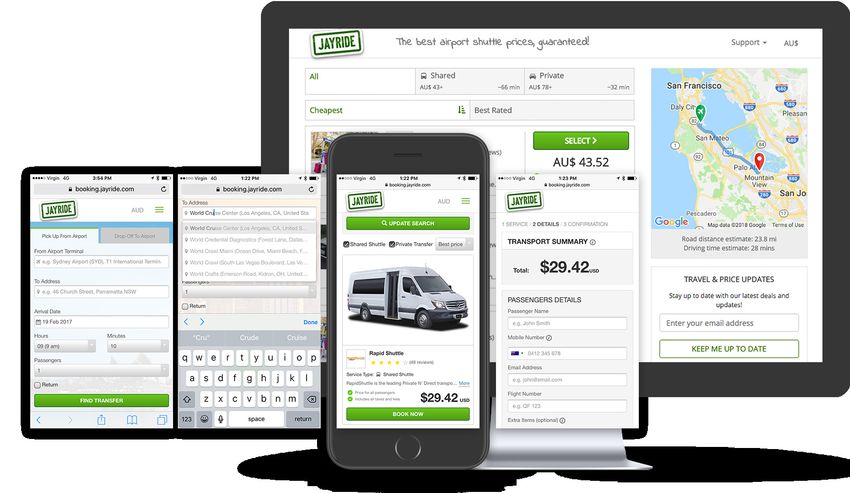
TABLE
    OF CONTENTS

     Growth Summary                    4

     Jayride’s Vision and Execution    7

     Latest Financial Summary         18

     Appendix                         20

3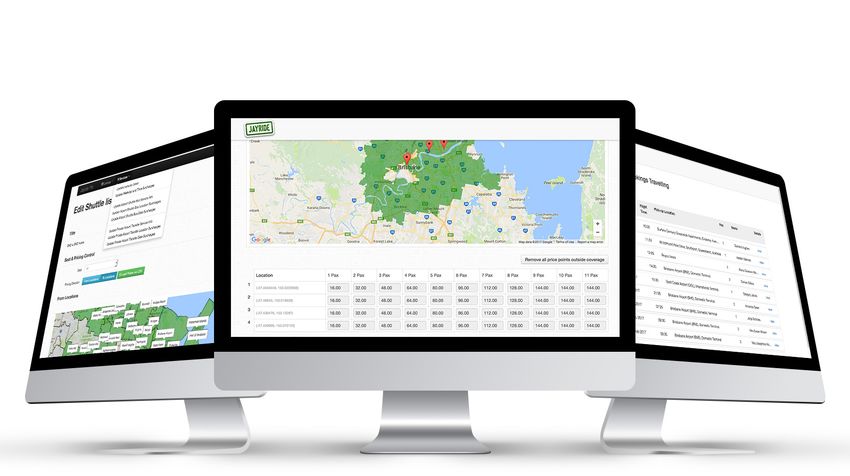
GROWTH                                                                                                                        Growth of revenue from commissions and

    IN REVENUE
                                                                                                                                  fees booked +10%-50% Quarter-over-Quarter
                                                                                                                                  for 18 straight quarters.

    Revenue from Commissions and Fees Booked

                                                            FY 2013         FY 2014              FY 2015               FY 2016               FY 2017         FY 2018    Consistent
                                                     500K                                                                                                                 revenue
                                                                                                                                                                           growth

                                                     400K
    Revenue from Commissions and Fees Booked (AUD)

                                                     300K

                                                     200K

                                                     100K

                                                      0K
                                                              Q4      Q1   Q2    Q3   Q4   Q1   Q2     Q3   Q4   Q1   Q2     Q3   Q4   Q1   Q2    Q3   Q4   Q1     Q2
4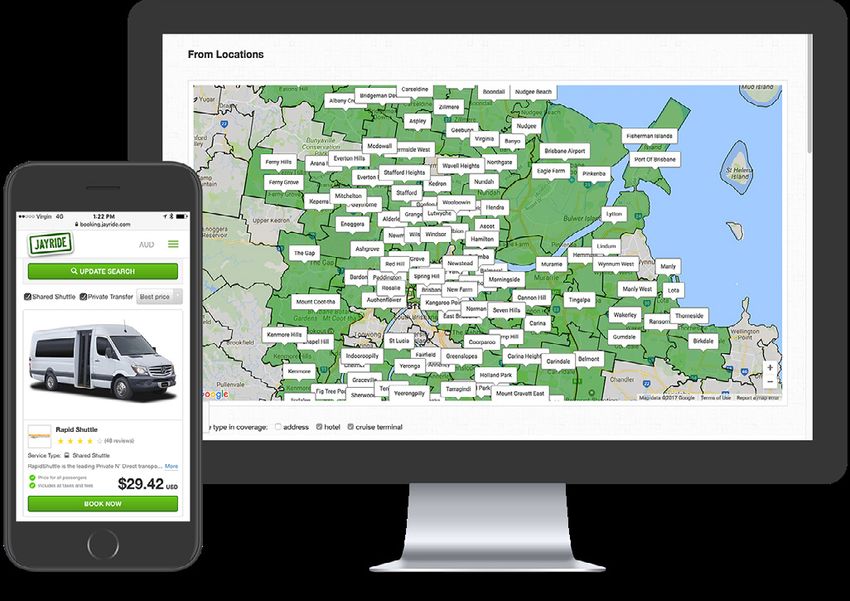
GROWTH                                                                                         Jayride outperforms the market in

 IN MARKET SHARE
                                                                                                each destination as Jayride captures
                                                                                                new market share.

                                                                 Growth in passengers travelled

                                                        Jayride                                       All Airports *

                                               +116%                              VS                 +4.9%
                                                                    Growth in passengers travelled
                                                     Regions            Airport            Jayride                Airport *
                                                                          LAX             +185%                   +4.5%
                                                                          SFO             +119%                   +5.1%
                                                   United States          LAS             +182%                   +2.2%
                                                                           JFK            +254%                   +0.7%             Capturing
                                                                         MCO              +213%                   +6.4%               share in
                                                                          SYD               +89%                  +3.6%
                                                                                                                                 every market
                                                     Australia            MEL             +143%                   +3.6%
                                                                          OOL               +96%                  +2.1%
                                              United Kingdom              LHR             +170%                   +3.0%
                                                   New Zealand            AKL               +70%                  +7.3%

5 * Source: Airports Council International (ACI)            CY 2017 vs CY 2016 for top airports in each region.
GROWTH IN                                                                           Jayride market access today is 27% of global

          NEW DESTINATIONS
                                                                                              airport passengers. Jayride will launch new
                                                                                              destinations to scale access towards 100%.

              Jayride Global Market Access to Airport Passengers
                                                                                                                 100%
                                                     100%
                                                                                                                          All Airports
 Market Access (Share of 7.7bn Airport Passengers)

                                                                                                                          eg. CDG, AMS, FRA,
                                                                                                                          PEK, DXB, HND etc.

                                                                    +266%
                                                     80%

                                                                                                                                    Capturing
                                                                                                                                         new
                                                     60%                                                                             markets

                                                     40%

                                                            27% *
                                                                    500+ Airports;
                                                     20%            eg. LAX, SFO, LAS, JFK,
                                                                    MCO, SYD, MEL etc.

                                                      0%
                                                            Today                                                Future

6 * Source: ACI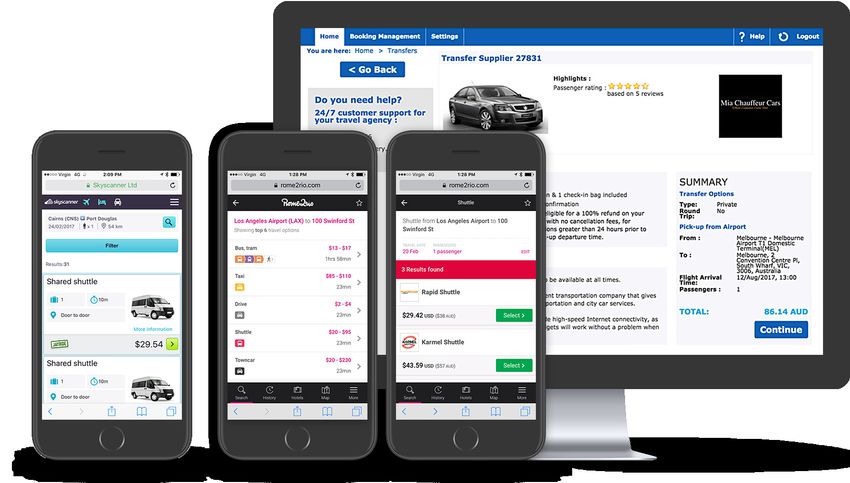
GROWTH IN                                                                                Growth in market opportunity as more

    MARKET OPPORTUNITY
                                                                                             travellers fly, and more transport is booked
                                                                                             online in the online travel industry.

           Market Growth Forecast for Online Booking of Airport Passenger Transport
                          400%
                                                                   *
                                               Airport passenger                                                                    Growth
                                                  trips in 2017                                                                   in market
                          350%
                                                                                                                                       size
                                                 7.7bn
                          300%
                                                                   *
 Forecasted Market Size

                          250%
                                               $100bn
                                                Spent in airport
                                               transport in 2017

                          200%
                                                                                               Forecast CAGR

                          150%
                                                                                              +13.5%

                          100%
                                 2017   2018      2019    2020         2021    2022   2023   2024   2025    2026   2027

7 * Sources: Frost and Sullivan, ACI and European Tourism Association (ETOA)
Every traveller will demand a
OUR      door-to-door experience, and every
VISION   travel brand will want to offer one.

OUR       Give travellers access to seamless
MISSION   transport to every destination.

WEBSITES FOR
     TRAVELLERS
      Mobile-first
      responsive web app.

                                              Travellers
                                               compare
                                              and book

                            www.jayride.com
10
MAKING TRANSPORT Ground transport is a natural ancillary
ACCESSIBLE AND ONLINE
to travel. Jayride brings ground transport
and online travel together.
Online Travel Ground Transport
Booking for Air Travellers
US$650bn US$100bn
* *
ijij Margin compression ijij New entrants, new modes
ijij Drive for ancillaries ijij Natural ancillary to travel
11 * Sources: Frost and Sullivan, ETOAHOW Jayride is a two-sided marketplace
JAYRIDE WORKS
with a world-leading database of
transport information.
Transport Travellers
Transport Travellers
Provides Receive
ijij Prices Thousands
ijij Coverage of transport
companies
ijij Availability available
through a single
source.
ijij Defensibility grows
with every new
Transport transport company. Travellers
Receives ijij Revenue grows by Provide
More revenue, leveraging supply ijij Booking
opportunities against demand. ijij Travel
to service new
regions and new ijij Feedback
partners.
12TECHNOLOGY World’s only geospatial extranet for transport
FOR TRANSPORT
companies enables the fastest, cheapest, and widest
aggregation of airport transport information.
Free
tools for
transport
13API FOR
PARTNERS
Add airport transfers for
new ancillary revenues.
Examples
of Jayride
API in use
14ENABLING Travel partners can now book with
TRAVEL BRANDS
thousands of transport companies
through a single integration.
Technology platforms
Online Travel Agencies &
Travel Search Engines
Wholesalers & Brands
Travel Management
Companies
15FY17 Growth by launching new regions and
GROWTH
by capturing additional market share
within existing regions.
GMV Booked by Region (AUD $M)
$5M
AU NZ UK & Ireland US Other Countries
34%
66%
$4M
Gross Marketplace Value (GMV) (AUD)
$3M 8% International
7%
$2M FY 2017: 66% of GMV
booked outside of Australia.
46%
47%
FY 2018: New international
$1M 12% growth into new regions.
57%
33%
73%
$0M
FY 2013 FY 2014 FY 2015 FY 2016 FY 2017
FY 2013 FY 2014 FY 2015 FY 2016 FY 2017 FY 2018
ijij Australia ijij Australia ijij Australia ijij Australia ijij US ijij US
ijij New Zealand ijij New Zealand ijij New Zealand ijij US ijij Australia ijij Australia
ijij UK & Ireland ijij UK & Ireland ijij New Zealand ijij New Zealand ijij New Zealand
Growth in ijij US ijij UK & Ireland ijij UK & Ireland ijij UK & Ireland
international ijij Others ijij Others ijij Others ijij Others
regions
ijij New Regions
16LATEST H1 FY18 Continued growth across all metrics during
GROWTH
IPO period, expected to continue as partners
mature, and new regions come online.
Commissions and Fees Booked GMV Booked Passengers Travelled
FY 2017 FY 2018 FY 2017 FY 2018 FY 2017 FY 2018
Continued
$4.0M
growth across
900K 90K all metrics
$3.5M
800K 80K
Revenue from Commissions and Fees Booked (AUD)
$3.0M
700K 70K
600K $2.5M 60K
Passengers Travelled
GMV Booked (AUD)
500K 50K
$2.0M
400K 40K
$1.5M
300K 30K
$1.0M
200K 20K
Growth $0.5M
Growth Growth
+112% +107% +93%
100K 10K
0K $0.0M 0K
17 H1 H1 H1 H1 H1 H1FINANCIALS Strong revenue growth and
P&L H1 FY18 improvements to unit economics.
Income Statement Summary
H1 FY18 H1 FY17 Movement
AU$(000's) AU$(000's) %
GMV
Commissions and fees booked
3,917
947
1,891
427
107% ▲
122% ▲
+122% +107%
Commissions and fees refunded -168 -70
Gross profit 779 357 118% ▲
Commissions &
GMV
Advertising and marketing -664 -378
fees booked
Gross profit after paid acquisition
115 -21 648% ▲
(GPAPA)
Operations and support -916 -457
Gross profit after operations and
-801 -478 -68% ▼
support (GPAPAOS)
Growth costs exlucing capitalised
technology investment
-2,222 -747 +118% +648%
Operating EBITDA -3,023 -1,225 -147% ▼
Commissions and fees booked to GTV 24.2% 22.6% 7% ▲
GPAPA 12.1% -4.9% 347% ▲
Gross Profit GPAPA
GPAPAOS -84.7% -111.9% 24% ▲
Operating EBITDA margin -319.4% -286.7% -11% ▼
18FINANCIALS Balance sheet strengthened with
BALANCE H1 FY18 Pre-IPO and IPO funding.
Balance Sheet Summary
Cash balance H1 FY18 H2 FY17 Movement
ijij Cash position increased 492% following Pre-IPO funding round. AU$(000's) AU$(000's) %
ijij Subsequent to the end of the period an additional $1.5m received in Cash and cash equivalents 4,543 767 492% ▲
IPO funding round.
Trade and other receivables 914 635 44% ▲
Non current assets Total current assets 5,457 1,403 289% ▲
ijij $372,000 of additional growth investment recognised as an
intangible asset on the balance sheet before amortisation. Non current assets 2,873 2,183 32% ▲
Total Assets 8,331 3,586 132% ▲
Liabilities
ijij Current and non current borrowings converted to equity in Pre-IPO Trade payables 740 759 -3% ▼
funding round.
Future transport supplier payments 316 359 -12% ▼
Borrowings 425 -100% ▼
Other current liabilities 117 88 33% ▲
Total current liabilities 1,173 1,631 -28% ▼
Non current liabilities 35 1,253 -97% ▼
Total Liabilities 1,208 2,884 -58% ▼
Equity 7,122 702 915% ▲
19APPENDIX 20
MARKET                                                                                                                              7.7bn passenger trips to and from airports annually,

          GROWTH
                                                                                                                                              growing at 4.9% per annum. $100bn spent in airport
                                                                                                                                              transport annually, with growth of online booking.

        Growth in Passengers at Airports (10 -year forecast)                                                                                              Growth in Online Travel Booking (10- year forecast)
                                                    15                                                                                                                           $1,500
                                                           Forecast CAGR                                                                                                                     Forecast CAGR
     Market Size (Passengers Travelled, Billions)

                                                                                                                                            13.1

                                                            +4.9%                                                                                                                            +8.2%

                                                                                                                                                    Market Size (US$ Billions)
                                                    10                                                                                                                           $1,000
                                                         7.7

                                                     5                                                                                                                            $500

                                                     0                                                                                                                              $0
                                                         2016   2017   2018    2019    2020   2021    2022   2023    2024     2025   2026   2027                                          2016 2017 2018 2019 2020 2021 2022 2023 2024 2025 2026 2027
                                                                              Passengers Travelled (billions) (Source: ACI)                                                                                US$ (billions) (Source: ETOA)

       Frost and Sullivan reports that the estimated size of passenger transport to and from airports is US$100bn. Airport Councils International (ACI) reports that passenger

       transport to and from airports reached 7.7bn passengers in 2016, and forecasts this number to double by 2031 based on a projected growth rate of +4.9% per annum.

       In parallel, travel booking is moving online with European Tourism Association reporting that online travel booking is growing at a projected growth rate of +8.2% per annum.

21
FURTHER
READING
Welcome to Jayride
blog.jayride.com/insights/welcome-to-jayride
Jayride Debuts on the ASX
www.jayride.com/hubfs/resources/asx-announcements/jayride-debuts-on-the-asx.pdf
Jayride Quarterly Review and Appendix 4C
www.jayride.com/hubfs/resources/asx-announcements/quarterly-business-review-and-appendix-4c.pdf
Investor Announcements
www.jayride.com/investors
22ABOUT
JAYRIDE
Jayride.com provides seamless transport experiences for travellers by allowing them to compare
and book airport transfers around the world. With Jayride.com, travellers can compare and book
with 2,000+ transport companies, servicing destinations from over 500+ airports across the US,
UK, Ireland, Australia, and New Zealand.
The Jayride.com platform aggregates airport transfer companies and distributes them to travellers
at Jayride.com; and via partnerships with other travel technology platforms, travel agencies and
wholesalers. These partners implement Jayride.com APIs to sell airport transfers and add new
incremental ancillary revenue to their travel businesses.
Founded in 2012, Jayride.com is headquartered in Sydney, Australia.
For more information, please visit www.jayride.com .
Disclaimer
This announcement contains forward-looking statements that involve risks and uncertainties. Indications of, and guidelines or outlook on, future earnings, distributions or financial position or performance and targets,
estimates and assumptions in respect of production, prices, operating costs, results, capital expenditures, reserves and resources are also forward-looking statements. These statements are based on an assessment
of present economic and operating conditions, and on a number of assumptions and estimates regarding future events and actions that, while considered reasonable as at the date of this announcement and are
expected to take place, are inherently subject to significant technical, business, economic, competitive, political and social uncertainties and contingencies. Such forward-looking statements are not guarantees of future
performance and involve known and unknown risks, uncertainties, assumptions and other important factors, many of which are beyond the control of the Company, the directors and management. We cannot and do
not give any assurance that the results, performance or achievements expressed or implied by the forward-looking statements contained in this announcement will actually occur and readers are cautioned not to place
undue reliance on these forward-looking statements. These forward-looking statements are subject to various risk factors that could cause actual events or results to differ materially from the events or results estimated,
expressed or anticipated in these statements.
23FOR MORE INFORMATION Please contact Rod Bishop, Managing Director corporate@jayride.com
You can also read