Unilever Half Year 2020 Results - Alan Jope & Graeme Pitkethly 23rd July 2020
←
→
Page content transcription
If your browser does not render page correctly, please read the page content below

Unilever Half Year 2020 Results
Alan Jope & Graeme Pitkethly

23rd July 2020

Safe harbour statement
This announcement may contain forward-looking statements, including ‘forward-looking statements’ within the meaning of the United States
Private Securities Litigation Reform Act of 1995. Words such as ‘will’, ‘aim’, ‘expects’, ‘anticipates’, ‘intends’, ‘looks’, ‘believes’, ‘vision’, or the
negative of these terms and other similar expressions of future performance or results, and their negatives, are intended to identify such
forward-looking statements. These forward-looking statements are based upon current expectations and assumptions regarding anticipated
developments and other factors affecting the Unilever Group (the ‘Group’). They are not historical facts, nor are they guarantees of future
performance.

Because these forward-looking statements involve risks and uncertainties, there are important factors that could cause actual results to differ
materially from those expressed or implied by these forward-looking statements. Among other risks and uncertainties, the material or
principal factors which could cause actual results to differ materially are: Unilever’s global brands not meeting consumer preferences;
Unilever’s ability to innovate and remain competitive; Unilever’s investment choices in its portfolio management; the effect of climate change
on Unilever’s business; Unilever's ability to find sustainable solutions to its plastic packaging; significant changes or deterioration in customer
relationships; the recruitment and retention of talented employees; disruptions in our supply chain and distribution; increases or volatility in
the cost of raw materials and commodities; the production of safe and high quality products; secure and reliable IT infrastructure; execution
of acquisitions, divestitures and business transformation projects; economic, social and political risks and natural disasters; financial risks;
failure to meet high and ethical standards; and managing regulatory, tax and legal matters. A number of these risks have increased as a result
of the current COVID-19 pandemic. These forward-looking statements speak only as of the date of this document. Except as required by any
applicable law or regulation, the Group expressly disclaims any obligation or undertaking to release publicly any updates or revisions to any
forward-looking statements contained herein to reflect any change in the Group’s expectations with regard thereto or any change in events,
conditions or circumstances on which any such statement is based. Further details of potential risks and uncertainties affecting the Group are
described in the Group’s filings with the London Stock Exchange, Euronext Amsterdam and the US Securities and Exchange Commission,
including in the Annual Report on Form 20-F 2019 and the Unilever Annual Report and Accounts 2019.

                                                                                                                                                            2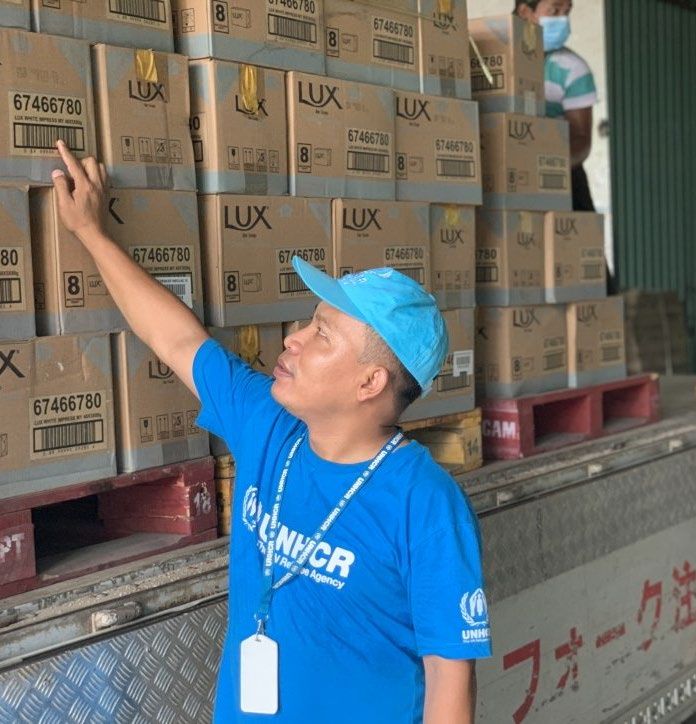
Alan Jope
Unilever Half Year 2020 Results

23rd July 2020
2020: Half year results

               Growth                                          Profit      Cash          Earnings & Dividend
    Underlying Sales Growth                                     UOP     Free Cash Flow       Underlying EPS

                                                              €5.1bn
             (0.1)%                                           +3.8%
                                                                        €2.9bn                 +6.4%
                                                                                              Dividend
             (0.3)%                                           +50bps    +€1.3bn              maintained

 Underlying Volume Growth                                      UOM       vs H1 2019         Quarterly Dividend

                                                                                                                 4
Absolute UOP as reported, UOP growth rate on constant basis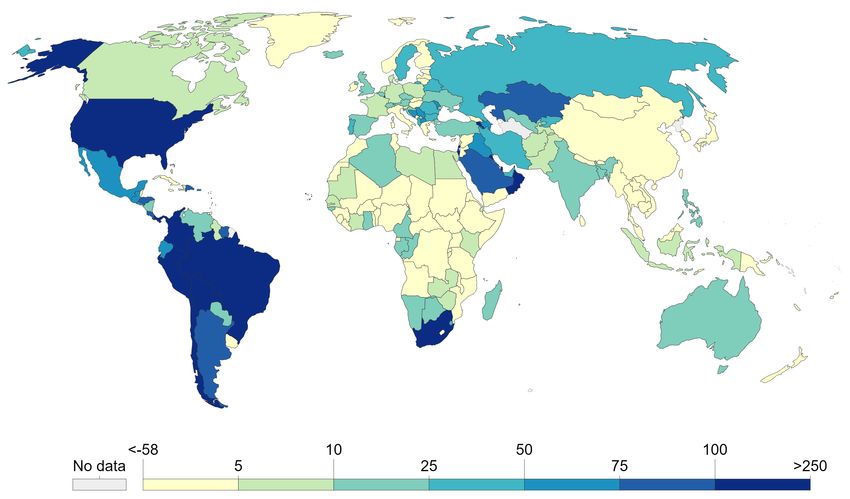
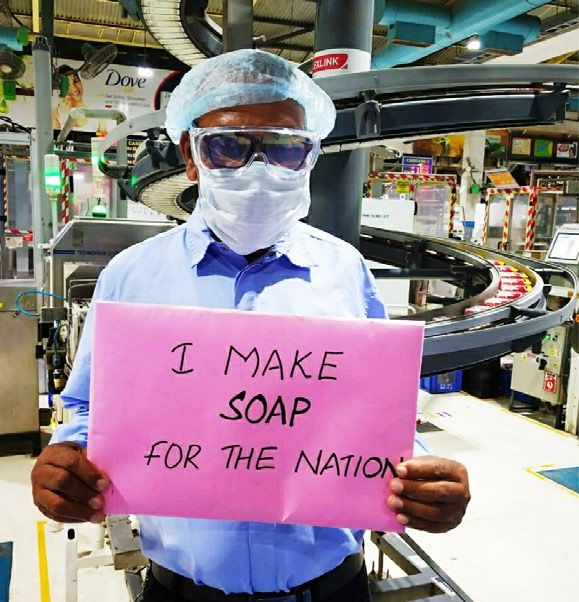
Managing our Covid-19 response

 People    Supply    Demand      Community   Cash

                                                    5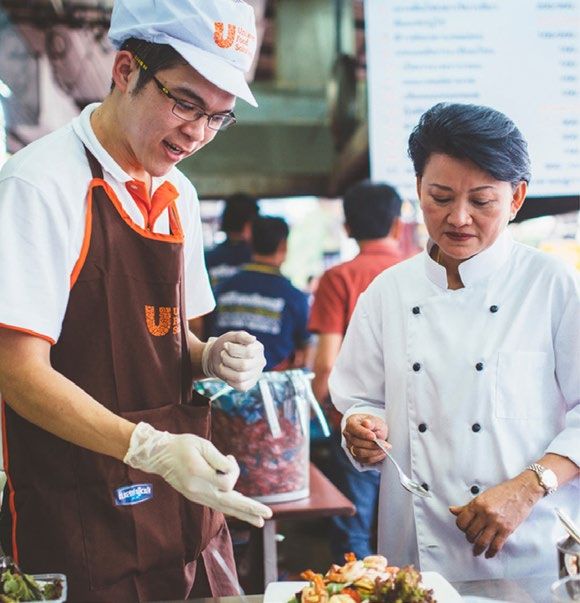
Operational excellence through 5 fundamentals

                        Volume growth & share

      1

                         Focused innovation

      2

                         Ecommerce & value

      3

                         Never more relevant

      4

                            Cash priority

      5
                                                6
Strategic change agenda
 Legal simplification   Shaping the portfolio   Climate & nature
                                                 commitments

                                                                   7
€26bn
   Category portfolio                                                                                                                                         Turnover
                                                                                                                                                              H1 2020

                                                                                                                 €4bn
                                                                                                                 TO H1
                                                                                                                  2020

                                                                                                Laundry
                                                          €4bn                                 H1           Q2
  80% EM                                                  TO H1
                                                           2020                              USG (1)%     USG (1)%

                                     Hygiene
                                   H1               Q2                                                                €7bn                          €0.3bn
                                                                                                                         TO H1                      TO H1
                                                                                                                          2020                       2020
                               USG 17%          USG 26%
                                                                                               Personal Care                         Prestige
                                                                                                    H1           Q2                H1          Q2
  60% EM
                                                                                               USG (6)%     USG (10)%            USG (6)%   USG (10)%

                                                                               €8bn                                                                               €2bn
                                                                               TO H1                                                                              TO H1
                                                                                2020                                                                               2020

                                                          In Home                                                                            Out of Home
                                                        H1                Q2                                                                    H1           Q2
  50% EM                                            USG 11%          USG 17%                                                                 USG (32)% USG (42)%

                                                                                                                                                                          8
Hygiene: Skin Cleansing + Home & Hygiene Personal Care: Personal Care excl. Skin Cleansing
H1                 H1
                                                                                                    (0.3)%            0.1%
   Beauty & Personal Care                                                                     USG               UVG

                                                                                        Skin Cleansing
                                                           Skin Cleansing                             Q2 USG%
                                                            +27% Q2 USG     Bars                        +2%
                                                                            Bodywash                    +12%
                                                                            Liquid Handwash            +155%
                                                                            Sanitiser                 >+20,000%
                                                            Rest of BPC
                                                                            Total Skin Cleansing        +27%
                                                            (10)% Q2 USG

                                                                                          Hair Care
                                                                                                      Q2 USG%
                                                              Prestige      Wash & Care                 (1)%
                                                            (10)% Q2 USG
                                                                            Styling                     (32)%
                                                                            Total Hair                  (6)%

                                                                                                                             9
Rest of BPC: Hair care, Deodorants, Skin Care, Oral Care
H1               H1
                                                                        (1.7)%          (2.5)%
   Foods & Refreshment                                            USG             UVG

                                                                In Home

                                    In Home                             Q2 USG%

                                   +17% Q2 USG    Savoury,
                                                                          +14%
                                                  Dressings and Tea
                                                  Ice Cream               +26%

                                                              Out of Home

                                   Out of Home                          Q2 USG%

                                   (42)% Q2 USG   Ice Cream               (35)%
                                                  UFS                     (56)%

                                                                                            10
UFS included in other categories
H1 H1
3.2% 2.9%
Home Care 3.2%
USG UVG
Home & Hygiene
Q2 USG%
Home & Hygiene
+24% Q2 USG
Sunlight +5%
Cif +20%
Domestos +37%
Sun +32%
Laundry Living
+87%
(1)% Q2 USG Hygiene
Seventh
+54%
Generation
11eCommerce
Q2 Growth
+78% +48%
+62%
eB2B Brazil
+58%
Pure play
+59%
China
8% Hellmann’s
% of H1 Total Sales
+120% +177%
Omnichannel USA
12
eB2B excludes UFSGraeme Pitkethly Unilever Half Year 2020 Results 23rd July 2020
A global pandemic

                                                                                                    14
Map depicts the daily confirmed COVID-19 cases per million, 3-day rolling average, 17th July 2020
Macro uncertainty
Rising COVID-19 cases Wide range of economic Volatile currencies and
outlooks commodities
Asia
Europe
North America
Middle East
Latin America
Africa J F M A M J J
2019 2020 2021 2022 2023 2024
J F M A M J J Crude EUR/ BRL
15
Daily confirmed COVID-19 cases per million, 7-day rolling average, 15th July 2020H1 H1
(0.1)% (0.3)%
H1 2020: Group USG performance USG UVG
USG 3.8% 2.9% 1.5% 0.0% (0.3)% India UK China
Outbreak Recovery
USA Brazil
UPG • Resilient performance in a volatile and
0.5%
challenging operating environment
UVG (0.8)%
• Spread of Covid-19 and implementation of
lockdowns and restrictions
'19 Q2 '19 Q3 '19 Q4 '20 Q1 '20 Q2 • Some lockdowns have had a more severe impact
on the supply and accessibility of goods
• Changing consumer demand patterns
16
Reflecting treatment of hyperinflation in USG as announced in September 2019H1 H1
(2.7)% (2.9)%
Asia / AMET / RUB USG UVG
USG 6.3% 5.6% 2.1% (3.7)% (1.8)% S Africa India China
Outbreak
Outbreak Recovery
Recovery
Russia Indonesia S Korea
UPG
• China: sales down mid single digits following a
return to growth in Q2 as the market reopened
UVG
• India: declined high single digits impacted by a
slowing market, followed by the national
lockdown from March
'19 Q2 '19 Q3 '19 Q4 '20 Q1 '20 Q2
• SEA: Indonesia & Vietnam in growth, Philippines &
Thailand declined
17
Reflecting treatment of hyperinflation in USG as announced in September 2019H1 H1
1.9% (0.8)%
Latin America USG UVG
USG 11.6% 3.2% 3.8% 4.9% (0.8)% Mexico
Outbreak
Outbreak Recovery
Recovery
Brazil Argentina
UPG • Q2 impacted by the spread of Covid-19 and
lockdown measures
UVG
• Brazil: sales up low single digits for the half,
following a decline in Q2 with regional lockdowns
implemented
'19 Q2 '19 Q3 '19 Q4 '20 Q1 '20 Q2
• Argentina: continued volume growth, driven by
in-home food consumption
18
Reflecting treatment of hyperinflation in USG as announced in September 2019H1 H1
7.3% 7.7%
North America USG UVG
USG (0.2)% 0.3% 0.6% 4.8% 9.5% Canada
Outbreak
Outbreak Recovery
Recovery
USA
• Growth driven by in-home foods & ice cream, and
UPG hygiene products
• Q2 Foods & Refreshment USG +23% (excl. Food
UVG
Service)
'19 Q2 '19 Q3 '19 Q4 '20 Q1 '20 Q2 • H1 regional growth includes c.3% negative impact
from Food Service and Prestige due to channel
closures
19H1 H1
(1.8)% (1.0)%
Europe USG UVG
USG (1.6)% (0.3)% (0.8)% 1.4% (4.5)% UK Italy Germany
Outbreak
Outbreak Recovery
Recovery
UPG
Spain France NL
UVG
• Out of Home Ice Cream and Food Service impacted
by lockdowns across the region, primarily in Q2
• Sustained increases in in-home food consumption
and hygiene products
'19 Q2 '19 Q3 '19 Q4 '20 Q1 '20 Q2 • Italy & Spain: sales declined, led by OOH channels
• UK & Germany: growth maintained, despite
headwind from OOH channels
20H1 2020: Turnover (1.6)%
USG (0.1)% +1.2%
(0.2)%
+0.2%
(0.3)%
A & D +1.1%
(2.5)%
€26.1 bn
€25.7 bn
21
Reflecting treatment of hyperinflation in USG as announced in September 2019H1 2020: Underlying operating margin
+100bps
(20)bps
(80)bps Mix &
COVID-19
19.8%
19.3% (30)bps
22
All numbers on an IFRS 16 basisH1 2020: Underlying earnings per share
+5.4%
+0.3%
(1.9)%
+2.4%
+3.9% (3.7)%
€1.35
€1.27
Underlying EPS +6.4%
23
All numbers on an IFRS 16 basisH1 2020: Free cash flow
€0.4bn
€0.1bn
€0.7bn
€0.1bn
€2.85bn
€1.55bn
24
All numbers on an IFRS 16 basisH1 2020: Balance sheet and liquidity position
Net debt Access to funding Cash & facilities Pensions
H1 ‘20 Net debt/EBITDA Commercial paper at Total cash & undrawn Deficit at
30/06/2020 facilities at 30/06/2020 30/06/2020
1.9x €1.3bn €11.9bn €(0.4)bn
A1/A+ €7bn €(0.2)bn
2.7x coverage of
debt maturing
in 1 year
Credit rating Accessible undrawn As of H1 ‘20 Increase in deficit vs.
standby facilities FY 2019
25
All numbers on an IFRS 16 basisAlan Jope Unilever Half Year 2020 Results 23rd July 2020
Unilever #ComeOutStronger
         Resilience                       Agility              Strategic future

•   Portfolio                •   Category                 •   Unification

•   Operational excellence   •   Geography                •   Portfolio evolution

•   Financial strength       •   Supply                   •   Sustainability

       We are focused on volume led, competitive growth; absolute underlying
                             operating profit; and cash
                                                                                    27
Unilever Half Year 2020 Results Alan Jope & Graeme Pitkethly 23rd July 2020
You can also read