Q3 2019 Investor Presentation - Dunkin ...
←
→
Page content transcription
If your browser does not render page correctly, please read the page content below

Q3 2019 Investor Presentation
Forward Looking Statements
•   Certain information contained in this presentation, particularly information regarding future economic
    performance, finances, and expectations and objectives of management constitutes forward-looking
    statements. Forward-looking statements can be identified by the fact that they do not relate strictly to historical
    or current facts and are generally contain words such as “believes,” “expects,” “may,” “will,” “should,” “seeks,”
    “approximately,” “intends,” “plans,” “estimates” or “anticipates” or similar expressions. Our forward-looking
    statements are subject to risks and uncertainties, which may cause actual results to differ materially from those
    projected or implied by the forward-looking statement.

•   Forward-looking statements are based on current expectations and assumptions and currently available data
    and are neither predictions nor guarantees of future events or performance. You should not place undue reliance
    on forward-looking statements, which speak only as of the date hereof. We do not undertake to update or revise
    any forward-looking statements after they are made, whether as a result
    of new information, future events, or otherwise, except as required by applicable law. For discussion of some of
    the important factors that could cause these variations, please consult the “Risk Factors” section of the
    Company’s most recent Annual Report on Form 10-K. Nothing in this presentation should be regarded as a
    representation by any person that these targets will be achieved and the Company undertakes no duty to
    update its targets.

•   Regulation G
    This presentation contains certain non-GAAP measures which are provided to assist in an understanding of the
    Dunkin’ Brands Group, Inc. business and its performance. These measure should always be considered in
    conjunction with the appropriate GAAP measure. Reconciliations of non-GAAP amounts to the relevant GAAP
    amount are available on www.investor.dunkinbrands.com.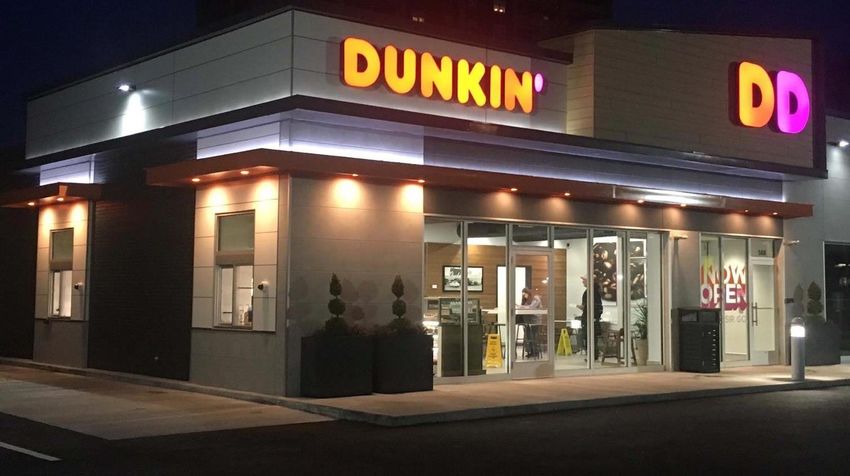
ASSET-LIGHT

  70                                  100%
YEARS OF BRAND   SIGNIFICANT U.S. &   FRANCHISED    GLOBAL CHANNEL
   HERITAGE       GLOBAL GROWTH         BUSINESS     OPPORTUNITIES
                    OPPORTUNITY

          Dunkin’ Brands is unique in the QSR space
77%       17%
          OF 2018
OF 2018   SEGMENT
SEGMENT   REVENUE
REVENUE

             6%
              OF 2018
              SEGMENT
              REVENUE
Defensive, Predictable Business Model

                   Q3 2019 PERFORMANCE HIGHLIGHTS

             +1.5%                     +55              +122
             DUNKIN’ U.S.        DUNKIN’ U.S. NET     GLOBAL NET UNIT
               COMPS              DEVELOPMENT          DEVELOPMENT

                    Q3 2019 FINANCIAL HIGHLIGHTS

  +4.7%                +1.7%                  +7.8%               +8.4%
SYSTEMWIDE SALES       TOTAL REVENUE      ADJUSTED OPERATING    DILUTED ADJUSTED
    GROWTH                GROWTH           INCOME GROWTH           EPS GROWTH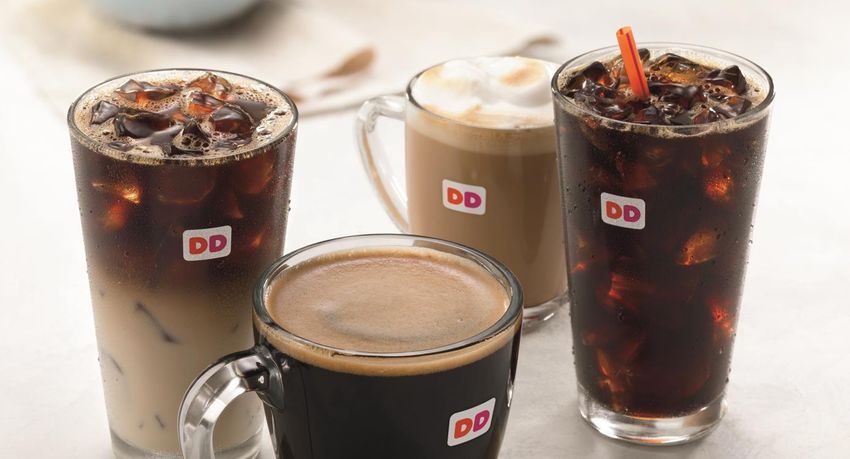
Dunkin’ U.S.
Dunkin’ is a Brand that can Win
13 consecutive
9,500+ 5 billion+ cups of
Dunkin’ coffee
consumed in 2018 (1)
years of being
named #1
U.S. Stores Coffee chain
by consumers (2)
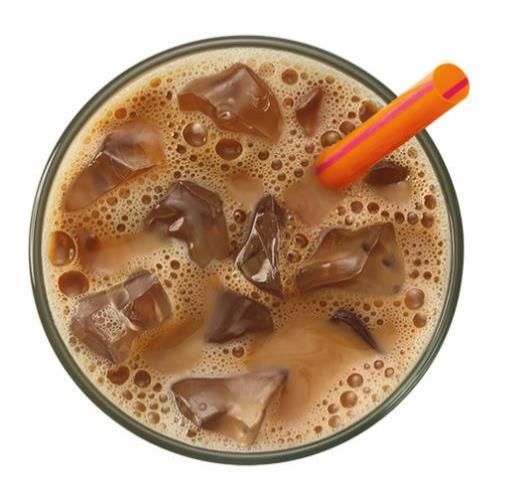
~$8.8B #1 seller of total drip coffee
#1 seller of iced brewed coffee
#2 seller of cold brew
#2 seller of breakfast
#1 seller of donuts sandwiches
U.S. Systemwide #1 seller of bagels (3) #2 seller of muffins (3)
Sales in 2018
Broad DD product accessibility:
Ready-to-drink bottled iced coffee, 6-years of growth in
ready-to-drink espresso, K-cups, and breakfast sandwich servings
bagged coffee in grocery and retail
(1) Total cups coffee in U.S. restaurants and CPG channels
(2) Source: Brand Keys, Dunkin’ named #1 brand for Customer Loyalty in the Out-Of-Home Coffee category, and #1 brand in the Packaged Coffee category
(3) Source: The NPD Group/CREST® for the year ending May 2019 in QSR (based on servings); Breakfast sandwich servings include wraps/burritos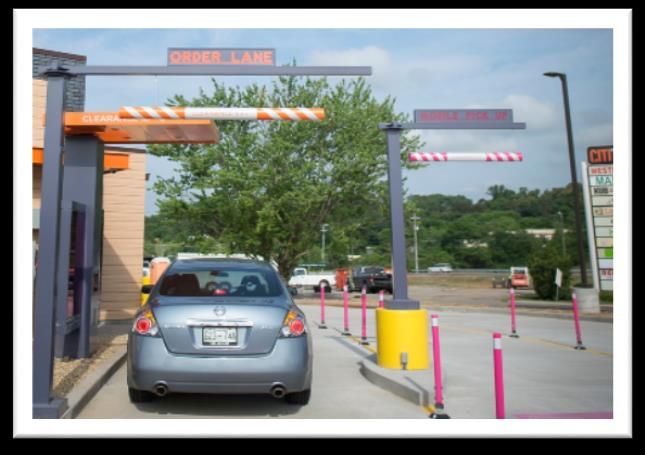
OUR FOCUS:
BEVERAGE-LED,
 ON-THE-GO
Broad
                   Accessibility
    Unparalleled               Restaurant
    Convenience                Excellence

   Menu                               Brand
Innovation                           Evolution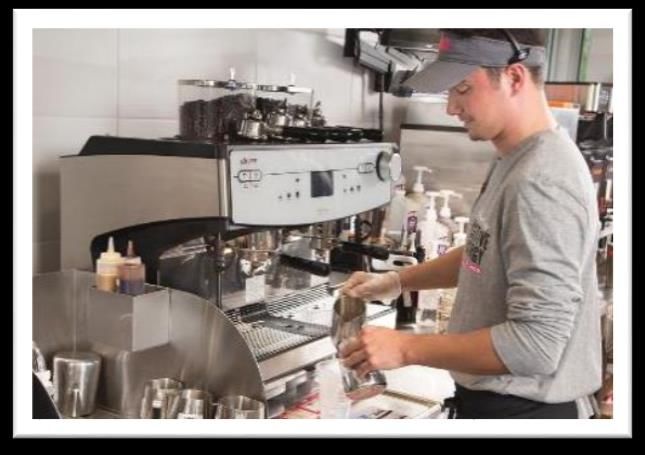
Menu Innovation
BEVERAGE-LED INNOVATION TO FUEL GROWTH

   GROW AND PROTECT THE CORE         EXPAND PRODUCT INNOVATION

OFFER CONSISTENT, COMPELLING VALUE     CREATE SECOND DAYPART
Unparalleled Convenience
DEDICATED TO PROVIDING GUESTS WITH
                   UNPARALLELED CONVENIENCE

LEVERAGING PARTNERSHIPS   DRIVING MOBILE AND    EXPANDING DELIVERY
      TO GROW CPG         DIGITAL INNOVATION   THROUGH PARTNERSHIPS

  BROAD ACCESSIBILITY         ON-THE-GO         SUPER CONVENIENCE
LEVERAGING CPG TO BUILD BRAND
BEYOND TRADITIONAL FOUR WALLS
BREW-AT-HOME BREWED GRAB AND GO NEW PARTNERSHIPS
CONVENIENCE ON-THE-GO AND OCCASIONS
~$700M* IN CPG RETAIL SALES IN 2019 YTD, INCLUDING OVER
$120M IN READY-TO-DRINK BOTTLED ICED COFFEE
14
Source: IRI, measured through Q3 2019 *Represents total retail sales in CPG across Dunkin’ and Baskin-Robbins brandsMULTI-TENDER IS TRUE UNLOCK TO
DD PERKS LOYALTY PROGRAM
12.7M 13%
DD PERKS LOYALTY DD PERKS LOYALTY
MEMBERS TOTAL MEMBER SPEND*
4% 80%
ON-THE-GO MOBILE ON-THE-GO
ORDERING** RETRIAL RATE
INCREASING ENGAGEMENT AND DRIVING
INCREMENTAL SALES VIA 1:1 MARKETING
*Represented as a % of Dunkin’ U.S. sales in Q3 2019.
**Represented as a % of transactions in Q3 2019.ENABLING SPEED AND CONVENIENCE
THROUGH DIGITAL CHANNELS
DELIVERY MULTI-TENDER GUEST CHECKOUT APP UPGRADES
TO MAKE THE DUNKIN’ EXPERIENCE
FRICTIONLESS FOR GUESTSUnparalleled Convenience: Restaurant Expansion
DIFFERENT DEVELOPMENT STRATEGIES FOR DIFFERENT MARKETS

                                                                                                                                 TRANSFORM /
                                                                                                                               OPTIMIZE EXISTING
                                                                                                                                    ASSETS

                                                                                                                              INCREMENTAL
                                                                                                                             GROWTH TO DRIVE
                                                                                                                              CONVENIENCE

Region                          Store Count                      Penetration
Northeast                             4,691                          1:9,341
East                                  4,136                         1:34,877
West                                   591                         1:208,729                            ACCELERATE GROWTH
Not Yet Selling                          1                      1:15,715,280                            TO ESTABLISH BRAND
Total                                 9,419                         1:34,732                                 PRESENCE
Note: Statistics as of YE 2018. [Not pictured: Hawaii has 12 Dunkin’ U.S. restaurants as of YE 2018].
DUNKIN’ U.S. NET DEVELOPMENT
One of the fastest-growing
QSR brands by unit count in the U.S.
2019 Target 3-Year Target
Low end of 200 – 250 net new units; 200 – 250 net new units annually
majority will be NextGen design
19COMPELLING UNIT ECONOMICS DRIVING ACCELERATED
GROWTH OUTSIDE OF CORE MARKETS
2017 TOP 10
DEVELOPING MARKETS
• 90% of future growth outside of core markets
• Top 10 developing markets represent 60% of
future growth
AVERAGE INITIAL AVERAGE UNIT AVERAGE CASH-ON-CASH
CAPEX (1) VOLUMES (2) BEVERAGE MIX: RETURNS (3)
~$550K ~$950K ~40% 20% - 25%
Note: As of April 2019. Based on standalone, traditional Dunkin' Restaurants. Not disclosing specific markets for competitive reasons; these are the expected returns.
(1) Number is rounded; represents the approximate initial capex for cohort
(2) Number is rounded; represents the approximate unit volume for cohort
(3) Number is rounded; represents the approximate cash-on-cash return for cohortRestaurant Excellence
RESTAURANT EXCELLENCE IS CENTERED ON
            IMPROVING THE GUEST EXPERIENCE

  RESTAURANT
                      SPEED OF SERVICE   CREW TRAINING
SIMPLIFICATION

                 “GREAT COFFEE….FAST”
Brand Relevance
TRANSFORMATION UNDERWAY
TO INCREASE BRAND RELEVANCE
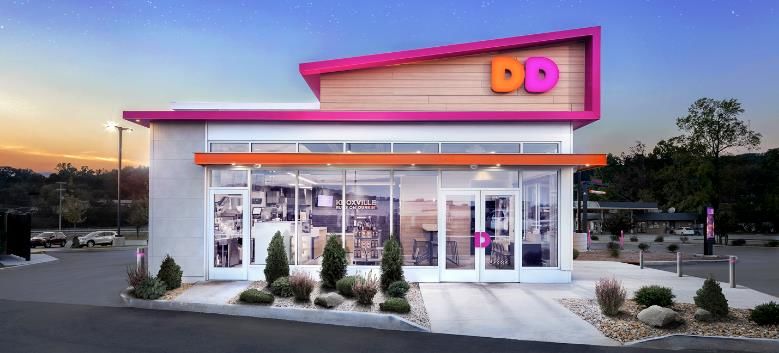
DEBUTED DUNKIN’ U.S. UNVEILED NEW ESPRESSO PLATFORM TRANSITION UNDERWAY
NEXTGEN STORE DESIGN BRAND IDENTITY RELAUNCH FROM FOAM TO DOUBLE
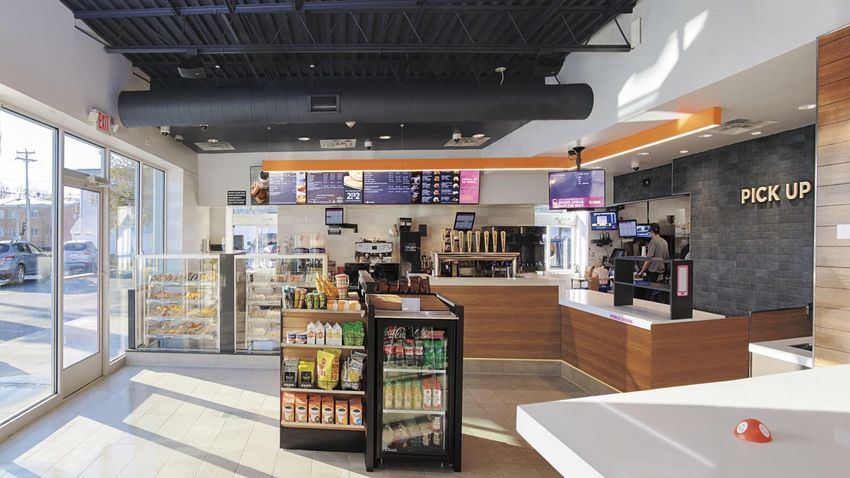
WALLED PAPER CUPSKEY ENHANCEMENTS OF NEXTGEN STORE DESIGN AIMED AT
IMPROVING GUEST AND CREW EXPERIENCE
DEDICATED MOBILE ORDER FRONT-FACING BAKERY CASES TAP SYSTEM TO SERVE
PICK-UP AREA PROMOTE IMPULSE PURCHASES ICED BEVERAGES
OPENED ~400 NEXTGEN RESTAURANTS
TO DATE ACROSS THE U.S.Dunkin’ NextGen
Restaurant
Quincy, MA
26Baskin-Robbins U.S.
PREMIUM PRODUCTS,
    PREMIUM EXPERIENCE
“Raising the Bar” initiatives include:
•    Improve guest experience to
     match premium products
•    Increase value offerings
•    Enhance convenience:
     • Digital in-store ordering
     • Home delivery with DoorDash

• Expand test of Moments store
  design; 11 stores open in the U.S.
• Optimize restaurant base through
  strategic closures and transfers

                                         28
International
INTERNATIONAL FOCUS ON STRATEGIC MARKETS AND
               LONG-TERM GROWTH OPPORTUNITIES
ENHANCING IN-STORE EXPERIENCE          ESTABLISHING STRONG           GROWING NON-TRADITIONAL
                                     DELIVERY INFRASTRUCTURE              AND CHANNEL

 TO INCREASE TRANSACTIONS       TO INCREASE BRAND ACCESSIBILITY   TO ENHANCE BRAND RELEVENCE &
      AND BUILD SALES                  AND CONVENIENCE             OPTIMIZE BRAND PENETRATION
                                                                                       30
Financial Targets
2019 GUIDANCE
DUNKIN’ U.S.
•      Low-single digit percent comparable store                FINANCIAL TARGETS
       sales growth
                                                            • Low-to-mid single digit percent revenue
•      Low end of 200-250 range for net new unit
                                                              growth
       openings
•      >$130 million in systemwide sales for new            • Low-to-mid single digit percent other
       units opened in 2019                                   revenue growth
                                                            • Mid-to-high single digit percent operating
BASKIN-ROBBINS U.S.                                           and adjusted operating income growth
•      Flat to slightly negative comparable store
                                                            • Mid-single digit reduction to G&A expense
       sales growth
•      ~10 net unit closures                                • ~25% effective tax rate(1)
                                                            • $2.80 - $2.85 GAAP Diluted EPS
                                                            • $3.10 - $3.12 Non-GAAP Diluted EPS
INTERNATIONAL                                               • ~84 million full-year weighted-average
•      ~$16 million ice cream margin dollars                  shares outstanding
•      Flat JV net income compared to 2018                  • ~$119 million in net interest expense
                                                            • ~$40 million in capital expenditures

    Reflects 2019 Guidance as of October 31, 2019.   (1) Tax guidance excludes any potential future impact from material excess tax benefits in 2019.
LONG-TERM ANNUAL TARGETS (THROUGH 2021) FINANCIAL TARGETS • Low single digit percent comparable sales growth for Dunkin' U.S. • 200 - 250 net new units for Dunkin’ U.S. • Low-to-mid single digit percent revenue growth • Low single digit percent G&A expense growth (2020 and beyond) • Mid-to-high single digit percent operating and adjusted operating income growth
The “Perks” of
Investing in Reliable and diversified
Dunkin’ Brands financial results
Asset-light, 100%
franchised model
Strong free cash flow
conversionYou can also read