Determinants of Banking Profitability through ROA and ROE: A Panel Data Approach
←
→
Page content transcription
If your browser does not render page correctly, please read the page content below
“Ovidius” University Annals, Economic Sciences Series
                                                                                     Volume XX, Issue 1 /2020

       Determinants of Banking Profitability through ROA and ROE:
                         A Panel Data Approach

                                        Nina Sinițîn
                       “1st of December 1918” University of Alba Iulia,
                           Doctoral School in Accounting, Romania
                                    ninasinitin@yahoo.ro
                                        Adela Socol
                  “1st of December 1918” University of Alba Iulia, Romania
                                   adelasocol@yahoo.com

                                             Abstract

    Empirical review of literature on banks’ profitability suggests many determinants of banking
profitability (measured through ROA Return on Assets and Return on Equity ROE, the main
popular indicators of bank performance), from which we focus on GDP growth, Inflation,
Loans/deposits ratio and Bank capital/total assets ratio. This paper intends to find if there is any
significant relationship between ROA or ROE and these mentioned independent variables. We use
Ordinary Least Squares OLS method with robust standard errors, consistent with panel-specific
autocorrelation and heteroskedasticity. Our study is based on a panel database including 13
European Union countries over the period of 18 years ranging from 2000 to 2017. The empirical
results reveal that there is a positive and a significant relationship between ROA or ROE and GDP
growth, while the rest of the independent variables have a lesser influence on ROA or ROE.

Key words: ROA, ROE, Banking profitability, European Union
J.E.L. classification: C23, G21, F62

1. Introduction

   There are some reasons why the banks’ profitability became a major subject in the last few
years in the context of the manifestations of the 2008 international financial crisis, which affected
many banking systems. The crisis has catalysed an unprecedent phenomenon of worsening of the
loans quality and the non-performing loans grew exponentially during the crisis. The required
adequate level of banking capitalization (imposed by the Basel III Agreement and subsequently by
the European Directives and national legislations) affects the banks’ capacity to sustain increased
volumes of credits that traditionally generate profit. Significant gaps between national economic
conditions were exacerbated in the last years and the dependency of the banking systems on the
macroeconomic drivers is welknown. In this paper, we search for concrete evidence of such banks’
behaviour, in order to find if macroeconomic conditions (GDP growth and inflation) influence a
banks’ profitability. Also, we have added in the research, the internal banking determinants, that
can characterise capital adequacy and lending features of the banks (Loans/deposits ratio and Bank
capital/total assets ratio).
   Weak profitability has persisted in the European Union countries, in the last few years. The
notable differences in profitability of the different countries exist and they can be explained by
cyclical factors and specificity of each banking system or bank. Some of the banks have internal
weaknesses in internal control and corporate governance or in their business model and these
particularities generate diferencies in terms of profitability between countries.
   The following figures capture the profitability of banking systems from the 13 European Union
countries, between 2000 and 2017 and show an unequal evolution of banks’ profitability.

                                              1037
“Ovidius” University Annals, Economic Sciences Series
Volume XX, Issue 1 /2020
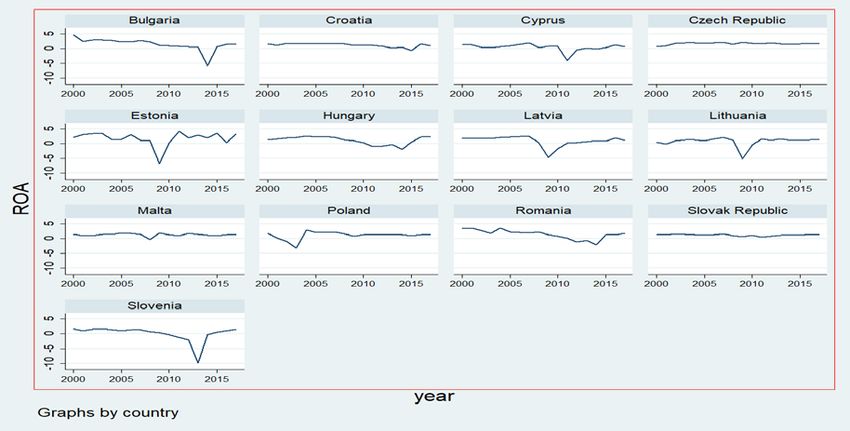
Figure no. 1. ROA for European Union countries (panel), 2000-2017
Source: Authors’ calculations
In terms of ROA, surprising is the fact that in several countries (Czech Republic, Croatia,
Poland and Slovak Republic) the 2008 financial crisis did not deteriorate their profitability and
these banking systems have presented a linear evolution, without major oscillations that lead to a
negative level of profitability. Unlike these states, the amplitude of the negative levels of
profitability was significantly higher in Estonia, Latvia and Lithuania 2008-2010, Cyprus 2010-
2012, Slovenia 2012-2014 and Bulgaria 2013-2015. Hungary and Romania had the atypical
evolution and their banks’ profitability decreased moderately starting to the year 2008 (year of
debut of the financial crisis) and stayed in the negative territory until the year 2015, since then they
have started to slowly recover.
Figure no. 2. ROE for European Union countries (panel), 2000-2017
Source: Authors’ calculations
In terms of ROE, the banking profitability in the analysed countries has been slowly recovering
after the 2008 financial crisis. After reaching the lowest values and results (Cyprus 2010-2012,
Estonia, Latvia and Lithuania 2008-2010, Slovenia 2012-2014), ROE remained positive and
recorded improvements in all other studied countries. Poland exhibited an atypical behavior, which
1038“Ovidius” University Annals, Economic Sciences Series
Volume XX, Issue 1 /2020
presents a short period of the profitability decreasing in the first part of the 2000s, when the
banking system has recorded negative results, but after this period, the banks’ profitability
remained relatively stable.
The paper have the following structure: part 2 presents the literature review, part 3 contains the
methodological aspects and data analysis, part 4 describes the findings and part 5 presents the
conclusions.
2. Literature review
Our study is in line to previous research of Capraru and Ihnatov (Capraru and Ihnatov, 2014, pp.
587-591), who have used ROE/ROA as proxy for banks profitability and they have obtained
statistical influences of macroeconomic factors (inflation and economic growth) on ROA and ROE.
They have studied banks’ profitability in five selected CEE countries (Romania, Hungary, Poland,
Czech Republic and Bulgaria) for 143 commercial banks from 2004 to 2011 and they have studied
some internal or external bank factors as independent variables (bank size, capital adequacy, credit
risk, management efficiency, liquidity risk, market concentration). These independent variables
have been studied by the authors in other papers (Petria et. al., 2015, pp. 518-524) in European
Union 27 countries over the period 2004-2011 and the results reveal that the GDP growth has a
positive effect on bank profitability, while the inflation seems not to influence the performance.
Previous research studied the banks’ profitability in South Africa over the period 2006 to 2015
through generalised methods of Moments (GMM) and panel Two-Stage Least Squares (2SLS) or
Pooled IV method as the estimation techniques (Nyoka, 2019, pp. 99-116). The author obtained
evidence of a positive relationship between bank capital and profitability (between capital to assets
ratio, return on equity ROE and return on assets ROA). Recent studies examined the predictors of
ROA and ROE for banks listed on Vietnamese stock market, using a basic OLS regression model,
which computed among others variables GDP growth as proxy (Pointer and Khoi, 2019, pp. 185-
198). The results show none of macroeconomic variables (including GDP) were predictors of either
ROA or ROE.
Different countries have been studied from a bank’s profitability point of view. The
microeconomic factors (size, capital, loan, deposits) and the external factors (GDP, inflation and
stock market capitalization) have a significant impact on the profitability of the banks in Pakistan
between 2005 and 2009 (Gul et al, 2011, pp. 61-87). In Central and Eastern Europe between 1993
and 2003 greenfield banks have performed better in terms of ROA than domestic and takeover
(Havrylchyk and Jurzyk, 2011, pp. 443-472). The authors have been studied the independent
variables regarding the macroeconomic conditions (GDP growth, inflation, real interest rate and
change in real effective exchange rate).
Various factors affect bank profitability and a large set of empirical studies has analysed the
determinants of bank profitability, that can be allocated specially into some categories regarding
the macroeconomic factors or banking specific factors.
3. Research methodology
Our study presents an empirical analysis on some determinants of 13 European Union countries
banks’ profitability, focusing on relationship between ROE (Bank return on equity - %, before tax)
and GDP growth (annual %), Inflation, consumer prices (annual %) and Loans to deposits (%).
Also, we study profitability measured by ROA (Bank return on assets %, before tax) and few
potential influencing factors: GDP growth (annual %), Inflation, consumer prices (annual %),
Loans to deposits (%) and Bank capital to total assets (%).
The empirical analysis is based on a panel that contains 13 European Union countries: Bulgaria,
Croatia, Cyprus, Czech Republic, Estonia, Hungary, Latvia, Lithuania, Malta, Poland, Romania,
Slovak Republic and Slovenia. These countries are analysed between 2000 and 2017, based on data
available at the World Bank database. ROA and ROE capture data calculated from underlying
bank-by-bank unconsolidated data from Bankscope.
1039“Ovidius” University Annals, Economic Sciences Series
Volume XX, Issue 1 /2020
The regressors of the model, the explanatory variables used in our analysis are:
- GDP growth (annual %) [estimated effect: +]. This rate reflected the annual growth rate of
GDP, in percentage. GDP is the sum of gross value added by all resident producers in the economy
plus any product taxes and minus any subsidies not included in the value of the products. It is
calculated without making deductions for depreciation of fabricated assets or for depletion and
degradation of natural resources.
- Inflation, consumer prices (annual %) [estimated effect: +]. Inflation as measured by the
consumer price index reflects the annual percentage change in the cost to the average consumer of
acquiring a basket of goods and services that may be fixed or changed at specified intervals, such
as yearly. The Laspeyres formula is generally used.
- Loan_deposits represents the bank credit to bank deposits (%) [estimated effect: -].
- Capital_assets represents the bank capital to total assets (%) [estimated effect: +]. The
indicator is calculated as total assets devided by bank capital and reserves.
Note that due to differences in national accounting, taxation, and supervisory regimes, these
data are not strictly comparable across countries.
These indicators were determined using annual data extracted from the World Bank databases.
Table no. 1 Descriptive statistics for ROE model
ROE GDP_growth Inflation Loans_deposits
N - observations 234 234 234 230
Mean 11.34549 3.313966 3.54963 103.8453
Std. Dev. 16.30376 3.961991 4.735478 34.62069
Min -112.194 -14.81416 -2.096998 36.9543
Max 41.1201 11.8881 45.6666 257.322
Source: Authors’ calculations
Table no. 2 Descriptive statistics for ROA model
ROA GDP_growth Inflation Loans_deposits Capital_assets
N - observations 234 234 234 230 195
Mean 1.144684 3.313966 3.54963 103.8453 9.200826
Std. Dev. 1.600079 3.961991 4.735478 34.62069 2.263662
Min -9.98453 -14.81416 -2.096998 36.9543 4.6
Max 4.69987 11.8881 45.6666 257.322 15.3
Source: Authors’ calculations
The first step in methodology was to check the stationarity of the variables in the Panel
Regression Model with Fisher Test. The estimates are run through OLS panel data method with
robust standard errors, consistent with panel-specific autocorrelation and heteroskedasticity. The
impact of independent variables on ROE Return on equity or ROA Return on assets is examined on
the annual basis through the following baseline models specification.
ROE model
ROE = β 0 + β 1 ×GDP_growth i,t + β 2 ×Inflation i,t + β 3 ×Loans_deposits i,t + ε i,t
(1)
ROA model
ROA = β 0 + β 1 ×GDP_growth i,t + β 2 ×Inflation i,t + β 3 ×Loans_deposits i,t +
β 4 ×Capital_assets i,t + ε i,t (2)
where GDP_growth i,t is GDP growth (annual %), Inflation i,t denotes consumer prices (annual
%), Loan_deposits i,t represents the bank credit to bank deposits (%), and Capital_assets i,t
represents the bank capital to total assets (for country i in year t). ε ij,t is an iid error term specific to
country i in year t.
1040“Ovidius” University Annals, Economic Sciences Series
Volume XX, Issue 1 /2020
We have performed the regression based on the variables which were included into the model
and we have examined the results. In the ROE model, the sample is comprised of 230 observations
and the expanatory index of the model, which consists in the R-squared, is at the medium level of
26,97%. The independent variables explains 26,97% of the variation of ROE.
Table no. 3 Empirical results for ROE model
Number of obs = 230
F (3,226) = 10.15
Prob > F = 0.0000
R-squared = 0.2697
Root MSE = 13.079
ROE Coef. Robust t P>|t| [95% Conf. Interval]
Std. Err.
GDP_growth 1.872256 0.3894322 4.81 0.000 1.104873 2.639638
Inflation 0.4349585 0.1639997 2.65 0.009 0.1117945 0.7581225
Loans_deposits -0.0583938 0.0249947 -2.34 0.020 -0.1076462 -0.0091414
_cons 10.00094 2.502334 4.00 0.000 5.070054 14.93184
Source: Authors’ calculations
In the ROA model, the sample is comprised of 191 observations and the expanatory index of the
model, which consists in the R-squared, is at the medium level of 30,15%. The independent
variables explains 30,15% of the variation of ROE.
Table no. 4 Empirical results for ROA model
Number of obs = 191
F (4,186) = 7.76
Prob > F = 0.0000
R-squared = 0.3015
Root MSE = 1.1217
ROE Coef. Robust t P>|t| [95% Conf. Interval]
Std. Err.
GDP_growth 0.1491147 0.0337115 4.42 0.000 0.0826086 0.2156208
Inflation 0.1132742 0.0274375 4.13 0.000 0.0591455 0.1674029
Loans_deposits -0.0062575 0.0022025 -2.84 0.005 -0.0106026 -0.0019125
Capital_assets 0.0914541 0.0370667 2.47 0.015 0.0183289 0.1645794
_cons 0.1967393 0.4406902 0.45 0.656 -0.6726545 1.066133
Source: Authors’ calculations
Tables no. 5 and 6 present the correlation matrix for the variables. There aren’t correlations
bigger than 0.5 between regressors and all variables used.
Table no. 5 Correlation matrix ROE model
ROE GDP_growth Inflation Loans_deposits
ROE 1
GDP_growth 0.4817 1
Inflation 0.1943 0.1077 1
Loans_deposits -0.2138 -0.1581 -0.0757 1
Source: Authors’ calculations
1041“Ovidius” University Annals, Economic Sciences Series
Volume XX, Issue 1 /2020
Table no. 6 Correlation matrix ROA model
ROE GDP_growth Inflation Loans_deposits Capital_assets
ROE 1
GDP_growth 0.4673 1
Inflation 0.2535 0.1375 1
Loans_deposits -0.1663 -0.1289 0.1894 1
Capital_assets 0.0856 -0.0617 -0.1432 0.0570 1
Source: Authors’ calculations
All variables used in our paper were stationary.
Table no. 7 Fisher-ADF unit root tests – ROE model
Fisher-ADF unit root tests
Inv. chi- Inv.N Inv.L M.Inv chi-
squared squared
ROE 109.9035 -7.7603 -8.4213 11.6353
[0.000] [0.000] [0.000] [0.000]
GDP_growth 123.8182 -8.4324 -9.4964 13.5649
[0.000] [0.000] [0.000] [0.000]
Inflation 123.9812 -8.2506 -9.4850 13.5875
[0.000] [0.000] [0.000] [0.000]
Loans_deposits 65.6676 -4.5081 -4.6588 5.5009
[0.000] [0.000] [0.000] [0.000]
Source: Authors’ calculations
Table no. 8 Fisher-ADF unit root tests – ROA model
Fisher-ADF unit root tests
Inv. chi- Inv.N Inv.L M.Inv chi-
squared squared
ROA 107.6569 -7.6502 -8.2490 11.3238
[0.000] [0.000] [0.000] [0.000]
GDP_growth 123.8182 -8.4324 -9.4964 13.5649
[0.000] [0.000] [0.000] [0.000]
Inflation 123.9812 -8.2506 -9.4850 13.5875
[0.000] [0.000] [0.000] [0.000]
Loans_deposits 65.6676 -4.5081 -4.6588 5.5009
[0.000] [0.000] [0.000] [0.000]
Capital_assets 89.9586 -6.3493 -6.7670 8.8695
[0.000] [0.000] [0.000] [0.000]
Source: Authors’ calculations
Note: Fisher-ADF tests with drift, one lag and cross-sectional means removed. Its null hypothesis
states that all panels contain unit roots, with the alternative that at least one panel is stationary. In
table are reported the statistics and p-values for the following Fisher tests: inverse chi-squared,
inverse normal, inverse logit and modified inverse chi-squared.
4. Results
All the variables are significant at the 5% level in the regression (ROE and ROA models) with
the expected sign. The determination coefficient shows that an important variation of banks’
profitability (measured by ROE and ROA) is explained by the analyzed variables.
1042“Ovidius” University Annals, Economic Sciences Series
Volume XX, Issue 1 /2020
Table no. 9 Determinants of ROE and ROA
(1) (1)
Variables ROE VARIABLES ROA_b
GDP_growth 1.872*** GDP_growth 0.149***
(0.389) (0.0337)
Inflation 0.435*** Inflation 0.113***
(0.164) (0.0274)
loan_deposits -0.0584** loan_deposits -0.00626***
(0.0250) (0.00220)
Constant 10.00*** Capital_assets 0.0915**
(2.502) (0.0371)
Constant 0.197
Observations 230 (0.441)
R-squared 0.270
Robust standard errors in parentheses Observations 191
*** pYou can also read