Inferring High Spatiotemporal Air Quality Index - A Study in Bangkok - A Study in ...
←
→
Page content transcription
If your browser does not render page correctly, please read the page content below
Inferring High Spatiotemporal Air Quality Index
                   - A Study in Bangkok

                     Muhammad Rizal Khaefi and Sriganesh Lokanathan
                                United Nations Global Pulse
                                Pulse Lab Jakarta, Indonesia
                    {muhammad.khaefi,sriganesh.lokanathan}@un.or.id

                                             Abstract
         Robust estimates of human exposure to inhaled air pollutants are necessary for
         a realistic appraisal of the risks these pollutants pose, and for the design and
         implementation of strategies to control and limit those risks. However, these
         tasks are challenging in Bangkok due to few number of official air quality sensors
         and huge city administrative areas. This research couples data from government
         official air quality sensors with multiple data sources from ride-hailing, satellite
         measurement, transportation, official statistics, and meteorological information
         to infers daily air quality index in three months sample of high, normal, and low
         seasons for whole Bangkok city at 1km x 1km spatial resolution. The best model
         shows 0.6 r2 performance using a Land Use Regression (LUR) approach.

1     Introduction
In recent years, Southeast Asia cities such as Bangkok are rapidly expanding. This growth has
not been aligned properly with Bangkok’s land use and transport planning strategy, resulting in
uncontrolled traffic growth and over reliance on private motorized vehicles. This unsustainable
approach has increased air pollution affecting the lives of millions of Bangkok’s residents [1]. It is
critical for public authorities to have timely and accurate information about affected populations.
However, few numbers and small coverage area of official sensors in Bangkok makes it problematic
to do.
This study directly tackles one of the most important environmental and public health issues affecting
Bangkok and numbers of big city in developing countries. In the context of Bangkok, our preliminary
work explored the use of AI techniques on data from multiple sources including, amongst others,
satellite imagery and traffic congestion estimates from ride-hailing data to infer daily air quality
index at higher spatio-temporal resolution. Our works also taking account of the Bangkok air quality
conditions on various seasons, i.e. high, normal, and low seasons.

1.1   Methodology

1.2   Data

We use over 4 billion measurements of anonymous Grab driver’s trajectory datasets collected in
December 2018 and from March 2019 to April 2019 to capture the different patterns between common
days and uncommon days. To represent uncommon days, we select days during Songkran Festival,
the Thai New Year’s national holiday on the 13th April every year and can be extended to 15th April
or more. The trajectory data is reported at a 30-s interval, including real-time information such as
longitude and latitude (including altitude), instantaneous speed, moving direction (360 degrees), and
timestamp.

34th ML4D Workshop at Conference on Neural Information Processing Systems (NeurIPS 2020), Vancouver,
Canada.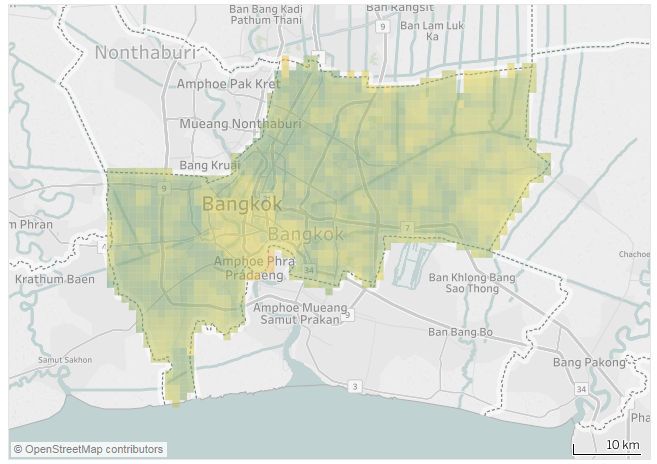
The Office of Transport and Traffic Policy Planning of the Government of Thailand (OTP) gave
transportation related data, such as digitized road network of Bangkok with additional information
like road name, segment, and type. Pollution Control Department of Government of Thailand (PCD)
provided historical daily air quality index data collected from official ground air quality sensors
in Bangkok. In addition, we used open access data to collect environment and socio-demography
insights from US National Aeronautics and Space Agency (NASA), Worldpop, US Geological Survey
Agency (USGS), and US National Oceanic and Atmospheric Administration (NOAA).
Lists of data used on this study are listed below:
1. Daily air quality index from PCD
2. Daily traffic Congestion per road segment (Historical anonymized Grab drivers trajectory
and official road shapefile used to calculate congestion level by using method defined in [2])
3. Main road from OTP
4. Daily Aerosol Optical Depth (AOD) at 047 and 055 micron from NASA
5. Open/Green spaces
• Enhanced Vegetation Indeces from NASA
• Normalized Difference Vegetation Indeces from NASA
6. Digital Elevation Model from USGS
7. Daily Air temperature from NOAA
8. Population density from Worldpop
9. Various shapefile data like Bangkok Administrative Boundary from Bangkok Government
1.3 Preprocessing and Feature extraction
Based on Bangkok Metropolitan administrative boundary, a reference grid cells of 1km x 1km are
created. For each predictors (congestion, main road, AOD, open spaces, etc), a spatial and temporal
aggregation performed by calculating daily predictors observation inside grid.
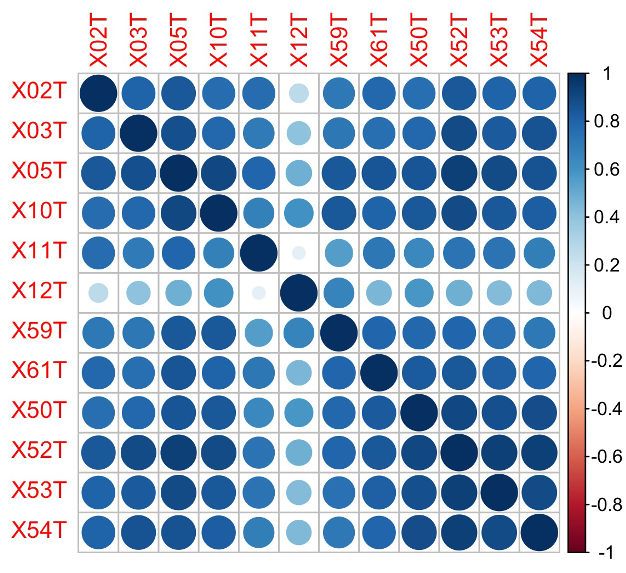
AQI data are investigated to assess quality of its measurements. Correlation analysis are conducted
for each ground sensor sites. Ground sensor site with low correlation score (r ≤ 0.2) is removed
from next iteration. Land use regression [3-4] is then performed by using the following steps.
First, model to infers daily AQI relationship with available predictors (referred as type 1) and
additional data are developed by creating training data set with observations consist of AQI and type
1 predictors at a grid cell. A tree ensemble model [5] developed in the form of additive functions,
which describe relations between AQI with predictors. To find an optimal model, a combination of
bayesian hyperparameter tuning [6], feature selection based on Gini index, and a stratified 10-fold
cross validation are explored.
Second, missing daily AQI in grid cell with available predictors measurements (referred as type 2) is
predicted by using developed model. Missing AQI in grid cell where predictors data not complete for
specific day inferred by measuring association of grid cells AQI values with AQI located elsewhere
and in the neighboring grid cells using universal Kriging Model with smoothing function.
To measure the goodness of fit, leave-one-out cross-validation performed by dropped ’all observations’
of a sensors site from the datasets and reserved it as a true held-out set. This process was repeated for
each sensors site and r2 values were computed.
2 Results
On the pre-processing step, we found one suspect of outlier sensors, the X12T site as shown in Figure
1a. It scores lowest correlation coefficient compared with nearest sensors and therefore excluded
from the next iteration.
The next step is to divide Bangkok boundaries into a grid of 1km x 1km grid followed by development
of the tree ensemble model trained from ground truth and features from predictors. From the best
model, the location where there is no ground sensors but complete predictors could be inferred. The
2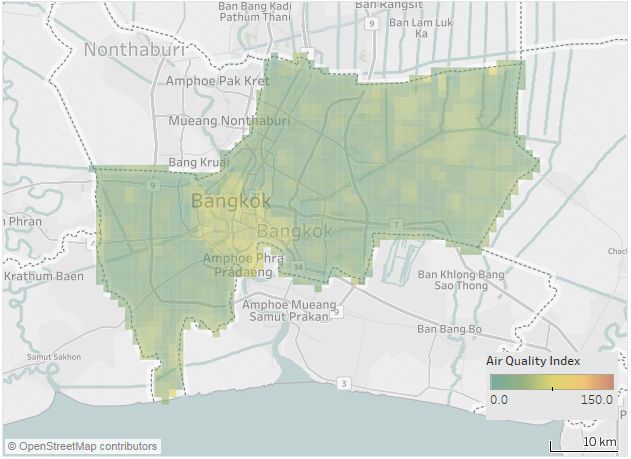
(a) Correlation matrix for AQI ground sensor   (b) Actual vs Predicted AQI level (r2 = 0.6)
    sites

                               (c) Kernel Density plot of Actual vs Predicted
                               AQI
                          Figure 1: Preprocessing and Model Performance

last step then extrapolation process to predict AQI where there are missing predictors. Figure 1b
shows performance of our model, the best model achieved 0.6 r2 scores and also it can be seen from
Figure 1c that the model can captures well the overall density distribution of actual AQI but may a bit
misestimate it.
From the aforementioned processes, daily 1km x 1km AQI from whole Bangkok could be inferred
as seen in Figure 2. It can be observed there is difference between different time seasonality, the
highest AQI are observed during peak season (aqi   ¯ = 74.5), followed by normal (aqi   ¯ = 54.9) and
low season (aqi¯ = 41.8). Inferred AQI from our model are also able to give complete situational
awareness for example by calculating spatio and temporal aggregation by using districts boundary to
create districts AQI statistics. As shown in Table 1, the top-5 districts experienced highest daily AQI
are well matched with actual populous and busy districts in Bangkok. Different patterns that captured
during different seasons also shows temporal air quality variations in Bangkok’s districts that inferred
by the model.

3   Reflection and Further Work

While this work is preliminary, it shows that combining alternate data sources with new techniques
has the potential to tackle one of the important problems in Bangkok and developing cities in global
south. Future work needs to have more ground truth validation data, which will also better help
calibrate the model. Improving robustness of the model also need to be noted in particular to explore
more advanced algorithms and include other data sources, such as traffic counting, hourly air quality
measurement, land use, and on-the-field observation.

                                                     3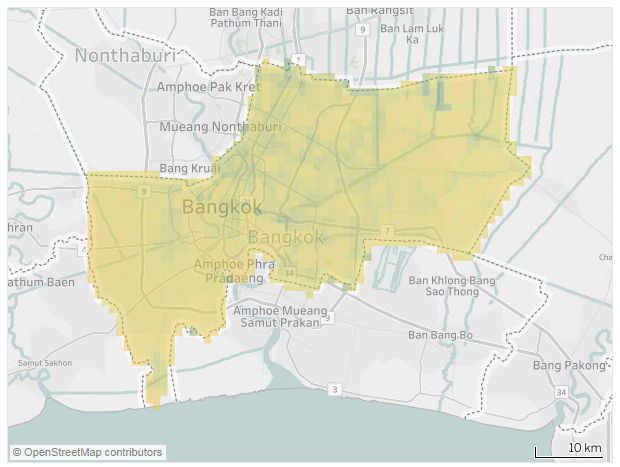
(a) December 2018 (Peak Season)                     (b) March 2019 (Normal Season)

                                         (c) April 2019 (Low Season)
                Figure 2: Visualization of Bangkok’s AQI inference using best model

 Districts        µ (mean)     σ (sd)    Districts         µ (mean)   σ (sd)   Districts        µ (mean)     σ (sd)
 Bangkok Noi         89          8       Yan Nawa             75       12      Phra Nakhon         62         11
 Nong Khaem          89          5       Khlong San           74        5      Yan Nawa            62         10
 Bangkok Yai         88          5       Sathon               71        7      Ratchathewi         61          8
 Tung Khru           87          5       Ratchathewi          70        6      Pom Prap S.P.       60          5
 Yan Nawa            87         12       Pathum Wan           69        4      Pathum Wan          60          7
(a) December 2018 (Peak Season)         (b) March 2019 (Normal Season)         (c) April 2019 (Low Season)
                          Table 1: Top 5 highest daily AQI level by Districts

References

[1] Phosri, A. et.al. (2019) Effects of ambient air pollution on daily hospital admissions for respiratory and
cardiovascular diseases in Bangkok, Thailand. Science of The Total Environment 651(15):1144-1153.
[2] Christidis, P. & Rivas, N.I. (2012) “Measuring road congestion. Institute for Prospective Technological
Studies, European Commission Joint Research Centre.
[3] Kloog, I. et.al. (2011) Assessing temporally and spatially resolved pm2.5 exposures for epidemiological
studies using satellite aerosol optical depth measurements. Atmospheric Environment 45(35):6267–6275.
[4] Kloog, I. et.al. (2012) Incorporating local land use regression and satellite aerosol optical depth in a
hybrid model of spatiotemporal pm2.5 exposures in the mid-atlantic states. Environmental Science Technology
46(21):11913–11921.
[5] Chen, T. and Guestrin, G. (2016) Xgboost: A scalable tree boosting system. Proceedings of the 22Nd ACM
SIGKDD International Conference on Knowledge Discovery and Data Mining, ser. KDD ’16 pp.785–794.
[6] Komer, B. Bergstra, J. and Eliasmith, C. (2014) Hyperopt-Sklearn: automatic hyperparameter configuration
for Scikit-learn. Proceedings of the 13th Python in Science Conference pp.32-37.

                                                       4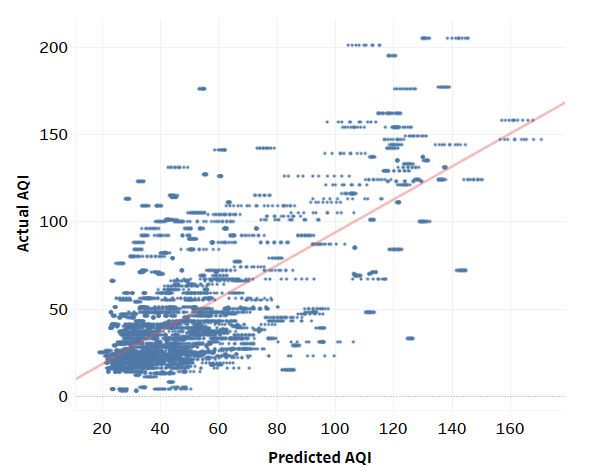
You can also read