Recovery Signals Digest - A Roundup of Travel Recovery Insights August 3, 2021 - Tourism Nova Scotia
←
→
Page content transcription
If your browser does not render page correctly, please read the page content below
COVID-19

  Recovery
Signals Digest
      A Roundup of
 Travel Recovery Insights

                            August 3, 2021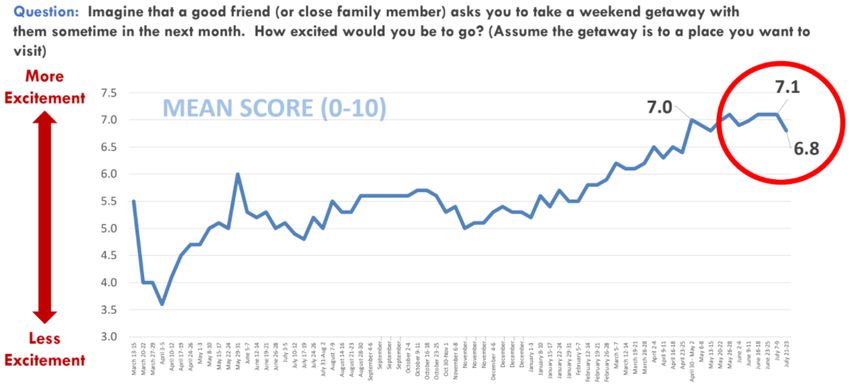
Contents:
• Introduction                                             Page 3

• Source Notes and Methodology                             Page 4

• Summary                                                  Page 6

• Google Destination Insights                              Page 8

• Statistics Canada: Canadian Tourism Activity Index       Page 12

• Statistics Canada: International Travel, May 2021        Page 15

• Environics Weekly Visitation Tracker                     Page 17

• Destination Canada Travel Recovery Assessment            Page 22

• Destination Canada Resident Sentiment Survey             Page 25

• Government of Canada COVID-19 Status                     Page 35

• Destination Analysts American Travel Sentiment Tracker   Page 44
                                                                     2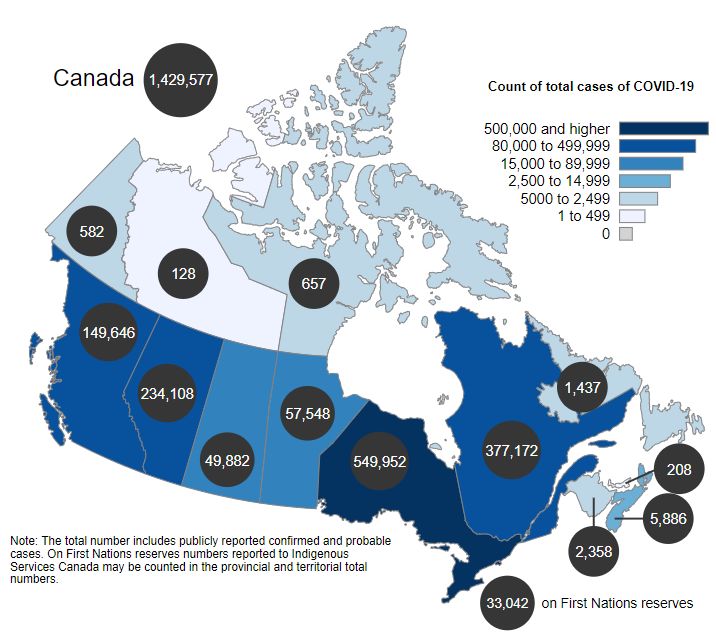
Introduction
The Recovery Signals Digest is a bi-weekly overview of travel recovery indicators
compiled by Tourism Nova Scotia.

The report provides timely insights for Nova Scotia’s tourism industry about factors
that influence travel recovery including cases of
COVID-19 in Canada and internationally, vaccinations, visitation and travel
intentions.

If you have questions about the Recovery Signals Digest, please contact us at:
tourismresearch@novascotia.ca

                                                                                       3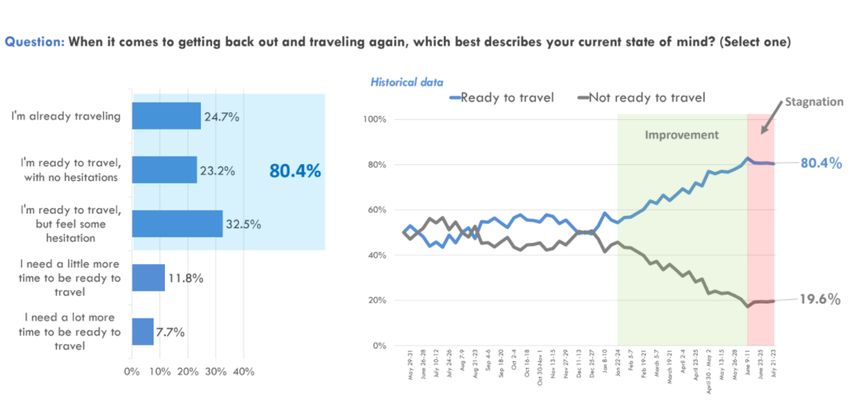
Source Notes and Methodology
•   Google is a US-based online search engine. Its Destination Insights (Destination
    Insights with Google ) is a free public tool that uses Google search data for flights
    and accommodations as way of interpreting travel demand in particular
    destinations.

•   Statistics Canada (www.statcan.gc.ca) is the national statistical office. Its
    international arrivals data is sourced from the Canada Border Services Agency and
    from land ports equipped with the automated Integrated Primary Inspection Line
    system. It’s Canadian Tourism Activity Tracker combines data from multiple sources
    including counts of international travellers, commercial aircraft movements, hotel
    occupancy rates, restaurant sales and reservation bookings.

•   Environics Analytics (https://environicsanalytics.com/) is a North American
    marketing information company. Its Weekly Tracker measures weekly domestic
    overnight visitation in Canada, using location data from mobile devices, sourced via
    privacy compliant third-party mobile data providers.

                                                                                            4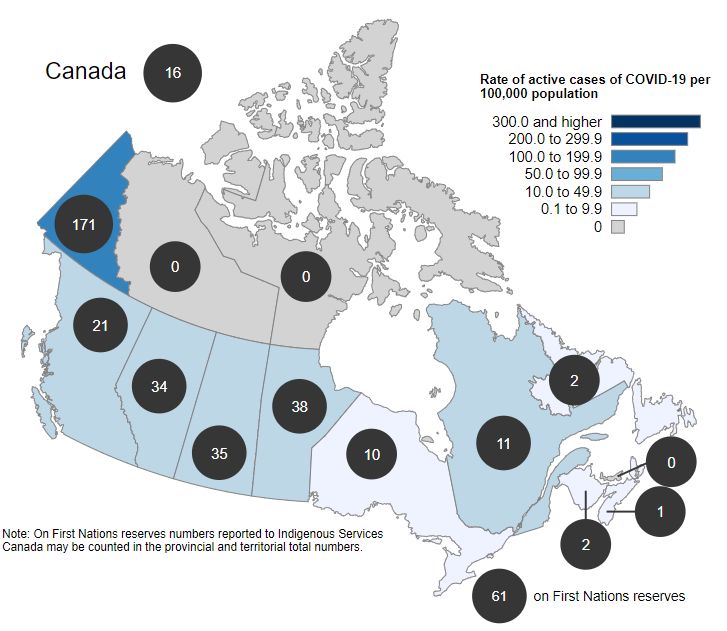
Source Notes and Methodology
•   Destination Canada (www.destinationcanada.com/) is a federal Crown corporation
    and Canada’s national tourism marketing organization. Its Travel Recovery
    Assessment is based on analysis of research by Destination Canada and third-
    party sources. Its Resident Sentiment survey is a weekly online poll of 1,800
    residents, with some questions alternating bi-weekly. The data is weighted to be
    reflective of the Canadian population.

•   The Government of Canada’s COVID-19 data (COVID-19 daily epidemiology
    update - Canada.ca) is updated from sources including the Public Health Agency of
    Canada and provincial and territorial partners.

•   Destination Analysts (www.destinationanalysts.com) is a San Francisco-based
    tourism market research firm. Its American Travel Trends & Sentiment report is
    based on an independent, weekly survey of 1,200 American travellers. The survey
    was launched in the wake of the COVID-19 pandemic and has been conducted
    every week since March 15, 2020.

                                                                                        5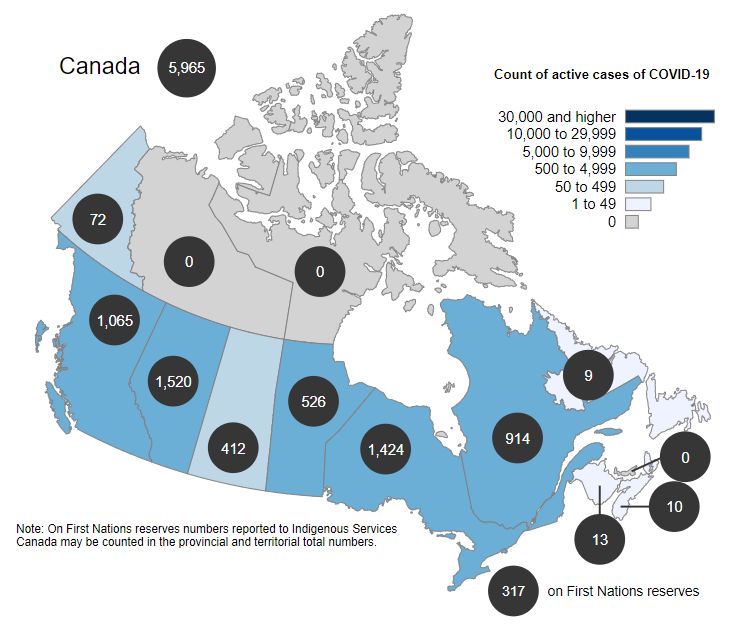
Summary
•   Halifax was the 8th most popular destination city among Canadians
    searching online for city flights and accommodations from late June to late
    July, according to Google’s new Destination Insights report.

•   Overall tourism activity in Nova Scotia in May 2021 was 78% below the level
    in May 2019, before the impact of the pandemic. Nova Scotia’s tourism decline
    in May was worse than the Canadian average (69% below May 2019 levels)
    and was the largest relative decline among all provinces, as measured by
    Statistics Canada’s Tourism Activity Index.

•   Trips to Canada by travellers from other countries were down in May from the
    previous month, while international travel by Canadians was up, according to
    Statistics Canada. Overall, travel between Canada and other countries
    remained significantly lower than at the same time in 2019.

•   Overnight visitation to Nova Scotia in mid July was up 16% over the
    previous week (WoW), and up 21% compared with the same week the
    previous year (YoY), according to Environics’ Weekly Tracker of mobile data
    movements.

                                                                                    6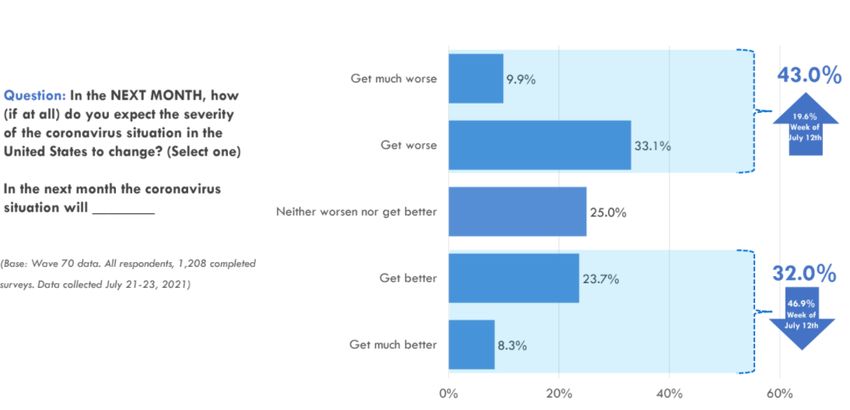
•   Nova Scotia remains one of only three Canadian provinces, along with PEI
    and Newfoundland and Labrador, in the Intra-provincial phase of recovery,
    according to the latest Destination Canada Travel Recovery Assessment. All
    other provinces and territories are now in the more advanced Inter-provincial
    phase.

•   More than half of Canadians in all regions now feel safe travelling to other
    provinces in the country, including two-thirds of Ontarians who feel safe
    doing so, according to Destination Canada’s latest Resident Sentiment survey.

•   The federal government reports that the number of active COVID-19 cases
    in Canada is increasing, with almost 6,000 cases as of July 29. Nationally,
    the rate of active cases on July 29 stood at 16 cases per 100,000 people, up
    from 12 per 100,000 in mid-July. In Nova Scotia, the rate was 1 per 100,000 on
    July 29.

•   Destination Analysts is warning of plummeting optimism among US
    travellers about the future of the pandemic, along with stagnating or
    declining metrics on a range of traveller sentiment measures, largely due to
    the spread of the Delta COVID-19 variant.

                                                                                     7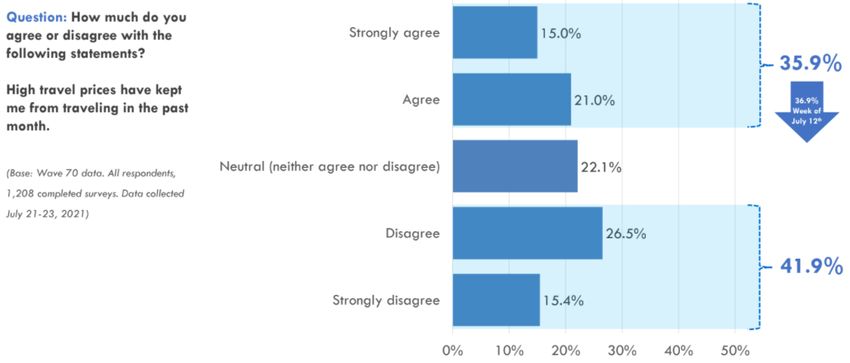
Google Destination Insights
As of July 20, 2021

                              8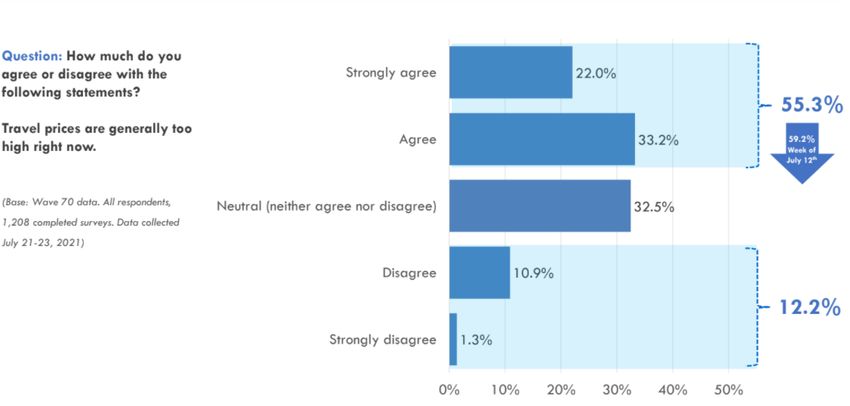
Google Destination Insights: 30-Day
Demand for Canada as a Destination
•   Domestic travel demand (Google searches by Canadians for flights and accommodation) for trips
    within Canada. June 20 – July 20, 2021. Demand is scored by search volume on an index of 0-100.

•   International travel demand (Google searches worldwide for flights and accommodation) for trips to
    Canada. June 20 – July 20, 2021. Demand is scored by search volume on an index of 0-100.

                                                                                                         9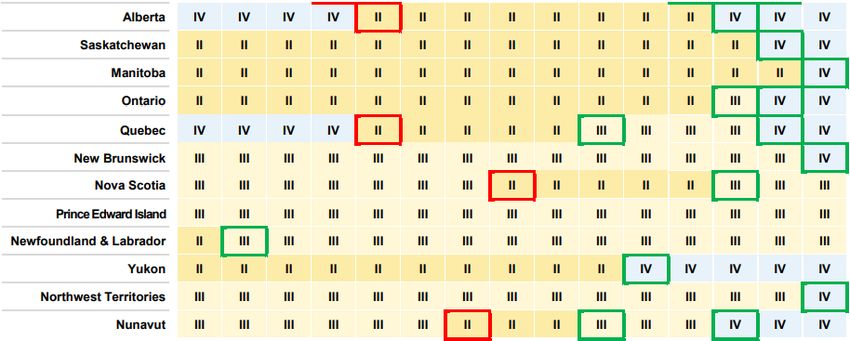
Google Destination Insights: 30-Day
Domestic Demand by Destination City
Cities are scored on an index of 0-100, based   Growth is the % change in domestic Google
on domestic Google search demand by             travel search demand in the period June 20 –
Canadians between June 20 – July 20, 2021       July 20, 2021 compared to the previous 30-
for flights to, and accommodations in           day period.
Canadian cities.

                                                                                               10
Google Destination Insights: 30-Day
International Demand by Origin Country
• Top sources of worldwide search demand for international travel to Canada. Search period: June
20 – July 20, 2021. Countries are scored by search volume, on an index of 0-100.
11Statistics Canada:
Canadian Tourism
Activity Index
Updated to May 2021
12Statistics Canada: Tourism Activity
Index – Canada
• The index shows the relative performance of aggregated tourism activity in Canada (i.e., arrivals,
departures, spending etc.) over time. The base period – with an index measure of ‘0’ – is 2019
• In May 2021, combined tourism activity in Canada was 69% below the level in May 2019, a
larger decrease compared with April (-66%).
13Statistics Canada: Tourism Activity
Index – Nova Scotia
• The index shows the relative performance of aggregated tourism activity in Nova Scotia (i.e., arrivals,
departures, spending etc.) over time. The base period – with an index measure of ‘0’ – is 2019
• In May 2021, combined tourism activity in Nova Scotia was 78% below the level in May 2019. This
was higher than the overall Canadian decline (69%) and the largest such decline among all provinces.
14Statistics Canada:
Travel Between Canada
and Other Countries –
May 2021
Released July 21, 2021
15Statistics Canada: Travel Between
Canada and Other Countries
• Trips to Canada by travellers from other countries were down more than 18% in May from
the previous month, and down 96% from pre-pandemic levels in May 2019.
• Trips to other countries by Canadians were up 11% in May from the previous month, but
down 92% from pre-pandemic levels in May 2019.
16Environics Analytics
Weekly Visitation Tracker
17Environics Weekly Tracker –
Number of Visitors to Nova Scotia vs 2019
• Data reflects number of overnight visitors to Nova Scotia. The Weekly Tracker uses data based on mobile
phone movements (60+ kilometers overnight travel), which may differ from other visitation estimates.
• About 135,000 overnight visitors came to Nova Scotia the week of July 12, 2021, down from about
182,000 the same week in 2019.
18Environics Weekly Tracker –
Number of Visitors to Nova Scotia vs 2020
• Data reflects number of overnight visitors to Nova Scotia. The Weekly Tracker uses data based on mobile
phone movements (60+ kilometers overnight travel), which may differ from other visitation estimates.
• About 135,000 overnight visitors came to Nova Scotia the week of July 12, 2021, up from about
112,000 the same week in 2020.
19Environics Weekly Tracker – Week Over
Week Change, Nova Scotia
• Data reflects number of overnight visitors to Nova Scotia. The Weekly Tracker uses data based on
mobile phone movements (60+ kilometers overnight travel), which may differ from other visitation
estimates.
• The week of July 12, 2021, overnight visitation to Nova Scotia was up 16% over the previous week
(WoW). In comparison, national weekly overnight visitation was up 3% WoW.
20Environics Weekly Tracker – Year Over
Year Change, Nova Scotia
• Data reflects number of overnight visitors to Nova Scotia. The Weekly Tracker uses data based on
mobile phone movements (60+ kilometers overnight travel), which may differ from other visitation
estimates.
• The week of July 12, 2021, overnight visitation to Nova Scotia was up 21% over the same week the
previous year (YoY). In comparison, national weekly overnight visitation was up 12% YoY.
21Destination Canada: Travel
Recovery Assessment
22Destination Canada Provincial Travel
Recovery Assessment
Timeline of overall assessment for each province and territory:
Legend:
23Definitions:
According to Destination Canada’s travel sentiment data, as of July 4:
• All but three provinces and territories are now in the Inter-provincial (IV) phase of
recovery.
• Nova Scotia, Prince Edward Island and Newfoundland and Labrador remain in the Intra-
provincial (III) phase.
24Destination Canada:
Resident Sentiment Survey
Updated July 26, 2021
25Destination Canada Resident Sentiment –
Safety of Travel
• ‘I feel safe to travel to…’
REGION OF RESIDENCE ATLANTIC CANADA
BC AB SK / MB ON QC ATL Rural Urban
Communities near me 92 88 88 85 84 95 98 93
Communities in my province 86 87 83 78 86 93 91 96
Other provinces in Canada 63 79 76 65 67 63 56 67
The United States 24 42 35 27 36 16 16 16
Other countries 24 36 29 23 31 22 17 25
SAMPLE SIZE 203 204 200 605 407 200 127 71
• % Somewhat / Strongly Agree
• Note: red/green text indicates a significant difference between regions.
• Results from week of July 26 2021.
Source: Destination Canada Weekly COVID-19 Resident Sentiment, 2021-07-26Destination Canada Resident Sentiment –
Safety of Travel
• A large majority of Canadians report feeling safe travelling to nearby communities and
elsewhere in their own provinces. Meanwhile, relatively few feel safe travelling
internationally.
• Well over half of Canadians in all regions now feel safe travelling to other provinces,
including two-thirds of Ontarians who feel safe doing so. This is the first measurement
period where a majority of Atlantic Canadians report feeling safe travelling elsewhere in the
country.
• Atlantic Canadians’ feelings of safety travelling within their province remain among the
highest in the country, while for international travel are the lowest in the country, particularly
for travel to the United States.
Source: Destination Canada Weekly COVID-19 Resident Sentiment, 2021-07-26Destination Canada Resident Sentiment –
Safety of Travel, NS vs Rest of Atlantic
Sep15
Sep28
Oct06
Oct13
Oct20
Oct27
Nov03
Nov10
Nov17
Nov24
Dec01
Dec08
Jan05
Jan12
Jan19
Jan26
Feb02
Feb09
Feb16
Feb23
Mar02
Mar09
Mar23
Apr06
Apr20
Apr27
May04
May18
Jun01
Jun15
Jun22
Jul06
Jul13
Jul26
NS: Nearby comms NS: Other comms NS: Other provs AC: Nearby comms AC: Other comms AC: Other provs
• For both Nova Scotians and Atlantic Canadians, the gap in safety sentiment between travel within one’s
home province and travel to other provinces has been shrinking steadily throughout the summer.
Source: Destination Canada Weekly COVID-19 Resident Sentiment, 2021-07-26Destination Canada Resident Sentiment –
Welcoming Visitors
• ‘I would welcome visitors travelling to my community from …’
REGION OF RESIDENCE ATLANTIC CANADA
BC AB SK / MB ON QC ATL Rural Urban
Other communities near me 83 81 83 70 73 90 89 93
Other parts of my province 80 81 80 65 75 88 87 91
Other parts of Canada 62 74 67 57 65 66 64 69
The United States 25 38 33 25 36 24 22 25
Other countries 22 32 32 19 29 24 24 23
SAMPLE SIZE 203 204 200 605 407 200 127 71
• % Somewhat / Strongly Agree
• Note: red/green text indicates a significant difference between regions.
• Results from week of July 26 2021.
Source: Destination Canada Weekly COVID-19 Resident Sentiment, 2021-07-26Destination Canada Resident Sentiment –
Welcoming Visitors, Among Nova Scotians
Jun02
Jun09
Jun16
Jun23
Jun30
Jul07
Jul14
Jul21
Jul28
Aug04
Aug11
Aug18
Aug25
Sep01
Sep28
Oct13
Oct27
Nov10
Nov24
Dec08
Jan05
Jan19
Feb02
Feb16
Mar02
Mar23
Apr20
May04
May18
Jun01
Jun15
Jul13
Jul26
Communities near me Other parts of my province Other parts of Canada United States Other countries
• A large majority of Nova Scotians would welcome visitors from within their province, and increasingly this
extends to other Canadians, while few would welcome international visitors.
Source: Destination Canada Weekly COVID-19 Resident Sentiment, 2021-07-26Destination Canada Resident Sentiment –
Welcoming Visitors
• Canadians remain generally negative about welcoming international visitors, with Atlantic
Canadians being among the most negative in this regard.
• A majority of Canadians from all regions are now willing to welcome visitors from other parts
of the country.
Source: Destination Canada Weekly COVID-19 Resident Sentiment, 2021-07-26Destination Canada – Comfort With
Activities
• Respondents were asked: Once the governments lift the protective measures put in place to
fight COVID19, which of the following would you be comfortable doing…
• The overall percentage of activities that Canadians are comfortable with has been gradually
increasing over the course of 2021.
• Among those activities Canadians are least comfortable with, a large minority – more than 4
in 10 – now express comfort with flying on an airplane, attending large public gatherings,
going to bars and pubs, and travelling to the United States.
• Atlantic Canadians do not share other Canadians’ increasing willingness to travel to the US,
with only 23% of Atlantic residents, and 22% of Nova Scotia residents, expressing comfort
with such travel.
Source: Destination Canada Weekly COVID-19 Resident Sentiment, 2021-07-26Destination Canada – Comfort With
Activities (% Overall)
70
65
60
% of Activities
55
50
45
40
35
30
Jun23
Jun30
Jul07
Jul14
Jul21
Jul28
Aug04
Aug11
Aug18
Aug25
Sep01
Sep15
Sep28
Oct06
Oct13
Oct20
Oct27
Nov03
Nov10
Nov17
Nov24
Dec01
Dec08
Jan05
Jan12
Jan19
Jan26
Feb02
Feb09
Feb16
Feb23
Mar02
Mar09
Mar23
Apr06
Apr20
Apr27
May04
May18
Jun01
Jun15
Jun22
Jul06
Jul13
Jul26
Canada ATL NS
• Graph shows the overall % of activities respondents would be comfortable participating in, based on the
activities applicable to each respondent.
Source: Destination Canada Weekly COVID-19 Resident Sentiment, 2021-07-26Destination Canada – Comfort With
Activities, Most/Least Comfortable
Atlantic Nova
Activity Canada
Canada Scotia
Activities most comfortable with:
Allowing in-home renovations 87 91 91
Shopping at the mall 85 86 82
Going back to your workplace/office 81 90 82
Dining in restaurants 81 87 80
Activities least comfortable with:
Flying on an airplane 47 46 41
Large gatherings such as sporting events, concerts, or festivals 44 51 48
Going to bars, lounges, night clubs, pubs 44 52 53
Travelling to the United States 42 23 22
SAMPLE SIZE 1819 200 81
• % Comfortable with each activity, among applicable
• Results from week of July 26 2021.
Source: Destination Canada Weekly COVID-19 Resident Sentiment, 2021-07-26Government of Canada
COVID-19 Status
As of July 29, 2021
35Government of Canada – COVID-19
Count of Total Cases
• The count of total cases of COVID-19 in Canada was 1,429,577 as of July 29, 2021.
36Government of Canada – COVID-19
Count of Active Cases
• The count of active cases of COVID-19 in Canada was 5,965 as of July 29, 2021.
37Government of Canada – COVID-19
Rate of Active Cases
• The rate of active cases of COVID-19 in Canada was 16 per 100,000 population as of July
29, 2021.
38Government of Canada – COVID-19
Cases by Date
• Total COVID-19 cases in Canada (n=1,423,778) by date of illness onset, as of July
23, 2021.
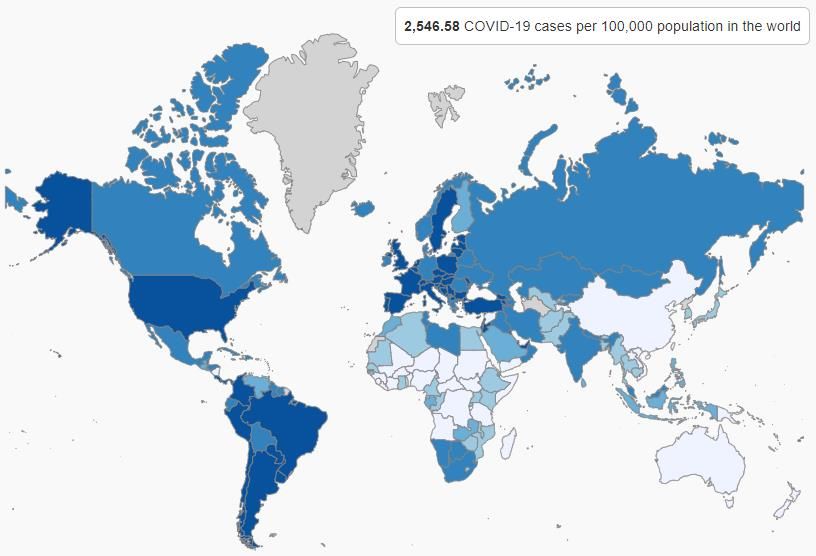
39Government of Canada – COVID-19
World Cases Per 100,000 People
40Government of Canada – Percentage
With At Least 1 Vaccine Dose
• The cumulative percent of the population who have received at least one dose of a COVID-
19 vaccine in Canada was 69.7% as of July 17, 2021.
41Government of Canada – Percentage
Fully Vaccinated
• The cumulative percent of the population fully vaccinated with a COVID-19 vaccine in
Canada was 50.2% as of July 10, 2021.
42Nova Scotia COVID-19 Cases
• The Province of Nova Scotia provides daily updates of new cases of
COVID-19, total active cases of COVID-19, and cumulate cases of
COVID-19, as well as doses of COVID-19 administered within the province.
• See the Province of Nova Scotia’s COVID-19 data dash board at:
https://novascotia.ca/coronavirus/data/#dashboard
43Destination Analysts
American Travel
Sentiment Tracker
Updated to July 26, 2021
44Destination Analysts: Rising US
Pessimism About Pandemic
• Destination Analysts: ‘Traveller sentiment has slipped into decline, with many metrics
declining in the last weeks.’ More than 4 in 10 American travellers expect the pandemic to
worsen in the next month – a doubling of such sentiment from mid-July.
45Destination Analysts: Rising US
Pessimism About Pandemic
• The percentage of American travellers who think the pandemic situation will get worse in the
next month (43%) is at its highest point since January 2021.
46Destination Analysts: Safety Sentiment
With Travel Activities Has Stalled
• Although one-half of US travellers feel safe participating in various types of travel activities,
such sentiment has stalled, and the share who feel unsafe appears to be on the rise.
47Destination Analysts: Travel State of Mind
Sentiment is Stagnating
• A large majority of US travellers are already travelling or feel ready to travel. The rapid rise
in travel readiness seen throughout 2021, however, has stalled.
48Destination Analysts: Excitement to Travel
Stalled
• Destination Analysts: As ‘optimism about the coronavirus situation in the US has plummeted
… this worsening expectation has impacted Americans’ excitement to travel right now.’
49Destination Analysts: Fear of Delta
Variant Impacting US Travel Plans
• One-quarter of US
travellers have
postponed trips
because of fears of
the Delta COVID-19
variant, while 2 in
10 have actually
cancelled trips for
that reason.
50Destination Analysts: US Travellers Agree
– Travel Prices Too High
• More than one-half of American travellers say that travel prices are too high.
51Destination Analysts: US Travellers Agree
– Travel Prices Too High
• Six in 10 American travellers say hotels and airline tickets are too high. Only a minority say
food and dining, and attractions and tours are too expensive.
52Destination Analysts: Prices Impacting
Decision to Travel
• More than one-third of US travellers say high prices have prevented them from travelling
in the past month.
53You can also read


