CUDA OPTIMIZATION WITH NVIDIA NSIGHT VISUAL STUDIO EDITION - CHRISTOPH ANGERER, NVIDIA JULIEN DEMOUTH, NVIDIA
←
→
Page content transcription
If your browser does not render page correctly, please read the page content below

CUDA OPTIMIZATION WITH
NVIDIA NSIGHT™ VISUAL STUDIO EDITION
     CHRISTOPH ANGERER, NVIDIA
     JULIEN DEMOUTH, NVIDIA
WHAT YOU WILL LEARN
 An iterative method to optimize your GPU code

 A way to conduct that method with NVIDIA Nsight VSE

 Companion Code: https://github.com/chmaruni/nsight-gtc2015
INTRODUCING THE APPLICATION

             Grayscale

                         Blur

                Edges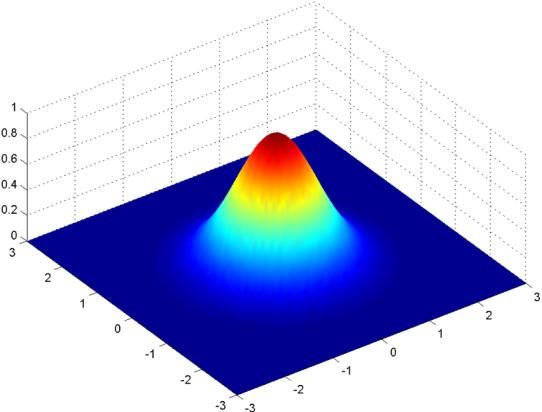
INTRODUCING THE APPLICATION
Grayscale Conversion
               // r, g, b: Red, green, blue components of the pixel p
               foreach pixel p:
                 p = 0.298839f*r + 0.586811f*g + 0.114350f*b;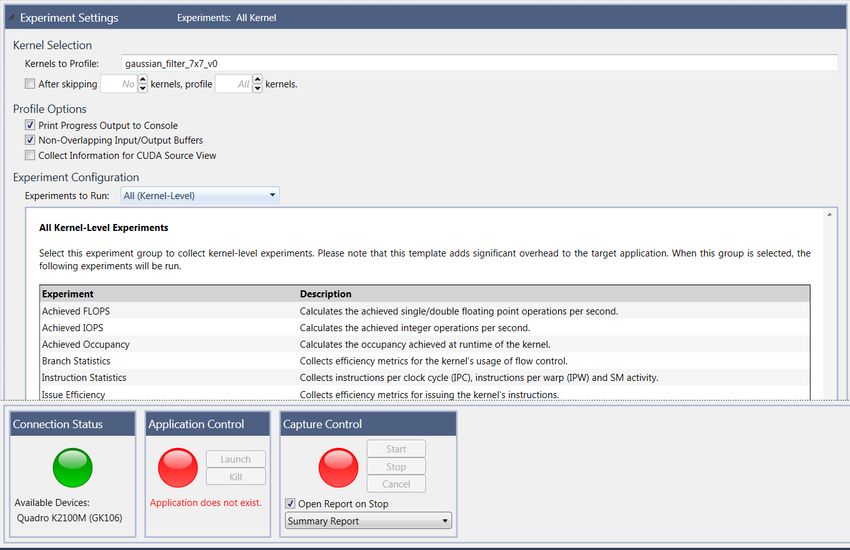
INTRODUCING THE APPLICATION

Blur: 7x7 Gaussian Filter
                             foreach pixel p:
                               p = weighted sum of p and its 48 neighbors
 1   2   3   4   3   2   1
 2   4   6   8   6   4   2
 3   6   9 12 9      6   3
 4   8 12 16 12 8        4
 3   6   9 12 9      6   3
 2   4   6   8   6   4   2
 1   2   3   4   3   2   1

                                               Image from Wikipedia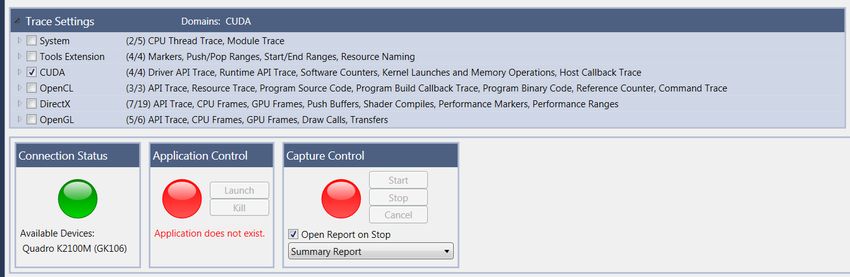
INTRODUCING THE APPLICATION
Edges: 3x3 Sobel Filters
                    foreach pixel p:
                      Gx = weighted sum of p and its 8 neighbors
                      Gy = weighted sum of p and its 8 neighbors
                      p = sqrt(Gx + Gy)

                         Weights for Gx:     Weights for Gy:

                           -1   0   1           1    2    1

                           -2   0   2           0    0    0

                           -1   0   1           -1   -2   -1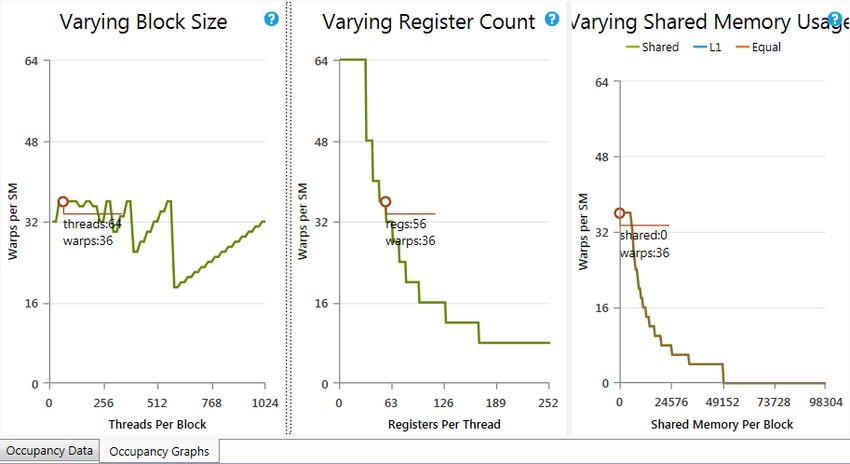
ENVIRONMENT

NVIDIA GTX Titan X
  GM200
  SM5.2
Windows 7
NVIDIA Nsight Visual Studio Edition 4.6
PERFORMANCE OPTIMIZATION CYCLE
                     1. Profile
                    Application

                                      2. Identify
5. Change and
                                     Performance
  Test Code
                                        Limiter

       4. Reflect                 3. Analyze Profile
                                  & Find Indicators
       4b. Build Knowledge
                                    Chameleon from http://www.vectorportal.com, Creative Commons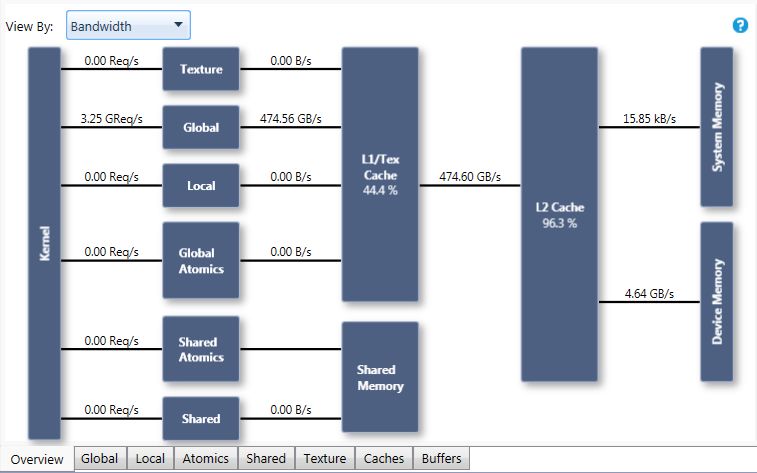
PREREQUISITES
Basic understanding of the GPU Memory Hierarchy
   Global Memory (slow, generous)
   Shared Memory (fast, limited)
   Registers (very fast, very limited)
   (Texture Cache)
Basic understanding of the CUDA execution model
   Grid 1D/2D/3D
   Block 1D/2D/3D
   Warp-synchronous execution (32 threads per warp)
ITERATION 1
TRACING THE APPLICATION

  Verify
Parameters
  Select
  Trace
Application
 Activate
  CUDA

              Launch
NAVIGATING THE ANALYSIS REPORTS Timeline CUDA Summary CUDA Launches
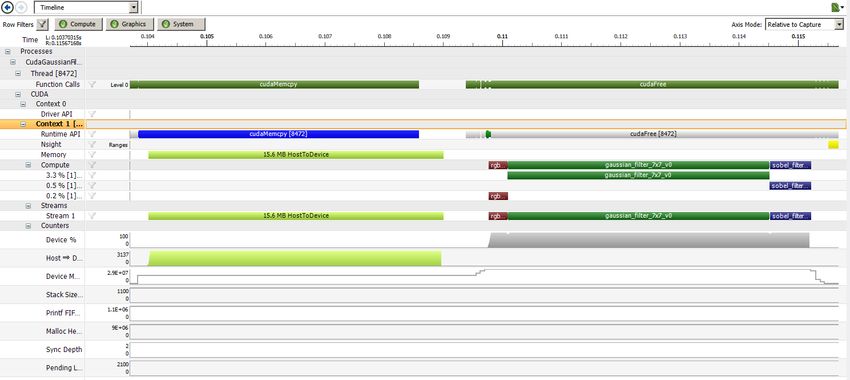
TIMELINE
IDENTIFY HOTSPOT (CUDA SUMMARY)

Hotspot

          Identify the hotspot: gaussian_filter_7x7_v0()
          Kernel             Time        Speedup
          Original Version   1.971ms     1.00x
PERFORM KERNEL ANALYSIS
Select Profile
CUDA Application
Select the Kernel
Select the
Experiments (All)
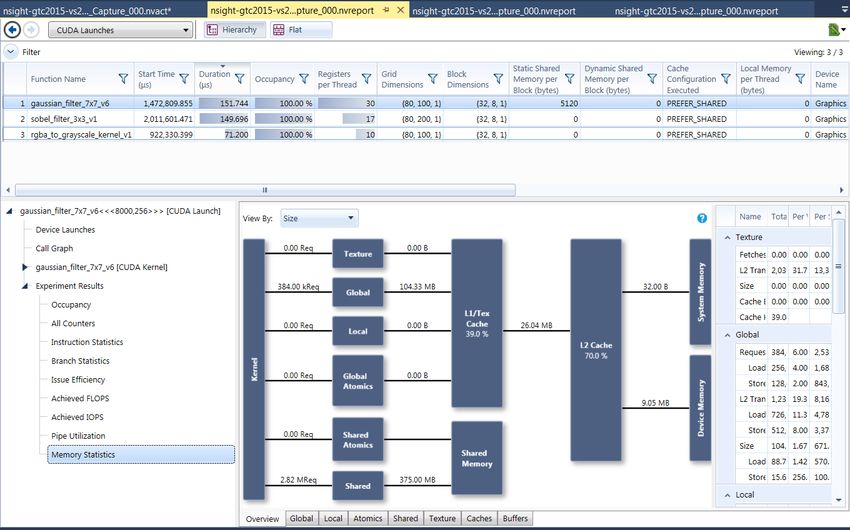
LaunchTHE CUDA LAUNCHES VIEW
Select
Kernel
Select
Experiment
Experiment
ResultsIDENTIFY MAIN PERFORMANCE LIMITER
Memory Utilization vs Compute Utilization
Four possible combinations:
60%
Comp Mem Comp Mem Comp Mem Comp Mem
Compute Bandwidth Latency Compute and
Bound Bound Bound Bandwidth
BoundMEMORY BANDWIDTH
SM SM
Registers Registers
SMEM/L1$ SMEM/L1$
L2$
Global Memory (Framebuffer)IDENTIFY PERFORMANCE LIMITER Utilization of L2$ Bandwidth (BW) limited and DRAM BW < 2% Not limited by memory bandwidth
INSTRUCTION THROUGHPUT

          SM
   256KB Register File      Each SM has 4 schedulers (Maxwell)
   96KB Shared Memory

                            Schedulers issue instructions to pipes
Sched               Sched

Pipes               Pipes   Each scheduler schedules up to 2 instructions
                            per cycle
        Tex/L1$

Sched               Sched
                            A scheduler issues inst. from a single warp

Pipes               Pipes   Cannot issue to a pipe if its issue slot is full
        TEX/L1$
INSTRUCTION THROUGHPUT
Schedulers and pipe
Schedulers saturated Pipe saturated
saturated
Sched Sched Sched Sched Sched Sched Sched Sched Sched Sched Sched Sched
Utilization: 90% Utilization: 64% Utilization: 92%
Shared Control Shared Control Shared Control
Texture ALU Texture ALU Texture ALU
Mem Flow Mem Flow Mem Flow
90%
78%
65%
24% 27%
11% 8% 6%
4% 4%WARP ISSUE EFFICIENCY
Percentage of issue slots used (blue)
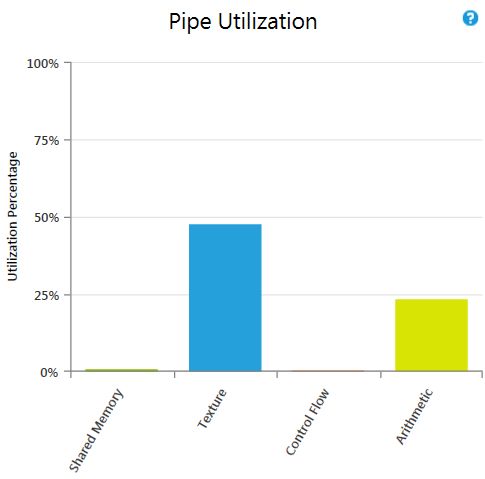
Aggregated over all the schedulersPIPE UTILIZATION
Percentages of issue slots used per pipe
Accounts for pipe throughputs
Four groups of pipes:
Shared Memory
Texture
Control Flow
Arithmetic (ALU)INSTRUCTION THROUGHPUT
Neither schedulers nor pipes are saturated
Not limited by the instruction throughput
Our Kernel is Latency BoundLOOKING FOR INDICATORS
56% of theoretical occupancy
29.35 active warps per cycle
1.18 warps eligible per cycle
Let’s start with occupancyOCCUPANCY
Each SM has limited resources
64K Registers (32 bit) shared by threads
Up to 48KB of shared memory per block (96KB per SMM)
32 Active Blocks per SMM
Full occupancy: 2048 threads per SM (64 warps)
Values vary with Compute CapabilityLATENCY
GPUs cover latencies by having a lot of work in flight
The warp issues
The warp waits (latency)
Fully covered latency Exposed latency
warp 0
warp 1
warp 2
warp 3
warp 4
warp 5
warp 6
warp 7
warp 8
warp 9
No warp issuingLATENCY: LACK OF OCCUPANCY
Not enough active warps
warp 0
warp 1
warp 2
warp 3
No warp issues
The schedulers cannot find eligible warps at every cycleLOOKING FOR MORE INDICATORS
We don’t want to change
the register count yet
Block Size
seems OKCONTINUE LOOKING FOR INDICATORS
4-8 L2 Transactions
per 1 RequestMEMORY TRANSACTIONS: BEST CASE
A warp issues 32x4B aligned and consecutive load/store request
Threads read different elements of the same 128B segment
1x 128B load/store request per warp
4x 32B L2 transactions per warp
4x L2 transactions: 128B needed / 128B transferredMEMORY TRANSACTIONS: WORST CASE
Threads in a warp read/write 4B words, 128B between words
Each thread reads the first 4B of a 128B segment
Stride: 32x4B 1x 128B load/store request per warp warp 2
1x 32B L2 transaction per thread
32x L2 transactions: 128B needed / 32x 32B transferredTRANSACTIONS AND REPLAYS
A warp reads from addresses spanning 3 lines of 128B
1st line: Threads 0-7 Threads 24-31
2nd line: Threads 8-15
3rd line: Threads 16-23
1 instr. executed and 2 replays = 1 request and 3 transactions
Instruction issued Instruction re-issued Instruction re-issued
1st replay 2nd replay
Time Threads
0-7/24-31
Threads
8-15
Threads
16-23TRANSACTIONS AND REPLAYS
With replays, requests take more time and use more resources
More instructions issued
More memory traffic
Increased execution time
Execution time
Inst. 0 Inst. 1 Inst. 2 Inst. 0 Inst. 1 Inst. 2
Issued Issued Issued Completed Completed Completed
Extra work (SM) Extra latency
Transfer data for inst. 0
Transfer data for inst. 1
Transfer data for inst. 2
Extra memory traffic
Threads Threads Threads Threads Threads Threads
0-7/24-31 8-15 16-23 0-7/24-31 8-15 16-23CHANGING THE BLOCK LAYOUT
Our blocks are 8x8
threadIdx.x (stride-1, uchar)
Warp 0
0 1 2 3 4 5 6 7 0 1 2 3 4 5 6 7 0 1 2 3 4 5 6 7 0 1 2 3 4 5 6 7
8 9 10 11 12 13 14 15 8 9 10 11 12 13 14 15 8 9 10 11 12 13 14 15 8 9 10 11 12 13 14 15
Warp 1 16 17 18 19 20 21 22 23 16 17 18 19 20 21 22 23 16 17 18 19 20 21 22 23 16 17 18 19 20 21 22 23
24 25 26 27 28 29 30 31 24 25 26 27 28 29 30 31 24 25 26 27 28 29 30 31 24 25 26 27 28 29 30 31
32 33 34 35 36 37 38 39 32 33 34 35 36 37 38 39 32 33 34 35 36 37 38 39 32 33 34 35 36 37 38 39
40 41 42 43 44 45 46 47 40 41 42 43 44 45 46 47 40 41 42 43 44 45 46 47 40 41 42 43 44 45 46 47
48 49 50 51 52 53 54 55 48 49 50 51 52 53 54 55 48 49 50 51 52 53 54 55
48 49 50 51 52 53 54 55
56 57 58 59 60 61 62 63 56 57 58 59 60 61 62 63 56 57 58 59 60 61 62 63 56 57 58 59 60 61 62 63
Data Overfetch
We should use blocks of size 32x2
0 1 2 3 4 5 6 7 8 9 10 11 12 13 14 15 16 17 18 19 20 21 22 23 24 25 26 27 28 29 30 31
32 33 34 35 36 37 38 39 40 41 42 43 44 45 46 47 48 49 50 51 52 53 54 55 56 57 58 59 60 61 62 63IMPROVED MEMORY ACCESS Blocks of size 32x2 Memory is used more efficiently Kernel Time Speedup Original Version 1.971ms 1.00x Better Memory Accesses 0.725ms 2.72x
PERF-OPT QUICK REFERENCE CARD
Category:     Latency Bound – Occupancy
Problem:      Latency is exposed due to low occupancy
Goal:         Hide latency behind more parallel work
Indicators:   Occupancy low (< 60%)
              Execution Dependency High

Strategy:     Increase occupancy by:
              • Varying block size
              • Varying shared memory usage
              • Varying register count
PERF-OPT QUICK REFERENCE CARD
Category: Latency Bound – Coalescing
Problem: Memory is accessed inefficiently => high latency
Goal: Reduce #transactions/request to reduce latency
Indicators: Low global load/store efficiency,
High #transactions/#request compared to ideal
Strategy: Improve memory coalescing by:
• Cooperative loading inside a block
• Change block layout
• Aligning data
• Changing data layout to improve localityPERF-OPT QUICK REFERENCE CARD
Category: Bandwidth Bound - Coalescing
Problem: Too much unused data clogging memory system
Goal: Reduce traffic, move more useful data per request
Indicators: Low global load/store efficiency,
High #transactions/#request compared to ideal
Strategy: Improve memory coalescing by:
• Cooperative loading inside a block
• Change block layout
• Aligning data
• Changing data layout to improve localityITERATION 2
IDENTIFY HOTSPOT

Hotspot

          gaussian_filter_7x7_v0() still the hotspot
          Kernel                   Time      Speedup
          Original Version         1.971ms   1.00x
          Better Memory Accesses   0.725ms   2.72x
IDENTIFY PERFORMANCE LIMITER Utilization of L2$ Bandwidth (BW) limited and DRAM BW < 4% Not limited by memory bandwidth
IDENTIFY PERFORMANCE LIMITER
Scheduler is starting to be busy
but Tex pipe is clearly the limiter
Load/Store pipeline is saturatedLOOKING FOR INDICATORS 98.89% Hit Rate in L2 Cache The kernel is mostly working from the L2 cache
LOOKING FOR MORE INDICATORS
Kernel Transfers 8MB to/from Device Memory but 360MB to/from L2 Cache

        Can we move the data closer to the SM?
SHARED MEMORY
Adjacent pixels access similar neighbors in Gaussian Filter
We should use shared memory to store those common pixels
__shared__ unsigned char smem_pixels[10][64];SHARED MEMORY Using shared memory for the Gaussian Filter Significant speedup, < 0.5ms Kernel Time Speedup Original Version 1.971ms 1.00x Better Memory Accesses 0.725ms 2.72x Shared Memory 0.334ms 5.90x
PERF-OPT QUICK REFERENCE CARD
Category:     Latency Bound – Shared Memory
Problem:      Long memory latencies are harder to hide
Goal:         Reduce latency, move data to faster memory
Indicators:   Shared memory not occupancy limiter
              High L2 hit rate
              Data reuse between threads and small-ish working set
Strategy:     (Cooperatively) move data to:
              • Shared Memory
              • (or Registers)
              • (or Constant Memory)
              • (or Texture Cache)
PERF-OPT QUICK REFERENCE CARD
Category: Memory Bound – Shared Memory
Problem: Too much data movement
Goal: Reduce amount of data traffic to/from global mem
Indicators: Higher than expected memory traffic to/from global
memory
Low arithmetic intensity of the kernel
Strategy: (Cooperatively) move data closer to SM:
• Shared Memory
• (or Registers)
• (or Constant Memory)
• (or Texture Cache)ITERATION 3
IDENTIFY HOTSPOT

Hotspot

          gaussian_filter_7x7_v0() still the hotspot
          Kernel                   Time      Speedup
          Original Version         1.971ms   1.00x
          Better Memory Accesses   0.725ms   2.72x
          Shared Memory            0.334ms   5.90x
IDENTIFY PERFORMANCE LIMITER Utilization of L2$ Bandwidth (BW) moderate and DRAM BW < 8% Not limited by memory bandwidth
IDENTIFY PERFORMANCE LIMITER The Kernel is Compute Bound
LOOKING FOR INDICATORS
No Divergence in our code
BRANCH DIVERGENCE

Threads of a warp take different branches of a conditional

if( threadIdx.x < 12 ) {}

else {}

                     Execution time = “if” branch + “else” branch

          Threads execute the “if” branch          Threads execute the “else” branch

                                            Time
LOOKING FOR MORE INDICATORS
Execution dependency is largest block
Not a clear indicator howeverSTALL REASONS:
EXECUTION DEPENDENCY
a = b + c; // ADD a = b[i]; // LOAD
d = a + e; // ADD d = a + e; // ADD
Memory accesses may influence execution dependencies
Global accesses create longer dependencies than shared accesses
Read-only/texture dependencies are counted in Texture
Instruction level parallelism can reduce dependencies
a = b + c; // Independent ADDs
d = e + f;ILP AND MEMORY ACCESSES
No ILP 2-way ILP (with loop unrolling)
float a = 0.0f; float a, a0 = 0.0f, a1 = 0.0f;
for( int i = 0 ; i < N ; ++i ) for( int i = 0 ; i < N ; i += 2 )
a += logf(b[i]); {
a0 += logf(b[i]);
c = b[0]
a1 += logf(b[i+1]);
}
a += logf(c) a = a0 + a1
c = b[1]
c0 = b[0]
a += logf(c) c1 = b[1]
a0 += logf(c0)
c = b[2] a1 += logf(c1)
c0 = b[2]
a += logf(c) c1 = b[3]
a0 += logf(c0)
c = b[3] ... a1 += logf(c1)
a += logf(c) a = a0 + a1
#pragma unroll is useful to extract ILP
Manually rewrite code if not a simple loopLOOKING FOR MORE INDICATORS
>4TIOP/second
The Kernel is simply computing a lotREDUCING COMPUTATIONAL COMPLEXITY
Separable Filter:
Gaussian filters are circular and separable
Compute horizontal and vertical convolution separately
1 2 3 4 3 2 1 1 1 2 3 4 3 2 1
2 4 6 8 6 4 2 2 2 4 6 8 6 4 2
3 6 9 12 9 6 3 3 3 6 9 12 9 6 3
4 8 12 16 12 8 4 1234321 ∗ 4 = 4 8 12 16 12 8 4
3 6 9 12 9 6 3
3 3 6 9 12 9 6 3
2 2 4 6 8 6 4 2
2 4 6 8 6 4 2
1 2 3 4 3 2 1
1 1 2 3 4 3 2 1SEPARABLE FILTER + INCREASED ILP Separable filter reduces computational load Processing two elements per thread increases instruction level parallelism Kernel Time Speedup Original Version 1.971ms 1.00x Better Memory Accesses 0.725ms 2.72x Shared Memory 0.334ms 5.90x Separable Filter + incr. ILP 0.179ms 11.01x
PERF-OPT QUICK REFERENCE CARD
Category:     Compute Bound – Branch Divergence
Problem:      Diverging threads
Goal:         Reduce divergence within warps
Indicators:   Low warp execution efficiency,
              high control flow utilization

Strategy:     • Refactor code to avoid intra-warp divergence
              • Restructure data (sorting?) to avoid data-
                dependent branch divergence
PERF-OPT QUICK REFERENCE CARD
Category: Latency Bound – Instruction Level Parallelism
Problem: Not enough independent work per thread
Goal: Do more parallel work inside single threads
Indicators: High execution dependency, increasing occupancy has
no/little positive effect, still registers available
Strategy: • Unroll loops (#pragma unroll)
• Refactor threads to compute n output values at
the same time (code duplication)PERF-OPT QUICK REFERENCE CARD
Category: Compute Bound – Algorithmic Changes
Problem: GPU is computing as fast as possible
Goal: Reduce computation if possible
Indicators: Clearly compute bound problem, speedup only with
less computation
Strategy: • Pre-compute or store (intermediate) results
• Trade memory for compute time
• Use a computationally less expensive algorithmTHE RESULT: 11.01X Much better utilization The sobel filter is starting to become the bottleneck
MORE IN OUR COMPANION CODE
Kernel                           Time            Speedup
Gaussian Original Version        1.971ms         1.00x
Better Memory Accesses           0.725ms         2.72x
Shared Memory                    0.334ms         5.90x
Separable Filter + incr. ILP     0.179ms         11.01x
Floats instead of int ops        0.153ms         12.88x

Sobel Filter Baseline            0.200ms         1.00x
Floats+Intrinsics+fast_math      0.152ms         1.32x
                               Your Next Idea!

     Companion Code: https://github.com/chmaruni/nsight-gtc2015
SUMMARY
ITERATIVE OPTIMIZATION WITH NSIGHT VSE
 Trace the Application
 Identify the Hotspot and Profile It
 Identify the Performance Limiter
    Memory Bandwidth
    Instruction Throughput
    Latency
 Look for indicators
 Reflect and Optimize the Code
 Iterate
REFERENCES
Performance Optimization: Programming Guidelines and GPU Architecture
Details Behind Them, GTC 2013
http://on-demand.gputechconf.com/gtc/2013/video/S3466-Performance-Optimization-
Guidelines-GPU-Architecture-Details.mp4
http://on-demand.gputechconf.com/gtc/2013/presentations/S3466-Programming-
Guidelines-GPU-Architecture.pdf
CUDA Best Practices Guide
http://docs.nvidia.com/cuda/cuda-c-best-practices-guide/
Parallel Forall devblog
http://devblogs.nvidia.com/parallelforall/
Upcoming GTC 2015 Sessions:
S5655 CUDA Application Development Life Cycle with Nsight Eclipse Edition (Hands-on
lab), Nikita Shulga, Thursday 2pm
S5353+S5376 Memory Bandwidth Bootcamp (and Beyond), Tony Scudiero, Thursday
3:30pm and 5pmNVIDIA REGISTERED DEVELOPER PROGRAMS
Everything you need to develop with NVIDIA products
Membership is your first step in establishing a working relationship with
NVIDIA Engineering
Exclusive access to pre-releases
Submit bugs and features requests
Stay informed about latest releases and training opportunities
Access to exclusive downloads
Exclusive activities and special offers
Interact with other developers in the NVIDIA Developer Forums
REGISTER FOR FREE AT: developer.nvidia.comTHANK YOU
You can also read