2021 CITY OF SUNNYVALE Q2 - FLIGHT OPERATIONS AND NOISE REPORT CASPER AIRPORT SOLUTIONS, INC. | 1055 Westlakes Drive, Suite 300, Berwyn, PA ...
←
→
Page content transcription
If your browser does not render page correctly, please read the page content below
2021

CITY OF SUNNYVALE
Q2 – FLIGHT OPERATIONS AND NOISE REPORT

CASPER AIRPORT SOLUTIONS, INC. | 1055 Westlakes Drive, Suite 300, Berwyn, PA 19312 | https://casper.aero
DISCLAIMER
Casper Airport Solutions, Inc. provides the data in this report on behalf of the City of Sunnyvale
for informational purposes only. It has no legal standing and is not recognized as an official
source by either the State of California or the Federal Aviation Administration (FAA).
The City of Sunnyvale is not an airport authority. It has no statutory reporting obligation under
Title 21 of the California Department of Transportation.
The sound level meters installed by Casper are certified by the manufacturer Larson Davis to
meet all ANSI performance requirements for a Type 1 sound level meter.
The FAA System Wide Information Management (SWIM) flight track position data has a stated
minimum accuracy of + 150 feet and temporal accuracy of approximately 1 second.

                                                                            © 2021 Casper Airport Solutions, Inc.

                                                                                                                    1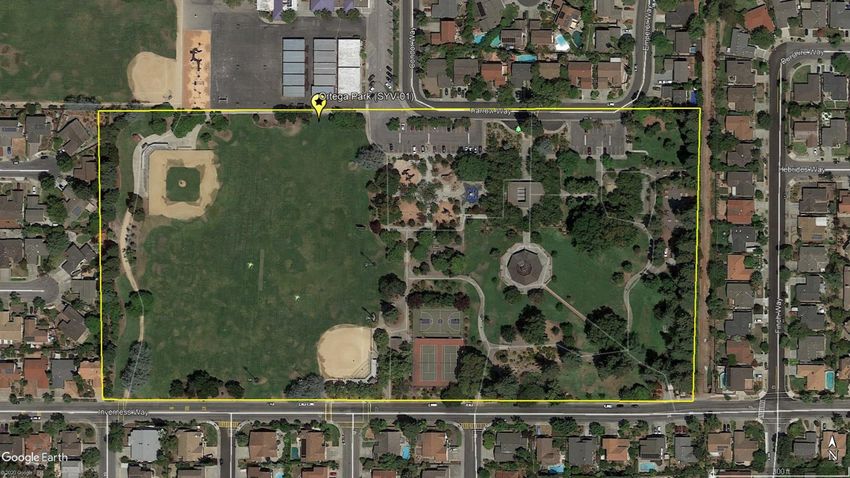
INTRODUCTION
The City of Sunnyvale's primary goal in procuring a Noise and Operations Monitoring System (NOMS) is to monitor flight
activity and the aircraft noise associated with overflights that affect residents living within the city limits. Secondly, to
provide this data to interested parties in a transparent and unfiltered way.

The data contained in this report is presented with that goal in mind. On each page, you will find an explanation of how
to read the various charts and definitions of the different metrics and data types. What you will not find is any
interpretation by the “City” about the data in this report.

For a more detailed explanation of the various noise metrics, general aircraft operations, or ATC procedures discussed in
this report, please refer to the Education section of the City of Sunnyvale's NoiseLab website
(https://syv.noiselab.casper.aero). The website also contains interactive data browsers that allow interested parties to
view detailed noise and flight operations statistics concerning areas around the City of Sunnyvale.

When reading this report, it is essential to consider the following factors:

    •   This report's data may vary from San Jose International Airport's (SJC) information as this report does not
        include South Flow arrivals to SJC that did not overfly the “City”.
    •   Not every aircraft overflight is captured by one of the four NMTs due to spikes in ambient noise levels, which
        may obscure the aircraft event or environmental factors such as wind speed and direction.
    •   The maximum noise level of a specific flight may vary based on the point of closest approach (PCA) slant
        distance and altitude of the aircraft in relation to the NMT. In addition, aircraft engine power settings, flap
        position, and landing gear state also influence the maximum noise level and event duration.
    •   The City's noise monitors capture noise events from all sources such as people, vehicles, animals, trains, and
        planes. The NOMS system analyzes every noise event captured by each NMT to determine if it meets the
        parameters to identify it as an aircraft noise event. Once the system identifies the source of a noise event as an
        aircraft, the NOMS system then attempts to match the noise event based on the time stamp, altitude, and
        lateral distance from the noise monitor to a specific flight.

24 HOUR VIEW OF AIRCRAFT NOISE
Most aircraft overfly the City during daytime hours between 7:00 AM and 7:00 PM when ambient noise levels tend to be
higher due to increased community activity. Aircraft overflight volumes during the evening (7:00 PM to 10:00 PM) and
nighttime (10:00 PM to 7:00 AM) periods are significantly reduced. However, individual events during these periods can
be more disturbing to residents due to the lower ambient noise levels in the City. Below is the breakdown of flights by
time of day in Q2-2021.

                             SUNNYVALE OVERFLIGHTS BY TIME OF DAY

                         DAY = 8,753                  EVENING = 1,125                  NIGHT = 578
                                                                                                                             2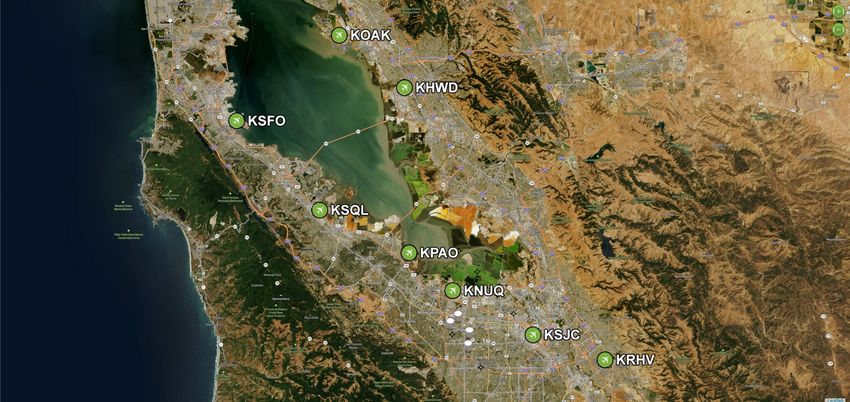
SJC AIRPORT SOUTH FLOW DATA FOR Q2 – 2021
One of the City of Sunnyvale's primary objectives in installing a Noise and Operations Monitoring System (NOMS) was to
monitor and report on South Flow arrivals that overfly the City on their approach to land to Norman Y. Mineta San Jose
International Airport (SJC).

There are two types of approaches flown by airplanes landing in South Flow at SJC Airport. The widely dispersed
ILS/Visual approach is shown in yellow. The highly concentrated RNP approach is shown in blue on the facing page.

The ILS/Visual approach has a wide lateral footprint because the pilots are flying vectors (headings) under ATC's
direction. The controller determines their turn onto the final approach. By contrast, the RNP approach is a precision
instrument procedure that utilizes fixed GPS waypoints that must be precisely overflown and have very small lateral
error tolerances.

Because of the wide dispersion caused by the ILS/Visual approach, a single noise monitoring terminal (NMT) cannot
capture a noise event for each flight. However, the concentrated flight path of the RNP approach makes it possible to
capture noise events at SYV-2 Dona Ave. for the vast majority of aircraft flying this approach.

In the 2nd quarter of 2021, the Casper system successfully captured noise events for 93% of the total South Flow RNP
approaches flown to SJC Airport, the distribution of which is shown in the chart below.

 The chart at right illustrates the
 maximum noise level (Lmax)
 recorded at the Dona Ave
 (SYV-2) permanent noise
 monitor for aircraft that flew
 the RNP Approach to Runway
 12L or 12R at SJC Airport and
 passed over the City of
 Sunnyvale.

 The number above each bar
 represents the total number of
 aircraft noise events in which
 the Lmax fell within the specific
 five decibel bucket identified
 on the chart.

                                                                                                                        3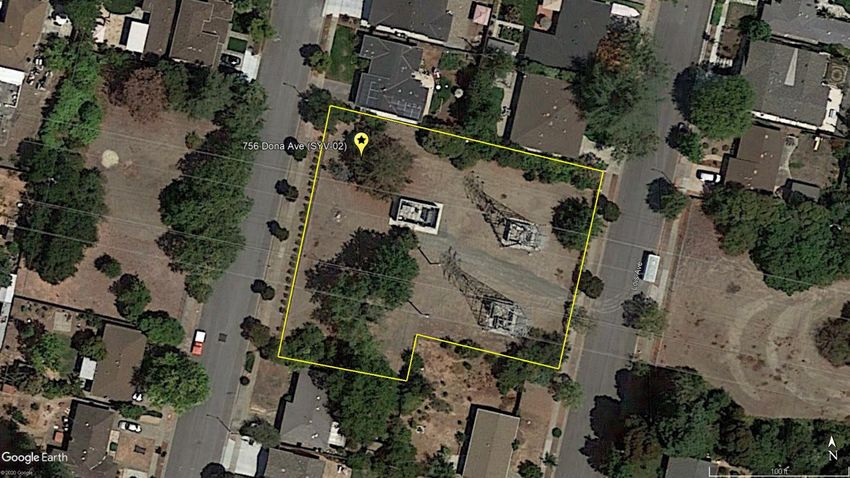
SOUTH FLOW APPROACHES IN Q2-2021

                       ILS/Visual   RNP
Average Altitude ft.   3,159        3,184
Runway 12L App.        16           27
Runway 12R App.        335          186
Total Approaches       351          213

                                            4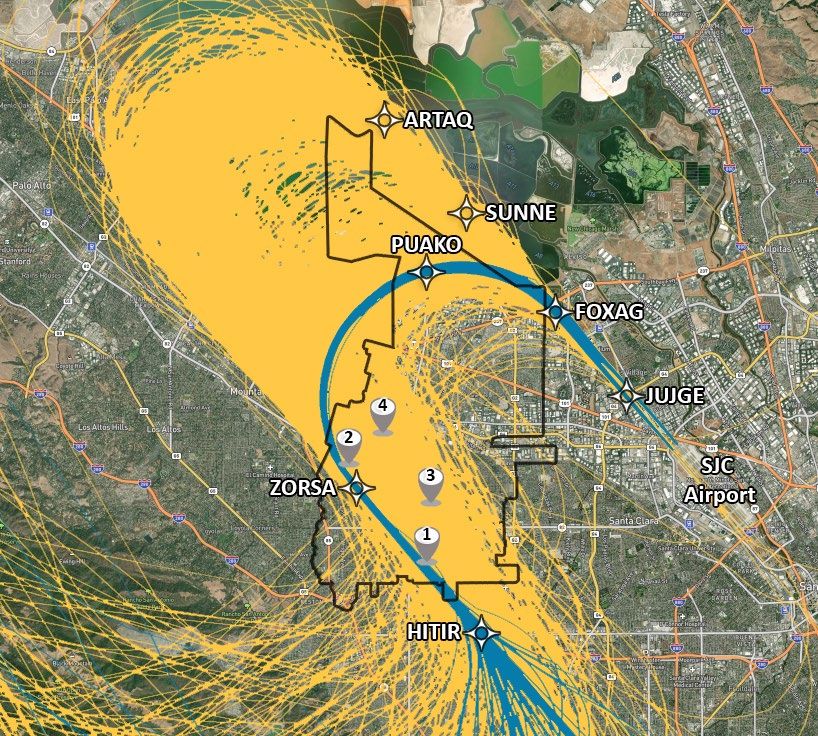
CITY OF SUNNYVALE OVERFLIGHT DATA FOR Q2 – 2021

While SJC Airport is the closest major airport to the City of Sunnyvale, residents are overflown by aircraft arriving and
departing from many different airports in the region. The data in this section quantifies overflights associated with each
of the eight primary airports of interest listed below and helps explain the distribution of flights across the four zip codes
that fall within the City limits.

AIRPORTS OF INTEREST

    •   KHWD – Hayward Executive Airport                            •   KRHV – Reid-Hillview Airport of Santa Clara County
    •   KNUQ – Moffett Federal Airfield                             •   KSFO – San Francisco Int’l Airport
    •   KOAK – Metro Oakland Int’l Airport                          •   KSJC – Norman Y Mineta San Jose Int’l Airport
    •   KPAO – Palo Alto Airport                                    •   KSQL – San Carlos Airport

                                                                                                                            5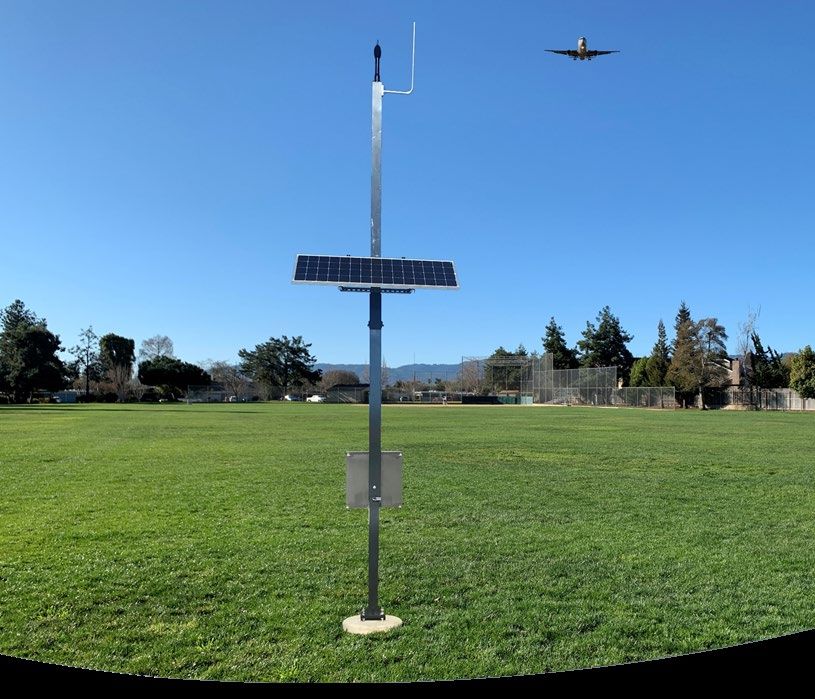
The City of Sunnyvale is comprised of four primary zip codes (94085, 94086, 94087, 94089), which bisect the City
forming four unique zones from North to South. The volume of overflights on any given day can vary significantly across
the City. Seasonal wind patterns play the most significant role in dictating the arrival and departure patterns into a
specific airport. The current wind direction largely determines which Sunnyvale neighborhoods are overflown by aircraft
during their arrival or departure to that airport. The charts below illustrate the pattern of overflights for each of the four
zip codes for the 2nd Quarter of 2021.

OVERFLIGHTS BY AIRPORT IN ZIP CODE 94085                             OVERFLIGHTS BY AIRPORT IN ZIP CODE 94086

OVERFLIGHTS BY AIRPORT IN ZIP CODE 94087                             OVERFLIGHTS BY AIRPORT IN ZIP CODE 94089

                                                                                                                            6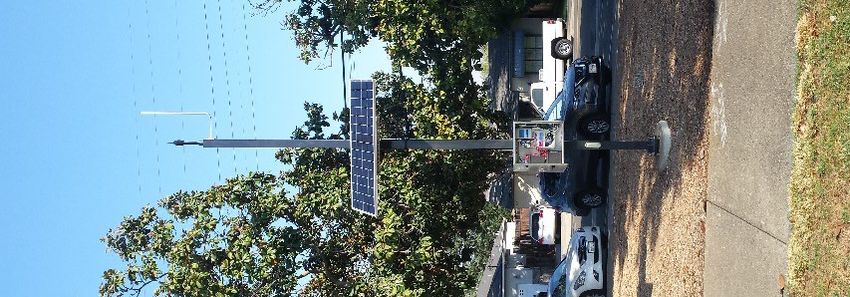
SYV-1 ORTEGA PARK NMT DATA Q2 – 2021

Noise Monitoring Terminal SYV-1 is in Ortega Park. Its primary purpose is to capture RNP arrivals to SJC Airport in South
Flow and secondarily flight activity associated with Moffett Field, Palo Alto, Reid-Hillview, and San Carlos Airports. The
image below is an aerial depicting the location of the NMT in the park and a photo of the installed equipment.

                                                                                              The chart at left illustrates
           SYV-1 TOP 10 AIRCRAFT NOISE EVENTS IN Q2-2021                                      the Top 10 aircraft noise
                                                                                              events ranked by
                                                                                              maximum noise level
                                                                                              (Lmax) as measured at
                                                                                              SYV-1 in the 2nd Quarter
                                                                                              of 2021. Below each bar
                                                                                              is the date of the event
                                                                                              and the four-letter ICAO
                                                                                              aircraft code of the
                                                                                              aircraft type involved.

                                                                                              Events with no aircraft
                                                                                              type denote that an
                                                                                              aircraft type was not
                                                                                              identified in the FAA data.

                                                                                                                              7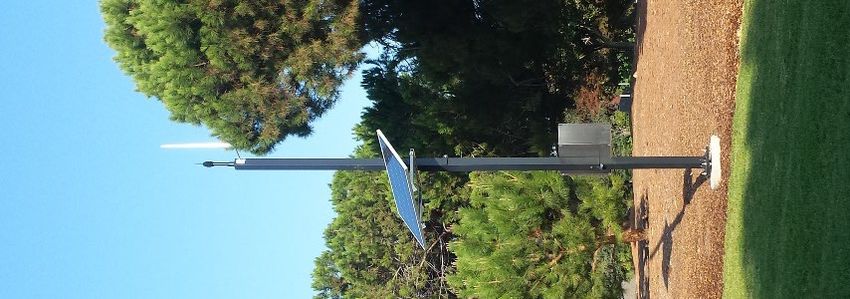
The charts below illustrate the relationship between aircraft and community noise and their contribution to the total
noise environment measured by the noise monitoring terminal SYV-1 in Ortega Park.

Noise events captured by the NMTs are analyzed on the fly as they happen. Based on their categorization as community
or aircraft noise, the system automatically calculates an hourly Aircraft, Community, and Total LEQ (equivalent
continuous sound level). Equivalent signifies that the total acoustical energy associated with the continually fluctuating
noise level (during the specified period); in this case, a month is equal to the total acoustic energy associated with the
steady noise level. Hourly LEQs are averaged to derive a Daily LEQs, which is averaged to derive a monthly LEQ. The
Total LEQ considers both the aircraft and community contributions to the noise environment.

                                                                                                                         8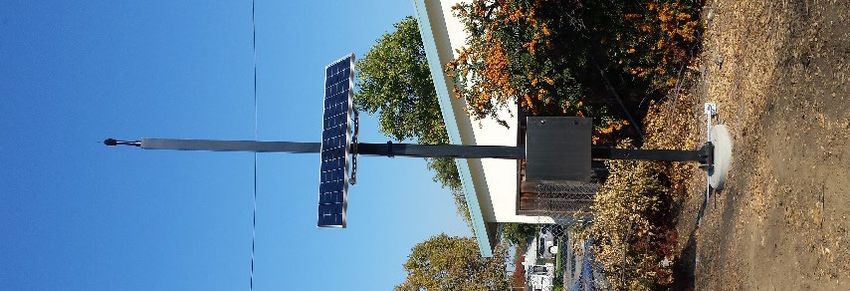
SYV-2 DONA AVE NMT DATA Q2 – 2021

Noise Monitoring Terminal SYV-2 is on Dona Ave. Its primary purpose is to capture RNP arrivals to SJC Airport in South
Flow and secondarily flight activity associated with Moffett Field, Palo Alto, Reid-Hillview, and San Carlos Airports. The
image below is an aerial depicting the location of the NMT and a photo of the installed equipment.

                                                                                               The chart at left illustrates
           SYV-2 TOP 10 AIRCRAFT NOISE EVENTS IN Q2-2021                                       the Top 10 aircraft noise
                                                                                               events ranked by
                                                                                               maximum noise level
                                                                                               (Lmax) as measured at
                                                                                               SYV-2 in the 2nd Quarter
                                                                                               of 2021. Below each bar
                                                                                               is the date of the event
                                                                                               and the four-letter ICAO
                                                                                               aircraft code of the
                                                                                               aircraft type involved.

                                                                                               Events with no aircraft
                                                                                               type denote that an
                                                                                               aircraft type was not
                                                                                               identified in the FAA data.

                                                                                                                               9
The charts below illustrate the relationship between aircraft and community noise and their contribution to the total
noise environment measured by the noise monitoring terminal SYV-2 on Dona Avenue.
Noise events captured by the NMTs are analyzed on the fly as they happen. Based on their categorization as community
or aircraft noise, the system automatically calculates an hourly Aircraft, Community, and Total LEQ (equivalent
continuous sound level). Equivalent signifies that the total acoustical energy associated with the continually fluctuating
noise level (during the specified period); in this case, a month is equal to the total acoustic energy associated with the
steady noise level. Hourly LEQs are averaged to derive a Daily LEQs, which is averaged to derive a monthly LEQ. The
Total LEQ considers both the aircraft and community contributions to the noise environment.
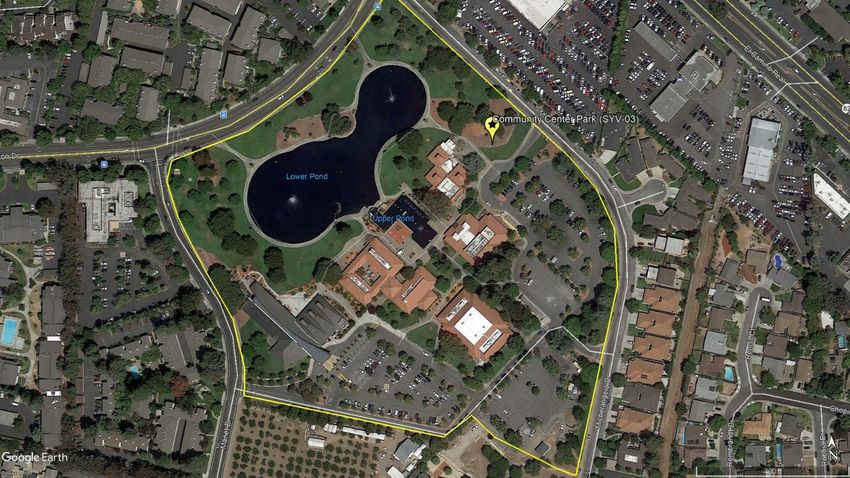
10SYV-3 COMMUNITY CENTER PARK NMT DATA Q2 – 2021
Noise Monitoring Terminal SYV-3 is in Community Center Park. Its primary purpose is to capture RNP arrivals to SJC
Airport in South Flow and secondarily flight activity associated with Moffett Field, Palo Alto, Reid-Hillview, and San
Carlos Airports. The image below is an aerial depicting the location of the NMT and a photo of the installed equipment.
The chart at left illustrates
SYV-3 TOP 10 AIRCRAFT NOISE EVENTS IN Q2-2021 the Top 10 aircraft noise
events ranked by
maximum noise level
(Lmax) as measured at
SYV-3 in the 2nd Quarter
of 2021. Below each bar
is the date of the event
and the four-letter ICAO
aircraft code of the
aircraft type involved.
Events with no aircraft
type denote that an
aircraft type was not
identified in the FAA data.
11The charts below illustrate the relationship between aircraft and community noise and their contribution to the total
noise environment measured by the noise monitoring terminal SYV-3 in Community Center Park.
Noise events captured by the NMTs are analyzed on the fly as they happen. Based on their categorization as community
or aircraft noise, the system automatically calculates an hourly Aircraft, Community, and Total LEQ (equivalent
continuous sound level). Equivalent signifies that the total acoustical energy associated with the continually fluctuating
noise level (during the specified period); in this case, a month is equal to the total acoustic energy associated with the
steady noise level. Hourly LEQs are averaged to derive a Daily LEQs, which is averaged to derive a monthly LEQ. The
Total LEQ considers both the aircraft and community contributions to the noise environment.
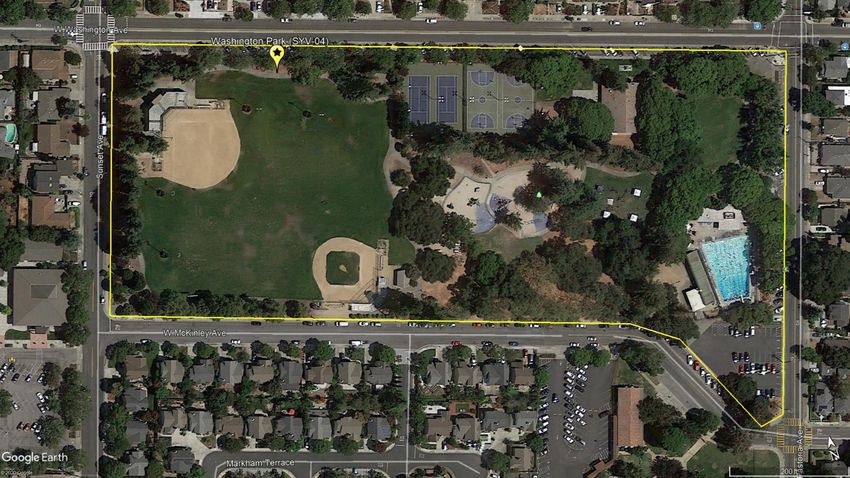
12SYV-4 WASHINGTON PARK NMT DATA Q2 – 2021
Noise Monitoring Terminal SYV-4 is in Washington Park. Its primary purpose is to capture RNP arrivals to SJC Airport in
South Flow and secondarily flight activity associated with Moffett Field, Palo Alto, Reid-Hillview, and San Carlos Airports.
The image below is an aerial depicting the location of the NMT and a photo of the installed equipment.
The chart at left illustrates
SYV-4 TOP 10 AIRCRAFT NOISE EVENTS IN Q2-2021 the Top 10 aircraft noise
events ranked by
maximum noise level
(Lmax) as measured at
SYV-4 in the 2nd Quarter
of 2021. Below each bar
is the date of the event
and the four-letter ICAO
aircraft code of the
aircraft type involved.
Events with no aircraft
type denote that an
aircraft type was not
identified in the FAA data.
13The charts below illustrate the relationship between aircraft and community noise and their contribution to the total
noise environment measured by the noise monitoring terminal SYV-4 in Washington Park.
Noise events captured by the NMTs are analyzed on the fly as they happen. Based on their categorization as community
or aircraft noise, the system automatically calculates an hourly Aircraft, Community, and Total LEQ (equivalent
continuous sound level). Equivalent signifies that the total acoustical energy associated with the continually fluctuating
noise level (during the specified period); in this case, a month is equal to the total acoustic energy associated with the
steady noise level. Hourly LEQs are averaged to derive a Daily LEQs, which is averaged to derive a monthly LEQ. The
Total LEQ considers both the aircraft and community contributions to the noise environment.
14ICAO AIRCRAFT CODE REFERENCE
Below is a list of the ICAO aircraft codes referenced in the Top-10 Aircraft Noise Event charts.
ICAO Aircraft Code Common Name Type
A124 Antonov An-124 Ruslan Cargo Jet
A306 Airbus A300-600 Commercial Jet
AC50 Aero Commander 500 General Aviation Piston
AJET Dassault Alpha Jet Military Jet Trainer
B430 Bell Helicopter 430 General Aviation Helicopter
B737 Boeing 737-700 Commercial jet
B763 Boeing 767-300 Commercial Jet
BE9L Beechcraft 90 King Air General Aviation Turboprop
BE35 Beechcraft 35 Bonanza General Aviation Piston
BE36 Beechcraft 36 Bonanza General Aviation Piston
C25B Cessna Citation CJ3 Business Jet
C68A Cessna Citation Latitude Business Jet
C172 Cessna Skyhawk General Aviation Piston
C180 Cessna 180 Skywagon General Aviation Piston
C182 Cessna 182 Skylane General Aviation Piston
C185 Cessna 185 Skywagon General Aviation Piston
C208 Cessna 208 Caravan General Aviation Turboprop
C414 Cessna 414 Chancellor General Aviation Piston
CL30 Bombardier Challenger 300 Business Jet
CL35 Bombardier Challenger 350 Business Jet
CL60 Bombardier Challenger 600 Business Jet
E75L Embraer 175 (Long Winglet) Commercial Jet
EC45 Airbus Helicopters EC-145 General Aviation Helicopter
GLEX Bombardier Global Express Business Jet
GLF6 Gulfstream G650 Business Jet
H25B Hawker Beechcraft 800 Business Jet
HELO Generic Helicopter General Aviation Helicopter
PC12 Pilatus PC-12 General Aviation Turboprop
S22T Cirrus SR22 Turbocharged General Aviation Piston
T6 North American T-6 Texan Military Piston Trainer
1516
You can also read