How networks are shaping Tshwane - Introduction and Context- Part I Serge SALAT
←
→
Page content transcription
If your browser does not render page correctly, please read the page content below
How networks are shaping Tshwane
  Introduction and Context– Part I
                      Serge SALAT
               Data analysis by Loeiz BOURDIC
       Urban analysis by Darren NEL and Albert FERREIRA

   Urban Morphology Institute – University of Pretoria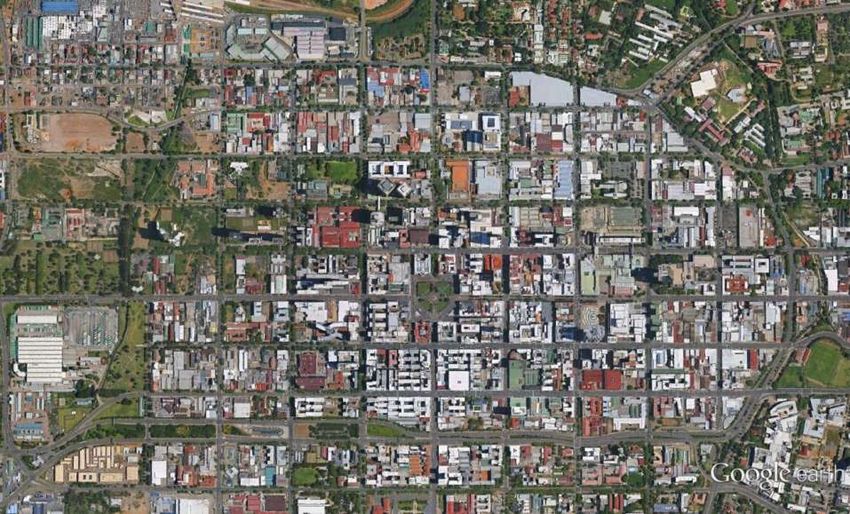
Structure of Presentations
Introduction: AFD – Urban Morphology Institute – Gauteng
   universities and Research Institutions program of cooperation
• Part I- Introduction and Context
    – Spatial Structure, Networks, Urban Morphology, and
      Resilience
    – South Africa and Gauteng Urban System
    – Urban Morphology of the City of Tshwane
• Part II- Tools for urban network analysis
    – Application of simple metrics and network analysis
• Part III- Tools for urban network analysis
    – Application of Space Syntax and Dual Approach
    – Future research and policy implications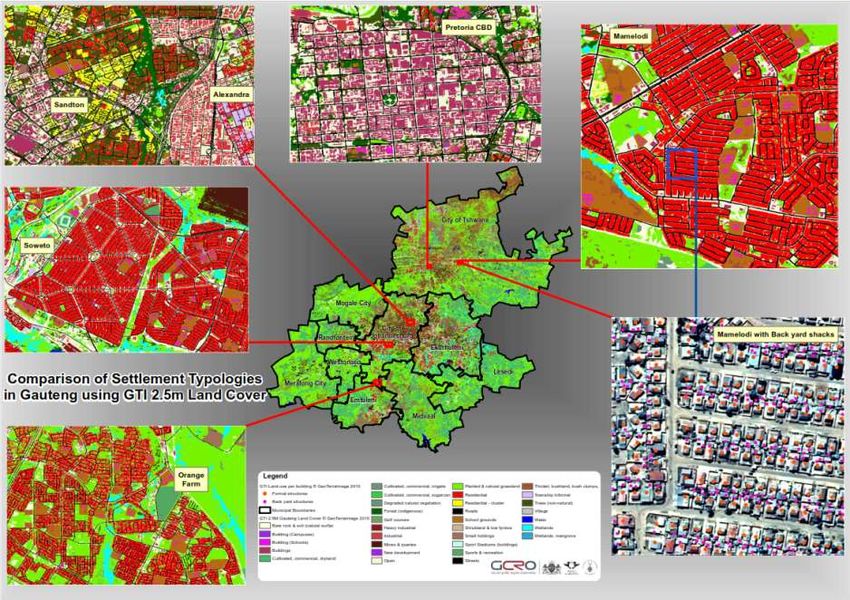
Introduction
AFD – Urban Morphology Institute – Gauteng universities
              and Research Institutions
               Program of cooperation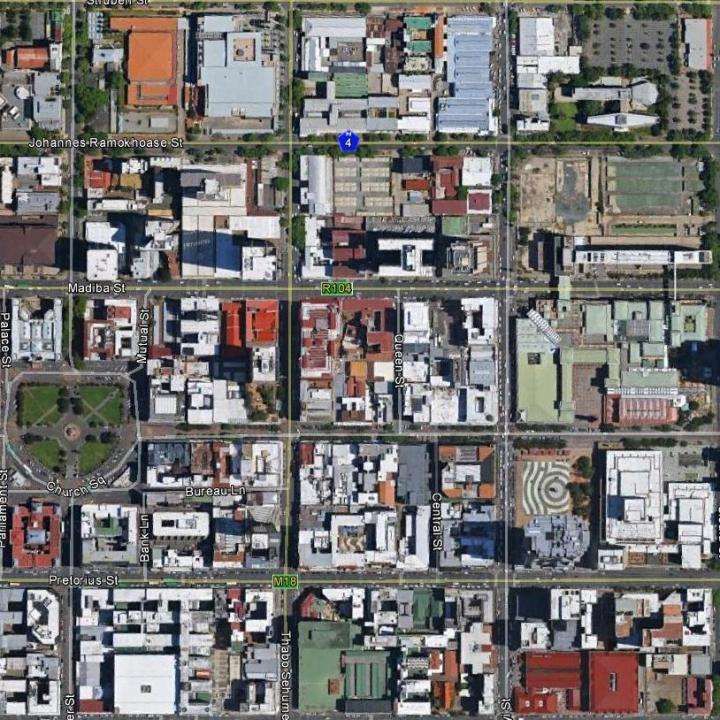
Spatial Structure, Networks,
  Urban Morphology, and
          Resilience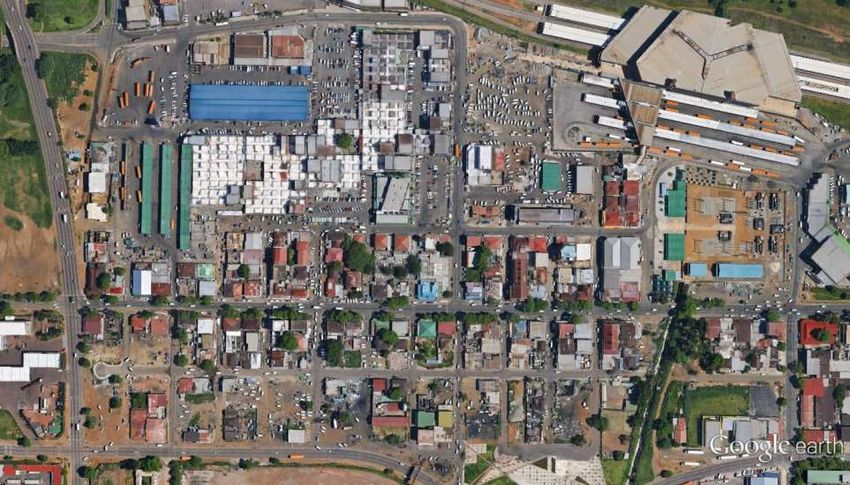
Why Spatial Structures?
• An urban spatial structure is defined by:
   – The average density (consumption of land per
     person)
   – The spatial distribution of densities and
     population
   – The pattern of daily trips

• It is deficient when (Bertaud 2008):
    – Commuting distances for a significant part of
       the population are too long to be travelled
       within a reasonable travel time or/and at a
       reasonable cost
    – The spatial distribution of population and the
       pattern of trips are incompatible with the main
       mode of transport affordable to the poor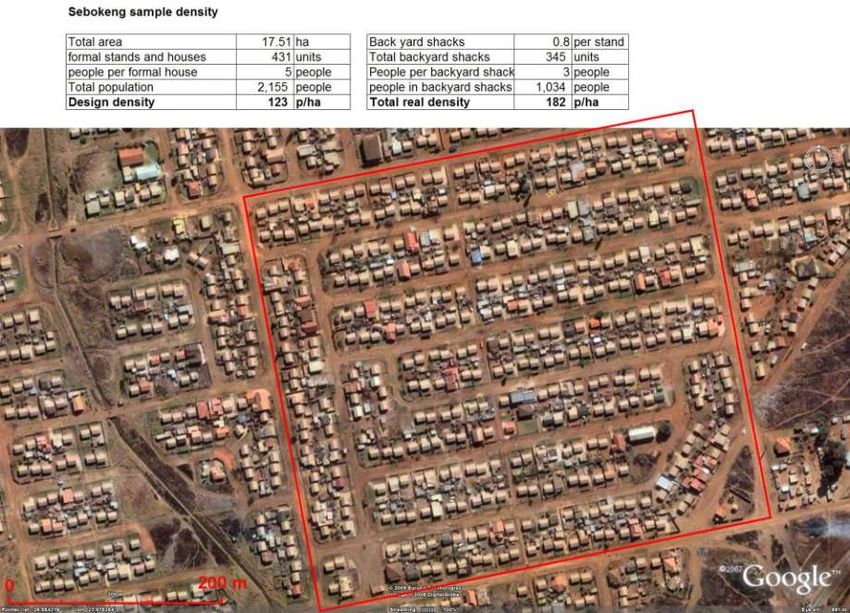
Defining spatial structure: the pattern of trips

                                                   6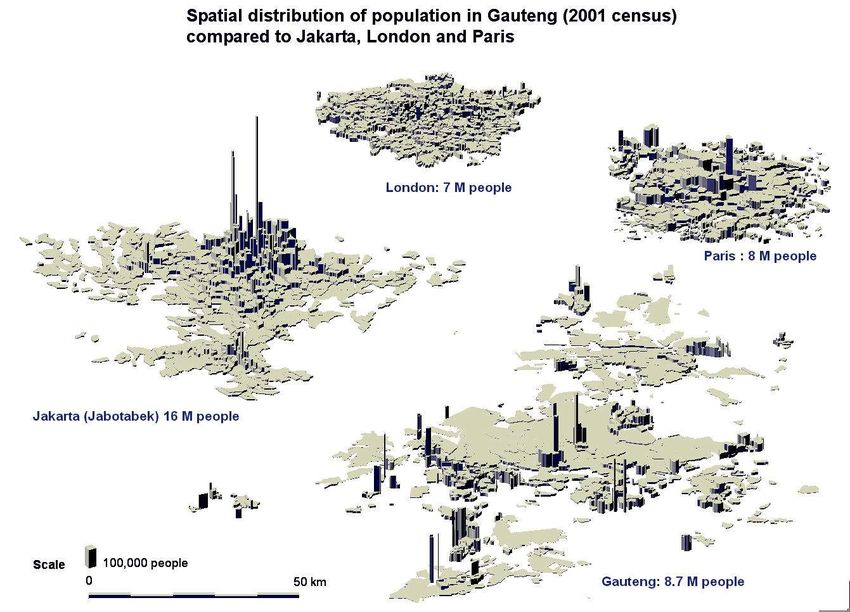
Source: Bertaud
2008
3D representation
    of the spatial
distribution of jobs
  in Gauteng area
    showing the
 dispersion of jobs
on a very wide area
    mostly in the
 center and North.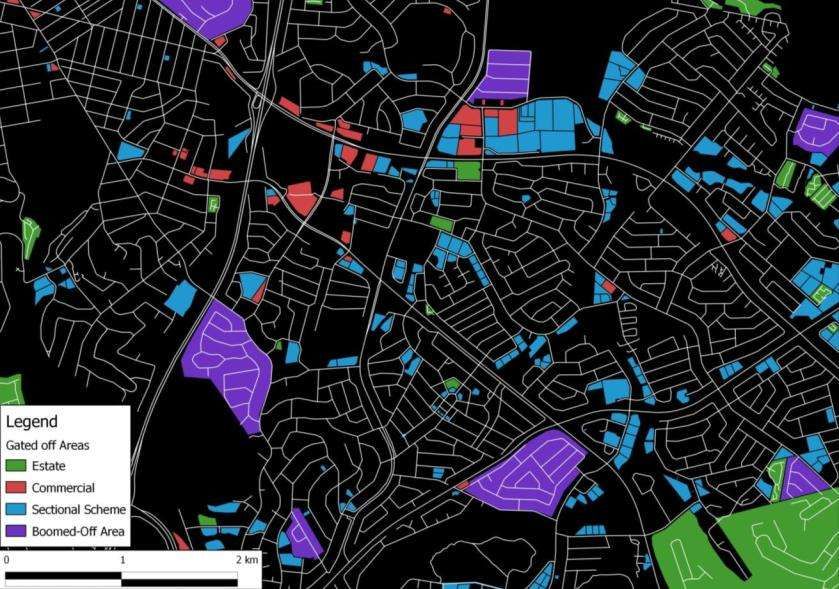
Source: Bertaud 2008

Why Networks?
Gauteng urban networks trajectory
        from Euclidean space segregation
         to topological space segregation
• From open grids segregated by spatial distance To
  closed disconnected forms segregated by spatial logic

• Disconnected and fragmented metropolitan area
  reflecting the values and spatial behavior of a
  disconnected and fragmented society

• Evolution from open connected forms (grids) where
  segregation was created by spatial distance to closed
  disconnected forms where segregation is locked in the
  urban form.
Why Urban Morphology?
• An urban morphology is defined by:
– The socio-spatial patterns of interaction between
people and activities
– The network of streets that reflects the social patterns
– The plot subdivisions
– The land use patterns
– The topography
– The built environmentAlexandra: the very low standard housing filling the vacant space within the
older formal housing is a typical example of demand driven informal housing.
13Gauteng: Sebokeng
14• Alexandra, Sebokeng, Turin and Prague
represented at the same scale (400 meters side).
• Repetition of detached identical units versus
composition of the urban fabric at different scales
• In South Africa, design densities are modified by
backyard shacks that represent demand driven land
use prevailing over designed land use but this
bottom up process fails to create an emergent urban
spatial order.What is resilience ? • Dynamic resilience: the system is able to recover from an endogenous or exogenous shock or stress • Structural resilience: the system absorbs a shock (natural catastrophe, change of civilization) by an adaptive complexification process • Adaptive resilience: The system evolves constantly far from the equilibrium and constructs new structures while keeping memory of its previous states
Key scales for urban sustainability

                   Community
    City scale                    Block scale
                     scale

  • Compact      • Walkable     • Mixed use
  • Connected    • Accessible   • Diversified
Lattice (tree) or semi-lattice
• Alexander (1965): Cities may reflect lattice (no
overlaps) or semi-lattice (overlaps)
City should
not be a tree
–
Need to allow
for social &
spatial
overlapsResilience and arborescence
Resilience and loops (The leaf paradigm)
South Africa
and Gauteng Urban System
The two charts provide quantitative
informations on the distribution of
the global urban system. The above
chart is the same as the bottom chart,
but population and rank are plotted
according to their logarithm and tend
to align.
                                   40

                                   35

                                   30            Worldwide
      City population (millions)

                                   25

                                   20

                                   15

                                   10

                                    5

                                    0
                                        0   20    40   60    80       100   120   140   160   180
                                                              City Rank
Country scale
12,000,000
10,000,000 South Korea (2010)
City population
8,000,000
17
6,000,000
4,000,000 16
2,000,000 15
0
14
Ln (pop)
0 20 40 60 80 100 y = -0.7103x + 15.622 Korea
City rank R² = 0.9908
13 Japan
Linéaire (Korea)
12
10,000,000 y = -1.0131x + 16.079 Linéaire (Japan)
9,000,000 11 R² = 0.9841
8,000,000 Japan (2010)
City Population
7,000,000 10
6,000,000 0 1 2 3 4 5
5,000,000 Ln (rank)
4,000,000
3,000,000
2,000,000
1,000,000
0
0 20 40 60 80 100 120
City rankRegional scale
17
16
15
14 Coastal
Central
25000000
13 Western
Northeastern
20000000 China (2010) 12
City population
15000000
11
10000000
10
0.00 1.00 2.00 3.00 4.00 5.00 6.00
5000000
0
0 100 200 300 400 500 600 700
City rankThe South African urban system is dual
5000000
4500000
4000000
3500000
Population
3000000
2500000
Census 2001
2000000
Census 2011
1500000
1000000
500000
0
0 2 4 6 8 10 12 14 16
RankLog Rank Log Size analysis of South African Cities in 2001
15.50 Census 2001
15.00
y = -0.2689x + 15.064
R² = 0.7422
14.50
Log Population
14.00
13.50
y = -0.759x + 15.022
R² = 0.9146
13.00
12.50
0.00 0.50 1.00 1.50 2.00 2.50 3.00
Log RankLog Rank Log Size analysis of South African Cities in 2011
15.50 Census 2011
15.00
y = -0.2511x + 15.311
R² = 0.9925
Log Population
14.50
14.00
y = -0.513x + 14.585
R² = 0.9441
13.50
13.00
0.00 0.50 1.00 1.50 2.00 2.50 3.00
Log RankGauteng spatial structure
– Differs from most other major metropolis
– Main characteristics (Bertaud 2008):
• Extremely large footprint
• High density residential settlements far away from
employment areas
• Employment areas dispersed in clusters through the
regionGauteng density map (Census 2001)
Scaling down to Tshwane
Tswahne density map (census 2001)
Source: Bertaud 2008
Density distribution in the 1000 densest km² of
                       Gauteng, out of 16,000 km² in total

                450
                400
                350                                                  More than 225 pph
                300                                                  200 to 225 pph
Density (pph)

                                                                     175 to 200 pph
                250
                                                                     150 to 175 pph
                200
                                                                     125 to 150 pph
                150                                                  100 to 125 pph
                100                                                  75 to 100 pph

                 50                                                  50 to 75 pph
                                                                     25 to 50 pph
                  0
                      0   100 200 300 400 500 600 700 800 900 1000
                                      Urban area (km²)
Comparison of Seoul (South Korea) and Gauteng in the densest 600 km².
The densest 600 km² in Seoul host more people (10 million people) than all
Gauteng 16, 000 km2 (9 million people)
450
400
350
300
Density (pph)
250
200 Seoul
150 Gauteng
100
50
0
0 100 200 300 400 500 600
Area (km²)Jobs in Gauteng are
concentrated in the
center and north but
spread over a wide area
at low job densities.
50% of jobs are located
in areas where the job
density is lower than 10
jobs per hectare.
Source: Bertaud 2008The fragmented urban spatial structure of Gauteng
and labor markets
• A labor market is efficient when it is integrated, when it is fragmented
it looses its efficiency (Bertaud 2008).
• Gauteng fragmented spatial structure fragments labor markets, and
contributes to a high unemployment rate for the poor.
• Integration of labor markets requires that all jobs be potentially
physically accessible to all adults within a reasonable commuting time
(Zahavi’s rule states 1 hour two ways, which is realized in the world
competitive cities) and at a reasonable cost (below 8% of income). The
poor cannot fully participate in the labor market when
– They are spatially dispersed beyond 1 hour commuting time from
employment areas or
– when transport costs represent more than about 8% of income;
• Spatial dispersion decreases economic opportunity for the poor and
reduces the economic efficiency of the entire city.Only when we understand the underlying factors influencing
urban morphology/fragmentation can we put our city back
together not just physically but also sociallyThe fragmented map of wealth in Tshwane
(gated communities)The fragmented map of poverty in Gauteng
The spatial distribution of households living below the poverty level in Gauteng
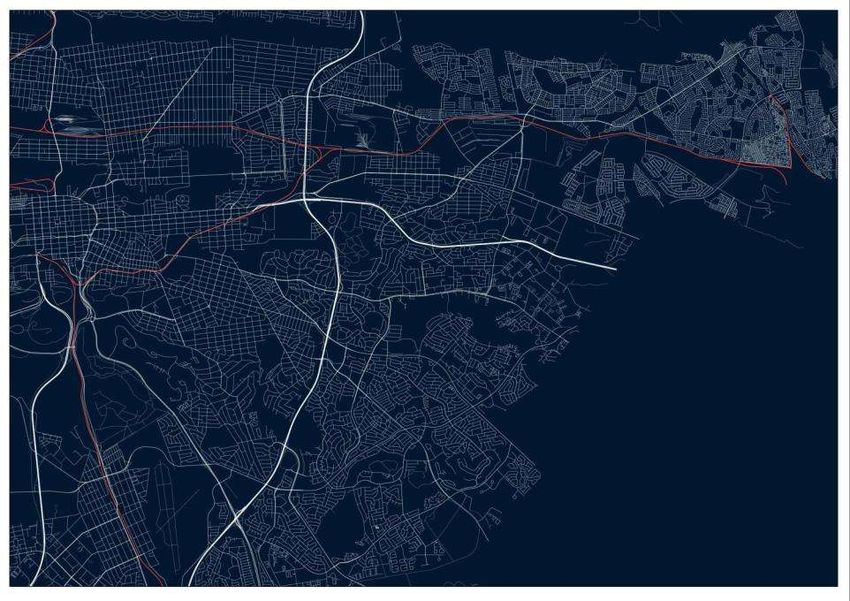
39Urban Morphology of the City of
TshwaneIntroduction • Comparative typology analysis between various areas in the City of Tshwane and International Examples Scale of analysis: • City/ Metropolitan Scale • Neighbourhood Scale • 1600m X 1600m (1 square mile) • 800m X 800m • Block and Building interface
Morphological Typology in the City of Tshwane

Case study areas
•Suburban (Irene, Brooklyn, Newlands,
    – Grid Model
    – Enclosed and Gated Communities
•Township (Mamelodi)
    – Informal Township area
    – “RDP”/ Formal Township area       Woodhill   Brooklyn   Attridgeville   Hammanskraal

•Rural (Hammanskraal)
•Inner city of Pretoria Tshwane
    – Grid model (Central Pretoria)                Zambezi
                                         CDB                   Irene           Mamelodi
    – Fine grain grid (Marabastad)
Tshwane a City of Broken Glass? devientart.com
Source: City of Tshwane IDP 2013/14
Gated communities: concentrated
 Gated off areas take up
 ±2.3% of the area of
 the City of Tshwane
Selected area of concentration
Concentration of different types
Concentration of different types
Selected study areas
Brooklyn
Brooklyn: unit of analysis
  (800 x 800 m blocks)
Does not lend itself to large
        enclosures
Irene
Irene: unit of analysis
 (800 x 800 m blocks)
Newlands
Case 2: Newlands
 (enclosed area)
Newlands: Unit of analysis
   (800 x 800m block)
Most of Pretoria east: suburban layout
The evolution of the suburban tree

  A         B       C         D

                              Salat (2012)
Silver Lakes
Silver Lakes: unit of analysis
     (800 x 800 m block)
Walnut Creek: 107 intersections Zambezi Country Estate
Walnut Creek: 107 intersections Woodhill estate
The evolution of the suburban tree
                                                                        Silver
 Indicator      What is being calculated            Brooklyn   Irene               Newlands
                                                                        Lakes
               Surface occupied by road network
 Intensity                                            9.1       15.4     24.8        37.5
                              (%)
                        Nodes per km²                 31.6      28.1     12.5        28.1
               Cyclomatic complexity of the car
                                                       25       26        11          14
                        grid (per 0.64 km²)
Connectivity       Average distance between
                                                      150       152       224        147
                    intersections car grid (m)
               External Connectivity (How easy
                                                       34        2         2          3
                is it to get outside of the area)
               The mean distance between two
                  destinations (nearest major
 Proximity                                           > 1 km    > 1 km   1 - 2 km    > 1 km
                shopping centre – straight line
                              distance)
                 The number of different uses
The evolution of the suburban tree
A B C D
Salat (2012)The evolution of the suburban tree
A B C D E
Should it be considered as a new type of urban morphology or
just the ultimate manifestation of suburbia?
Adapted from Salat (2012)The evolution of the suburban tree Evolution of modernistic planning In Tshwane
A               B               C                D                     E

    Should gated communities it be considered as a new type of
    urban morphology or just the ultimate manifestation of suburbia?
“Township” and Rural Areas
•Apartheid separation
•Economic and Social separation
•Informal vs Formal
•Formalisation ProcessesAhmedabad: 2700 intersections Hammanskraal
Ahmedabad
Ahmedabad: 2700 intersections Mamelodi
Grid Resilience & Subdivisions

 1859
                    2013
Change from open grid to closed loops
1859
2013Marabastad
40m
70mPretoria Central
240m
140mNew York CBD of Tshwane
Barcelona: 168 intersections CBD of Tshwane
Brooklyn CBD of Tshwane
Marabastad

             CBD of Tshwane
The Contrast between interface and use
Informal Trader Mobile Street Trader Chain Store/National Retailer
LEGEND Convenience Store
Individual Shop
Wholesale
Speciality Retail
Arcade/Shopping centre route 87Small Blocks with subdivisions and mixed uses
Informal Trader Mobile Street Trader Chain Store/National Retailer
LEGEND Convenience Store
Individual Shop
Wholesale
Speciality Retail
Arcade/Shopping centre route 88CBD
Thank you for your attention !
You can also read