UK Biodiversity Indicators 2019 - Fiche This document supports C6. Butterflies - JNCC Open Data
←
→
Page content transcription
If your browser does not render page correctly, please read the page content below
C6. Butterflies

   UK Biodiversity Indicators 2019

                           This document supports
                                C6. Butterflies

                                          Fiche

For further information on C6. Butterflies visit jncc.gov.uk/ukbi-C6

For further information on the UK Biodiversity Indicators visit jncc.gov.uk/ukbi

                                                                                                1
C6. Butterflies
C6. Butterflies
a. Habitat specialists
b. Species of the wider countryside
Type: State Indicator
Summary
Indicator Description
Since 1976, the unsmoothed habitat This indicator consists of 2 measures of
specialist butterflies index has fallen by 68% annual butterfly population abundance:
(Figure C6a). the first for habitat specialist butterflies
(species strongly associated with semi-
Over the same period, the unsmoothed
natural habitats such as chalk downland)
index for species of the wider countryside has and the second for more widespread
fallen by 30% (Figure C6b). butterflies found in both semi-natural
Large fluctuations in numbers between habitats and the wider countryside.
years are typical features of butterfly populations, Butterflies are complementary to birds
principally in response to weather conditions. The and bats as an indicator, especially the
summer heatwave of 2018 meant that last year habitat specialists, because they use
was a better year for butterflies in the UK; ranked resources in the landscape at a much
18th in the 43-year series, with more than two- finer spatial scale than either of these
thirds of species increasing in annual abundance. groups.
The statistical assessment of change is made on an analysis of the underlying
smoothed trends. Since 1976, populations of habitat specialists and species of the wider
countryside have declined significantly but since 2013, both trends show no significant
change.
Habitat Specialists
Figure C6a. Trends for habitat specialist butterflies in the UK, 1976 to 2018.
Notes:
1. The line graph shows the unsmoothed trend (dashed line) and the smoothed trend (solid line)
together with its 95% confidence interval (shaded).
2. The figure in brackets shows the number of species included in the index.
3. The bar chart shows the percentage of species within the indicator that have shown a
statistically significant increase, a statistically significant decrease or no statistically significant
change.
4. Since 2017, an improved analysis method has been used to derive the species indices (see
‘Background’ section for further information).
2C6. Butterflies
5. The line graph is not directly comparable to those appearing in previous versions of this
publication. Improvements in the modelling technique have allowed the inclusion of more
data; this has resulted in slight alterations to the trends for individual species and the
composite trend.
Source: Butterfly Conservation, Centre for Ecology & Hydrology, Defra, Joint Nature Conservation
Committee.
Habitat specialist species, which are vulnerable to semi-natural habitat loss and
fragmentation, have not recovered from declines experienced in the late 1970s. These
declines were mainly attributed to the knock-on effects of the drought conditions experienced
in 1976. The unsmoothed habitat specialist index declined by 68% between 1976 and 2018
(Figure C6a). Underlying analysis shows that this decrease was due to a statistically
significant reduction in relative abundance over the period 1976 to 1996 that was more
pronounced in the late 1970s and early 1990s. The index showed an increase over the
period 2013 to 2018, from 28% to 32% of the 1976 level, however, this short-term change is
not statistically significant.
Individual butterfly species fare differently within the overall trend. Habitat specialists
showing the greatest decline since 1976 include: heath fritillary, wood white, Lulworth
skipper, pearl-bordered fritillary and grayling. Lulworth skipper and chalkhill blue show a
short-term decline since 2013. Silver-spotted skipper, large heath, dark green fritillary,
adonis blue and silver-washed fritillary show significant increases over the long term, whilst
black hairstreak is the only habitat specialist species to show a statistically significant
increase since 2013.
Species of the wider countryside
Figure C6b. Trends for butterflies of the wider countryside in the UK, 1976 to 2018.
Notes:
1. The line graph shows the unsmoothed trend (dashed line) and the smoothed trend (solid line)
together with its 95% confidence interval (shaded).
2. The figure in brackets shows the number of species included in the index.
3. This indicator includes individual measures for 25 species of butterflies; the wider countryside
index, however, only includes 24 trends. This is because an aggregate trend is used for small
skipper (Thymelicus lineola) and Essex skipper (Thymelicus sylvestris); these 2 species have
been combined due to historical difficulties with distinguishing them in the field.
4. The bar chart shows the percentage of species within the indicator that have shown a
statistically significant increase, a statistically significant decrease or no statistically significant
change.
5. Since 2017, an improved analysis method has been used to derive the species indices (see
‘Background’ section for further information).
3C6. Butterflies
6. The line graph is not directly comparable to those appearing in previous versions of this
publication. Improvements in the modelling technique have allowed the inclusion of more
data; this has resulted in slight alternations to the trends for individual species and the
composite trend.
Source: British Trust for Ornithology, Butterfly Conservation, Centre for Ecology & Hydrology, Defra,
Joint Nature Conservation Committee.
The unsmoothed species of the wider countryside index decreased by 30% between 1976
and 2018 (Figure C6b); the underlying analysis indicates that this decrease was chiefly due
to a statistically significant reduction in abundance over the period 1976 to 2001. The index
showed an increase over the period 2013 to 2018, from 67% to 70% of the 1976 level,
however, this short-term change is not statistically significant.
Individual butterfly species again fare differently within the overall trend. Species of the wider
countryside showing the greatest declines since 1976 include: white-letter hairstreak, wall,
small tortoiseshell, purple hairstreak and small heath; small tortoiseshell and peacock both
show a short-term decline since 2013. Ringlet, comma, speckled wood and marbled white all
show increases over the long term; holly blue is the only species of the wider countryside to
show a short-term increase since 2013.
Assessment of change in butterfly populations
Long term Short term Latest year
Habitat specialists Increased (2018)
1976–2018 2013–2018
Species of the wider countryside Increased (2018)
1976–2018 2013–2018
Note:
While percentage changes in these indices are reported based on the most recent unsmoothed data
point (2018), the formal long-term and short-term assessments of the statistical significance of these
changes are made using the smoothed data to 2018. Analysis of the underlying trends is undertaken
by the data providers.
Relevance
Butterflies respond rapidly to changes in environmental conditions and habitat management,
occur in a wide range of habitats, and are representative of many other insects, in that they
utilise areas with abundant plant food resources. Butterflies are complementary to birds and
bats as indicator species, especially the habitat specialists, because they use resources in
the landscape at a much finer spatial scale than either of those groups.
Background
This indicator is comprised of 2 multi-species indices compiled by Butterfly Conservation
(BC) and the Centre for Ecology & Hydrology (CEH) from data collated through the UK
Butterfly Monitoring Scheme (UKBMS) including from the Wider Countryside Butterfly
Monitoring Survey (WCBS). The indicator includes individual measures for 26 habitat
specialist butterflies (low mobility species restricted to semi-natural habitats) and 25 more
widespread butterflies which use both semi-natural and general countryside habitats using
data collected at 5,480 sample locations (see Figure C6i). The wider countryside measure,
however, only includes 24 trends because an aggregate trend is used for small skipper
(Thymelicus lineola) and Essex skipper (Thymelicus sylvestris). These 2 species have been
combined due to historical difficulties with distinguishing them in the field.
4C6. Butterflies
The year-to-year fluctuations in butterfly numbers are often linked to natural environmental
variation, especially weather conditions. Therefore, in order to identify underlying patterns in
population trends, the assessment of change is based on smoothed indices. The smoothed
trend in the multi-species indicator is assessed by structural time-series analysis. A
statistical test is performed using the software ‘TrendSpotter’ to compare the difference in
the smoothed index in the latest year versus other years in the series. Within the measures,
each individual species trend is given equal weight, and the annual figure is the geometric
mean of the component species indices for that year.
Populations of individual species within each measure may be increasing or decreasing,
irrespective of the overall trends. The bar chart provided alongside each trend graph above
shows the percentage of species within that indicator that have shown a statistically
significant increase, a statistically significant decrease or no statistically significant change. A
list of species included within each index, together with a summary of the estimated long-
term and short-term changes for each species and an assessment of the individual species
trends can be found in the accompanying dataset.
The method for compiling species annual indices was improved in 2017 and is used again
here. Indices are calculated for all species using the Generalised Abundance Index (GAI)
method developed by Dennis et al. (2016) with an additional modification that the data from
each site in each year is weighted in the final stage relative to the proportion of the species
flight period surveyed that year for that site. This weighting is necessary as the GAI
extrapolates from observed data to estimate the total count across the season, accounting
for gaps in the recording, and ensures that the observed data have a stronger effect upon
the final indices than the extrapolated data.
The new method uses all butterfly counts collected at both UKBMS sites (3,443 compared
with 2,383 in 2014) and randomly selected 1km squares of the Wider Countryside Butterfly
Survey (2,037) (see Figure C6i. for the locations of these sites). The method uses all
butterfly counts in a season to estimate the seasonal pattern of butterfly counts for that year,
using a concentrated likelihood method (see Dennis et al. (2016)); the resulting indices and
species trends are similar to those generated through previous analysis methods.
Since 2015, the site index data has been incorporated into the models; these data are most
prevalent in earlier years and thus the graphs are slightly different to those previously
presented. As there are delays in data submission, data for previous years are also updated
retrospectively; in 2018 extra data were added for 2016 and 2017, for example. This means
that the species indices for individual years may vary from previous publications. Further
details of the methods used can be found on the UKBMS website and in the Technical
background document for this indicator.
In 2019, 2 additional multi-species indices were compiled for butterflies in the UK: the first for
butterflies of the wider countryside on farmland, the second for butterflies of the wider
countryside in woodland. Although these new habitat-specific measures are not included
within the formal assessment for ‘Butterflies in the United Kingdom: habitat specialists and
species of the wider countryside’, they are presented here in order to give a more complete
picture of the trends for UK butterfly populations.
The new indices include individual trends for 22 species of wider countryside butterflies
found on farmland and 24 species found in woodland; they use data collected at 3,963
locations with farmland habitat and 2,723 locations with woodland habitat (these farmland
and woodland locations are subsets of the 5,480 locations shown in Figure C6i). A list of
species included within each index, together with a summary of the estimated long-term and
short-term changes for each species and an assessment of the individual species trends can
be found in the accompanying dataset.
5C6. Butterflies
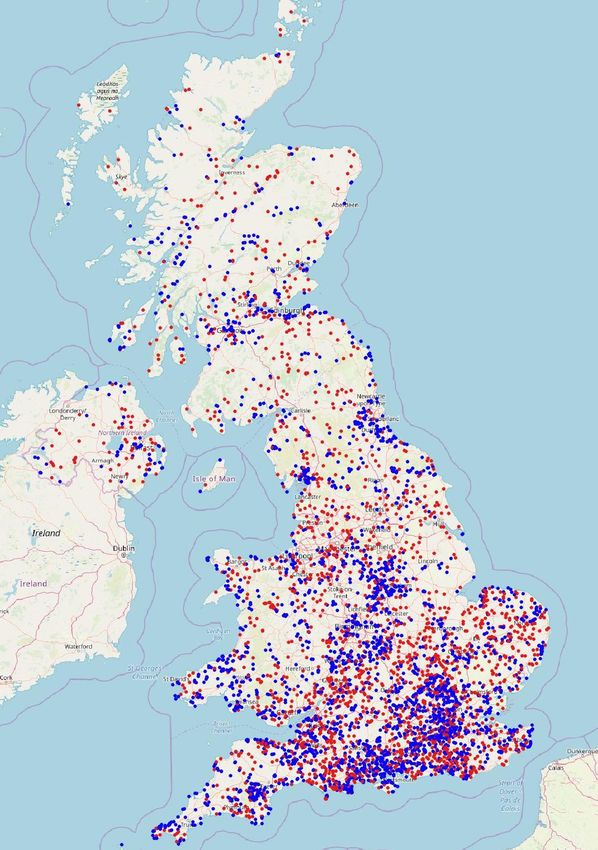
Figure C6i. Locations of the 3,443 UK Butterfly Monitoring Scheme sites (blue) and the
2,037 Wider Countryside Butterfly Monitoring Survey squares (red) as at 9 May 2019.
6C6. Butterflies
The assessment of change for these additional measures is made on an analysis of the
underlying smoothed trends, however, the base year for the long-term trends is 1990. This is
because prior to this date, there are insufficient data for a number of species included within
the 2 indices. Since 1990, UK populations of wider countryside butterflies on farmland and in
woodland have declined significantly but since 2013, the trend for farmland butterflies has
continued to decline, whereas the trend for woodland butterflies has shown no statistically
significant change.
Butterflies of the wider countryside on farmland
The unsmoothed butterflies of the wider countryside on farmland index for the UK decreased
by 3% between 1990 and 2018. The index also decreased in the 5 years to 2018, from 3%
above its 1990 level in 2013 to 3% below this level in 2018 (Figure C6ii).
Figure C6ii. Trends for butterflies of the wider countryside on UK farmland, 1990 to
2018.
Notes:
1. The line graph shows the unsmoothed trend (dashed line) and the smoothed trend (solid line)
together with its 95% confidence interval (shaded).
2. The figure in brackets shows the number of species included in the index.
3. This indicator includes individual measures for 23 species of butterflies; the UK farmland
index, however, only includes 22 trends. This is because an aggregate trend is used for small
skipper (Thymelicus lineola) and Essex skipper (Thymelicus sylvestris); these 2 species have
been combined due to historical difficulties with distinguishing them in the field.
4. The bar chart shows the percentage of species within the indicator that have shown a
statistically significant increase, a statistically significant decrease or no statistically significant
change.
Source: Butterfly Conservation, Centre for Ecology & Hydrology, Defra, Joint Nature Conservation
Committee.
Individual butterfly species fare differently within the overall declining long-term trend.
Species in significant long-term decline on farmland include: white-letter hairstreak, wall,
small tortoiseshell, gatekeeper, small copper, small/Essex Skipper, large skipper and
peacock. Of these, small tortoiseshell and peacock have also decreased over the short term
since 2013. Three species, the ringlet, speckled wood and brimstone, increased over the
long term but showed no short-term change. Holly blue is the only farmland species in the
UK to have increased since 2013.
7C6. Butterflies
Butterflies of the wider countryside in woodland
The unsmoothed butterflies of the wider countryside in woodland index for the UK decreased
by 38% between 1990 and 2018 but increased in the 5 years to 2018, from 54% of its 1990
level in 2013 to 62% of its 1990 level in 2018 (Figure C6iii).
Figure C6iii. Trends for butterflies of the wider countryside in UK woodland, 1990 to
2018.
Notes:
1. The line graph shows the unsmoothed trend (dashed line) and the smoothed trend (solid line)
together with its 95% confidence interval (shaded).
2. The figure in brackets shows the number of species included in the index.
3. This indicator includes individual measures for 25 species of butterflies; the UK woodland
index, however, only includes 24 trends. This is because an aggregate trend is used for small
skipper (Thymelicus lineola) and Essex skipper (Thymelicus sylvestris); these 2 species have
been combined due to historical difficulties with distinguishing them in the field.
4. The bar chart shows the percentage of species within the indicator that have shown a
statistically significant increase, a statistically significant decrease or no statistically significant
change.
Source: Butterfly Conservation, Centre for Ecology & Hydrology, Defra, Joint Nature Conservation
Committee.
The long-term decline of woodland butterflies is thought to be due to a lack of woodland
management and loss of open spaces in woods. Species in long-term decline in woodland
include: wall, small tortoiseshell, small copper, white-letter hairstreak, small/Essex skipper,
gatekeeper, small heath and peacock, with the small tortoiseshell also peacock also
undergoing a significant decline in the short term. Ringlet displayed the same trends in
woodland as in farmland, increasing significantly over the long term, but showing no
significant change since 2013.
Goals and targets
Aichi Targets for which this is a primary indicator
Strategic Goal B. Reduce the direct pressures on biodiversity and promote sustainable use.
Target 7: By 2020, areas under agriculture, aquaculture and forestry are
managed sustainably, ensuring conservation of biodiversity.
8C6. Butterflies
Strategic Goal C. To improve the status of biodiversity by safeguarding ecosystems,
species and genetic diversity.
Target 12: By 2020, the extinction of known threatened species has been
prevented and their conservation status, particularly of those most in decline, has been
improved and sustained.
Aichi Targets for which this is a relevant indicator
Strategic Goal B. Reduce the direct pressures on biodiversity and promote sustainable use.
Target 5: By 2020, the rate of loss of all natural habitats, including forests, is at
least halved and where feasible brought close to zero, and degradation and fragmentation
is significantly reduced.
Strategic Goal C. To improve the status of biodiversity by safeguarding ecosystems,
species and genetic diversity.
Target 11: By 2020, at least 17 per cent of terrestrial and inland water, and 10 per
cent of coastal and marine areas, especially areas of particular importance for biodiversity
and ecosystem services, are conserved through effectively and equitably managed,
ecologically representative and well connected systems of protected areas and other
effective area-based conservation measures, and integrated into the wider landscape and
seascapes.
Web links for further information
Reference Title Website
https://butterfly-
The state of Britain’s
Butterfly Conservation conservation.org/butterflies/the-state-
butterflies
of-britains-butterflies
UK Butterfly Monitoring
Butterflies as indicators http://www.ukbms.org/indicators.aspx
Scheme
References
Dennis, E. B., Morgan, B. J. T., Freeman, S. N., Brereton, T. & Roy, D. B. (2016). A
generalized abundance index for seasonal invertebrates. Biometrics, 72(4), 1305–1314,
https://doi.org/10.1111/biom.12506.
Full details of this indicator, including a datasheet and technical documentation are
available at: jncc.gov.uk/ukbi-C6
Last updated: September 2019
Latest data available: 2018
9You can also read