ST HELEN'S ELECTORAL DIVISION PROFILE 2021 - www.suffolkobservatory.info - Suffolk Observatory
←
→
Page content transcription
If your browser does not render page correctly, please read the page content below
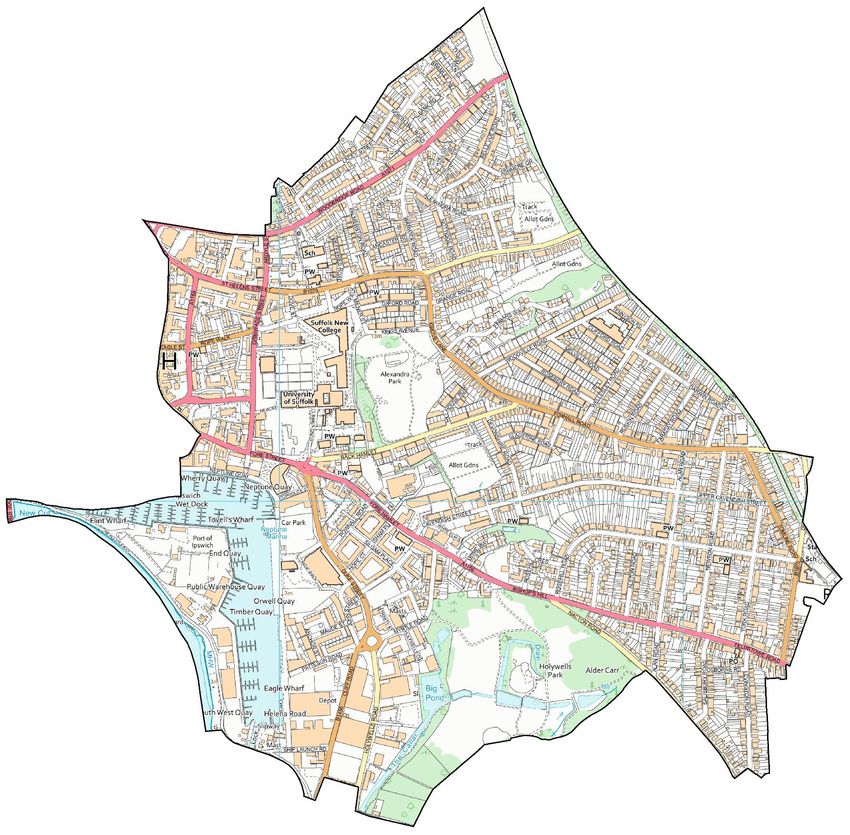
ST HELEN’S
ELECTORAL DIVISION PROFILE 2021
This Division comprises part of Alexandra and Holywells Wards

           www.suffolkobservatory.info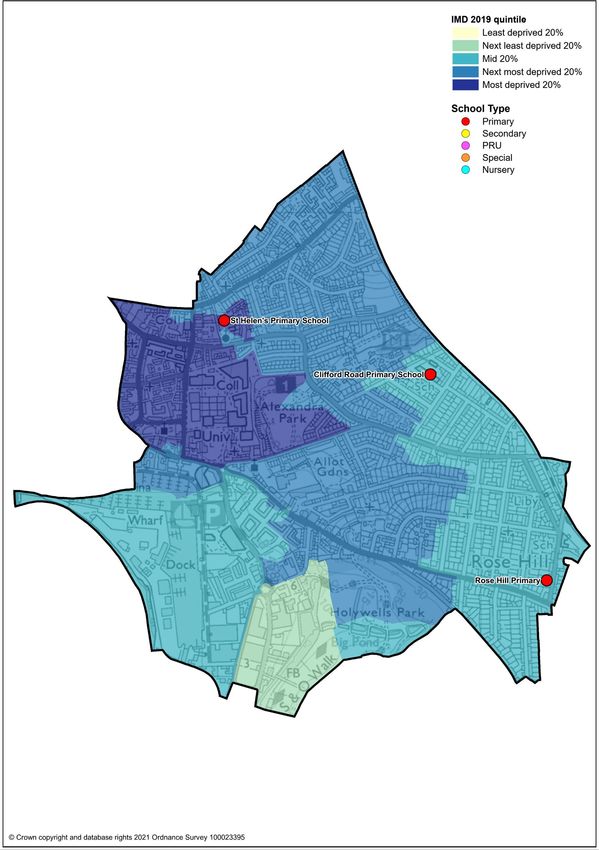
© Crown copyright and database rights 2021 Ordnance Survey 100023395

                                              2
CONTENTS
▪ Demographic Profile: Age & Ethnicity
▪ Economy and Labour Market
▪ Schools & NEET
▪ Index of Multiple Deprivation
▪ Health
▪ Crime & Community Safety
▪ Additional Information
▪ Data Sources
3ELECTORAL DIVISION PROFILES: AN INTRODUCTION
These profiles have been produced to support elected members, constituents and other
interested parties in understanding the demographic, economic, social and educational
profile of their neighbourhoods. We have used the latest data available at the time of
publication.
Much more data is available from national and local sources than is captured here, but it is
hoped that the profile will be a useful starting point for discussion, where local knowledge and
experience can be used to flesh out and illuminate the information presented here.
The profile can be used to help look at some fundamental questions e.g.
• Does the age profile of the population match or differ from the national profile?
• Is there evidence of the ageing profile of the county in all the wards in the Division or just
some?
• How diverse is the community in terms of ethnicity?
• What is the impact of deprivation on families and residents?
• Does there seem to be a link between deprivation and school performance?
• What is the breakdown of employment sectors in the area?
• Is it a relatively healthy area compared to the rest of the district or county?
• What sort of crime is prevalent in the community?
A vast amount of additional data is available on the Suffolk Observatory
www.suffolkobservatory.info
The Suffolk Observatory is a free online resource that contains all Suffolk’s vital statistics; it is
the one-stop-shop for information and intelligence about Suffolk. Through data, reports and
maps, the Suffolk Observatory provides a comprehensive picture of the County. It is a great
source for useful facts and figures that can be used for writing reports and presentations,
informing strategic and business planning, preparing funding applications or supporting
academic research. Data is presented around the key themes of population, children and
young people, health and social care, housing, crime and community safety, deprivation,
economy and employment and environment. All areas of the county are covered, right down
to district, electoral division, ward and parish level, with information easily accessible in a
variety of formats. You can also build your own reports for custom areas.
Technical Notes:
1. Where electoral divisions do not exactly match the boundaries at which the data is
available (e.g. ward, Output Area or Lower Super Output Area), we have adopted a
“best-fit” approach to produce a dataset.
2. District, county and national level data is provided where possible to provide a context
for comparisons. Where possible we have used the most recent district boundaries for
comparison purposes, but in some cases it has been necessary to use the pre-2019
districts.
4DEMOGRAPHIC PROFILE - AGE
In mid-2019, the population of St Helen’s stood at 12,212, an increase of 4.9% since the
2011 Census. The age structure of the division is set out below.
St. Helen's Division Holywells Alexandra
All Ages 12,212 6,440 5,772
0-4 784 448 336
5-9 800 383 417
10-14 622 316 306
15-19 625 283 342
20-24 1,151 635 516
25-29 1,167 677 490
30-34 1,183 625 558
35-39 1,095 579 516
40-44 872 452 420
45-49 796 389 407
50-54 865 424 441
55-59 618 340 278
60-64 478 249 229
65-69 382 206 176
70-74 305 178 127
75-79 169 92 77
80-84 148 67 81
85-89 93 65 28
90+ 59 32 27
90+
85-89
80-84
75-79
70-74
65-69
60-64
55-59
50-54
45-49
40-44
35-39
30-34
25-29
20-24
15-19
10-14
5-9
0-4
12% 8% 4% 0% 4% 8% 12%
England - females England - males St. Helen's - females St. Helen's - males
▪ The age pyramid for St Helen’s shows a much higher than average proportion of people
between the ages of 20 and 44. The division has a relatively young age profile.
▪ The most common age group in St Helen’s is 30-34, followed by 25-29.
5▪ Currently, there is a much lower than average proportion of people of retirement age, and
much higher proportions of people or working age than nationally.
▪ There is also a higher-than-average population aged under 10 in the division.
ETHNICITY
100%
90%
80%
70%
60%
50%
40%
30%
20%
10%
0%
St. Helen's Ipswich Suffolk England
▪ According to the latest data (2011 Census), 84.9% (9,884 people) of the population are
white, which is well below the percentage for Suffolk.
▪ There are 1,761 (15.1%) people of minority ethnic origin in the division, more than three
times the proportion for the county overall.
▪ St Helen’s has a diversity profile that is more similar to the England average, with much
higher proportions of minority ethnic populations than seen across Suffolk and even
Ipswich.
Total
Asian and Black and Other
All Minority
White White British Mixed Asian Black Ethnic
people Ethnic
British British Group
population
Count Count % Count % Count % Count % Count % Count % Count %
St. Helen's 11,645 9,884 84.9 8,775 75.4 459 3.9 922 7.9 311 2.7 69 0.6 1,761 15.1
Ipswich 133,384 118,596 88.9 110,624 82.9 4,816 3.6 5,740 4.3 3,096 2.3 1,136 0.9 14,788 11.1
Suffolk 728,163 693,195 95.2 661,458 90.8 12,472 1.7 13,131 1.8 6,854 0.9 2,511 0.3 34,968 4.8
England 85.4 79.8 2.3 7.8 3.5 1.0 14.6
6ECONOMY
There are 10,200 people employed in St Helen’s.
20%
18%
16%
14%
12%
10%
8%
6%
4%
2%
0%
St. Helen's Ipswich Suffolk England
▪ The key employment sectors in St Helen’s division are business administration and
support services, education, accommodation and food services and wholesale, retail and
motor trades.
▪ These four sectors combined account for just over half of all jobs in the division.
▪ The primary industries and utilities and other services sectors are also overrepresented in
the division.
7LABOUR MARKET
OUT-OF-WORK BENEFIT CLAIMANT RATE
10%
9%
8%
7%
6%
5%
4%
3%
2%
1%
0%
Jan-18
Mar-18
Jun-18
Jul-18
Jan-19
Mar-19
Jun-19
Jul-19
Jan-20
Mar-20
Jun-20
Jul-20
Jan-21
Feb-18
Feb-19
Feb-20
Apr-18
Aug-18
Sep-18
Nov-18
Dec-18
Aug-19
Sep-19
Nov-19
Dec-19
Aug-20
Sep-20
Nov-20
Dec-20
Oct-18
May-18
Apr-19
May-19
Oct-19
Apr-20
May-20
Oct-20 St. Helen's Ipswich Suffolk England
▪ St Helen’s saw a sharp increase in claimants of out-of-work benefits in the first half of
2020 as a result of the COVID-19 pandemic.
▪ St Helen’s has consistently had a higher proportion of working age residents claiming out-
of-work benefits compared to Ipswich and Suffolk overall.
▪ In percentage terms, the claimant unemployment rate in St Helen’s is around 8.9%
according to the latest available data (January 2021). This is around 1.7 percentage
points above the Ipswich level and 4 percentage points clear of the Suffolk average.
8SCHOOLS
SCHOOL INFORMATION
Schools in the Division
Average cohort size at:
Stage (age 5)
KS2 (age 11)
KS4 (age 16)
KS5 (age 18)
Foundation
Academy
Status
Latest
Latest Ofsted Ofsted
Date
Name Phase
Clifford Road
Primary LA 59 59 0 0 Good 05/06/2015
Primary School
Requires
Rose Hill Primary Primary AC 44 44 0 0 02/12/2016
improvement*
St Helen's Primary
Primary AC 60 60 0 0 Good* 14/03/2012
School
Schools with catchments that overlap with the Division
Average cohort size at:
Stage (age 5)
KS2 (age 11)
KS4 (age 16)
KS5 (age 18)
Foundation
Academy
Status
Latest
Latest Ofsted Ofsted
Date
Name Phase
Cliff Lane Primary Requires
Primary AC 55 58 0 0 29/01/2020
School improvement
Hillside Primary Requires
Primary AS 79 68 0 0 01/10/2019
School improvement
Copleston High School Secondary AC 0 0 287 145 Good 25/04/2013
Ipswich Academy Secondary AS 0 0 124 13 Good 06/03/2019
Northgate High School Secondary LA 0 0 228 241 Good 17/05/2012
Stoke High School - Requires
Secondary AS 0 0 124 0 09/03/2018
Ormiston Academy improvement
Academy Status key: AS = Academy Sponsored, AC = Academy Converter, LA = LA
Maintained, F = Free
*The latest full inspection judgement does not relate to the current school
9SCHOOL ATTAINMENT
Foundation Stage Profile (reception)
% pupils achieving Good Level of Development
90%
80%
70%
60%
50%
40%
30%
20%
10%
0%
2017 2018 2019
Clifford Road Primary School Rose Hill Primary St Helen's Primary School
Suffolk National
▪ Foundation Stage attainment in St Helen’s has been generally high over the last three
years of available data.
▪ Pupil attainment at both Clifford Road and Rose Hill Primary schools has been
consistently above the county and national benchmarks from 2017 to 2019.
▪ Attainment has been consistently below average at St Helen’s Primary School, but in
2017 and 2019 it was only a few percentage points short of the county and national
levels.
10Key Stage 2 (age 11)
% pupils achieving the Expected Level or better in Reading, Writing and Mathematics
80%
70%
60%
50%
40%
30%
20%
10%
0%
2017 2018 2019
Clifford Road Primary School Rose Hill Primary St Helen's Primary School
Suffolk National
▪ All three schools in St Helen’s achieved attainment levels similar to or above the county
and national averages from 2017 to 2019.
▪ Pupil attainment at Clifford Road Primary School improved year on year during this
period, culminating in an above-average figure of 72% of pupils achieving the expected
level or better in reading, writing and mathematics in 2019.
▪ St Helen’s Primary School has seen KS2 attainment above the county average each year
from 2017 to 2019. It was also above the national average in the two most recent years of
available data.
▪ Pupil attainment at Rose Hill Primary School did not exceed the national average during
this period, but was higher than the Suffolk average in 2017 and 2018 and matched the
national benchmark in the latter year.
Key Stage 4 (GCSE) (age 16) and Key Stage 5 (A Level) (age 18)
There are no Upper Schools located within the division
11NEET % (NOT IN EDUCATION, EMPLOYMENT OR TRAINING)
10%
9%
8%
7%
6%
5%
4%
3%
2%
1%
0%
St. Helen's Ipswich Suffolk
▪ In January 2021, 3.3% of 16–18-year-olds in St Helen’s were classified as NEET (where
current activity is known).
▪ NEET levels in St Helen’s have tended to be very similar to the Ipswich average but have
dipped nearer to the Suffolk level in recent months.
12INDEX OF MULTIPLE DEPRIVATION (IMD) 2019 (SEE MAP
OVERLEAF)
The IMD combines a number of indicators, chosen to cover a range of economic, social and
housing issues, into a single deprivation score for each small area in England. This allows
each area to be ranked relative to one another according to their level of deprivation. Small
areas (Lower Super Output Areas, average population 1,700) are most commonly described
as being in 1 of 5 quintile bands. The bottom quintile represents the 20% of areas that are
the most deprived in England; these are shaded pale yellow on the map. The top quintile
represents the least deprived areas in England and is shaded dark blue.
The Index is widely used to analyse patterns of deprivation, identify areas that would benefit
from special initiatives or programmes and as a tool to determine eligibility for specific
funding streams.
60%
% of population by deprivation quintile of residence
50%
40%
30%
20%
10%
0%
Most deprived 20% Next most deprived Mid 20% Next least deprived Least deprived 20%
20% 20%
St. Helen's Ipswich England
▪ The IMD 2019 shows that relative deprivation levels in St Helen’s are generally moderate
to high.
▪ Of the seven Lower Super Output Areas in St Helen’s, three fall into the mid 20%
(accounting for 38% of the population of the division), one is in the most deprived quintile
(11% of the population live in these areas) and four are in the next most deprived quintile
(over half of the population live in these LSOAs).
1314
HEALTH
The local data used here is based on relatively small numbers. The confidence limits provide
an indication of the reliability of the data. The 95% confidence intervals utilised on the chart
provide a range within which there is 95% chance of the true result lying.

LIFE EXPECTANCY AT BIRTH
    86
    85
    84
    83
    82
    81
    80
    79
    78
    77
    76
    75
                  St. Helen's                   Ipswich                         Suffolk                      England

                            Life expectancy at birth for males        Life expectancy at birth for females

▪        Estimated life expectancy at birth for both males and females in St Helen’s division is
         similar to the national average, but slightly below the Suffolk county figures.
▪        Life expectancy at birth for males in St Helen’s is 80.6 years, slightly below the county
         average of 80.9.
▪        For females the estimated life expectancy at birth in the division is 83.4 years, almost one
         year below the Suffolk figure of 84.3.

DEATHS, UNDER 75 YEARS, STANDARDISED MORTALITY RATIO
    160
    140
    120
    100
     80
     60
     40
     20
      0
             Deaths from all causes,    Deaths from all cancers,      Deaths from circulatory        Deaths from causes
                under 75 years              under 75 years            disease, under 75 years     considered preventable (all
                                                                                                            ages)

                                           St. Helen's    Ipswich     Suffolk      England

▪        The estimated rate of deaths from all causes in those under 75 years in St Helen’s is
         below the figure for Ipswich, Suffolk and England.
▪        The standardised mortality ratio data shown here means that for every 100 early deaths
         from all causes across England as a whole, there are an estimated 82 comparable deaths
         in St Helen’s.
▪        Deaths from causes considered preventable across all ages are estimated to be slightly
         above average in the division.
▪        It should be noted that the confidence intervals around these data are very wide due to
         the small number of deaths at the local level.
                                                                 15
CRIME & COMMUNITY SAFETY
140
120
100
80
60
40
20
0
St. Helen's Ipswich Suffolk England
Burglary Criminal damage and arson Drugs
Public order Shoplifting Other theft
Vehicle crime Violence and sexual offences Other
▪ The overall crime rate in St Helen’s is above the Ipswich average and around double the
Suffolk level.
▪ In the year to the end of January 2021, there were 127 crimes recorded per 1,000
residents in St Helen’s compared to 102 in Ipswich and 66 across Suffolk as a whole.
▪ Violence and sexual offences is the most commonly recorded type of crime in the
division, followed by public order offences and shoplifting.
▪ All types of crime occur at a higher rate in the division than in the comparator areas used
here.
ADDITIONAL INFORMATION
Parishes in Division
Ipswich (part)
16DATA SOURCES
Category Indicator Source
ONS 2019 mid-year population
Quinary population table 2019
estimates
Demographic ONS 2019 mid-year population
Population pyramid 2019
Profile estimates
Ethnicity 2011 ONS 2011 Census
ONS Business Register and
Economy Employment by broad industrial sector 2019 Employment Survey via
NOMIS
Claimant count: The number of people claiming
Jobseeker's Allowance plus those who claim
Labour market DWP via NOMIS
Universal Credit who are out of work (% 16-64
population) January 2018- February 2021
School information and attainment 2017-2019 Suffolk County Council
Education % 16-18-year-olds NEET (Not in Employment, Suffolk County Council via the
Education or Training) 2017-2021 Suffolk Observatory
Ministry for Housing,
Deprivation Index of Multiple Deprivation 2019 Communities and Local
Government
Health Life expectancy at birth 2013-2017 Public Health England
Standardised mortality ratio for deaths from all
causes, cancer and circulatory disease, (aged
under 75), and death from causes considered
Health preventable (all ages), 2013-2017. The Public Health England
standardised mortality ratio is the ratio of
observed deaths in the study group to expected
deaths in the general population.
Community Recorded crime rate per 1,000 resident Data.police.uk via the Suffolk
Safety population February 2020 to January 2021 Observatory
For more data and information about St Helen’s Electoral Division, see the Suffolk
Observatory www.suffolkobservatory.info
1718
You can also read