RAPID STATUS UPDATE: COVID-19 EPIDEMIC TRENDS AND SCENARIO PROJECTIONS IN OREGON
←
→
Page content transcription
If your browser does not render page correctly, please read the page content below
RAPID STATUS UPDATE: COVID-19
EPIDEMIC TRENDS AND SCENARIO
PROJECTIONS IN OREGON
Results as of 10-8-2021, 11:15am

PURPOSE OF THIS RAPID STATUS UPDATE
This Rapid Status Update focuses more narrowly on modeling results than our typical
Status Updates, but still uses numerous measures to create the most accurate picture
of past COVID-19 transmission and incidence of infection over time in Oregon and
projecting possible trends over the next month assuming different scenarios. This report
complements the extensive epidemiologic data (e.g., demographic trends in cases,
testing patterns) for Oregon available at the OHA COVID-19 webpage.

RESULTS UPDATED REGULARLY
Please note that the COVID-19 data used for the modeling are continually being
updated. (For daily up-to-date information, visit the OHA COVID-19 webpage.) The
results in this report will continue to be updated as more data become available, the
science to inform the model assumptions expands, and modeling methods continue to
be refined. Point estimates should be interpreted with caution due to considerable
uncertainty behind COVID-19 model assumptions and limitations to the methods.

ACKNOWLEDGEMENTS
OHA wishes to thank the Institute for Disease Modeling (IDM) for their support. Niket
Thakkar at IDM has provided software, programming scripts, and technical assistance.
This report is based on aspects of IDM’s technical reports (IDM COVID Reports) and
Washington State Department of Health’s COVID-19 Situation Reports (WA Situation
Reports), adapted for Oregon.

                                                                                        1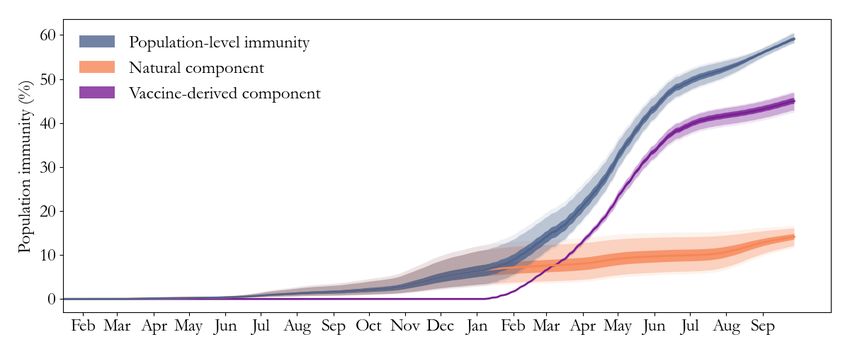
METHODS
For this rapid status update, we used the COVID-19 modeling software Rainier. Rainier
is software designed by IDM to algorithmically estimate the effective reproduction
number (Re) over time based on local data and to conduct simple projections. Rainier
fits a stochastic SEIR (susceptible – exposed – infectious – recovered) model to testing,
hospitalization, and mortality time series. This software has been used to generate
regular situation updates for the State of Washington overall and by two regions within
Washington (Example WA Report).

Results are based on COVID-19 data compiled October 6 from the Oregon Pandemic
Emergency Response Application (Opera) on COVID-19 testing, total diagnosed
cases,1 hospitalized cases, and deaths among people living in Oregon, as well as
hospital occupancy data from Oregon’s Hospital Capacity Web System (HOSCAP). To
account for delays in Opera reporting, diagnosed cases with a specimen collection date
after September 28 were not used; we used the same cutoff date for deaths. Due to
surge-related delays in hospitalizations being reported to Opera, a cutoff date of August
12 was used for hospital admissions in Opera,2 and we used hospital occupancy data
from HOSCAP to estimate the number of daily hospital admissions between August 13
and September 28. These estimates are based on the assumption that the typical
relationship between HOSCAP daily occupancy and preceding Opera admissions have
stayed consistent, but this assumption would be incorrect if the average patient length-
of-stay changed concurrently with the recent surge in hospitalizations.

Of note: in the model, cases tested on September 28 reflect exposures that occurred
around September 22.

See the August 19, 2021 Status Update for more detail on methods.

1Total diagnosed cases include confirmed (positive test) and presumptive cases (symptoms with epidemiologic link).
2These dates reflect the cutoff through when individuals had a test specimen collected, were admitted to a hospital,
or died. Any of these events may have been reported to OHA at a later date.

                                                                                                                   2
RESULTS
Effective reproduction number (Re)
From the model results (Figure 1), it is clear the statewide Re -- the average number of
secondary cases that a single case generates -- has fluctuated up and down over time,
with dramatic shifts often happening quickly.
After a prolonged decrease following its late-July peak, the best-estimate Re began to
increase in mid-September. Over the week ending September 22, the best estimate Re
averaged 0.91. On the date of September 22, the statewide Re was likely between 0.89
and 1.07, with a best estimate of 0.98.
Schools closed; indoor dining
and large gatherings banned
“Stay Home,
Save Lives”
Counties began
to reopen Mask recommendation
2-week
“freeze”
Reopening Mask
New risk & safety
requirement
framework
Figure 1: Re estimates over time for Oregon, with shaded 95% confidence interval.3 Graph
insert is the number of new hospitalizations over time in Oregon, a key input for the estimates.
Re = 1 is the threshold for declining transmission.
The observed changes in Re over time may be due to some combination of changing
behaviors, changes in opportunities for potential exposure as counties’ interventions
become more or less stringent, changes in variants, and/or immunity (either from
vaccination or recovering from infection). The summer surge in Re corresponded to the
increase in the Delta variants (B.1.617.2 and AY.3) among cases in Oregon (OHA
3Our Re confidence interval may be narrower at times because of how we estimated specimen collection dates for
negative tests (and thus positive test rate for each day), as described in Appendix 1.
3Variant Dashboard)4, as well as state reopening on June 30. The decline in Re that
followed suggested that people adopted more protective behaviors after learning of the
surge and new recommendations and requirements, including mask requirements that
took effect in August. Data from a survey of Facebook users suggest mask wearing in
public in Oregon has more than doubled since late July and remains high (CMU
survey).
It is important to note that these estimates are based on statewide averages, yet the
rate of increasing cases and hospitalizations vary dramatically by county (OHA County
Dashboard), race, ethnicity, age (COVID-19 Weekly Report), and vaccination status
(COVID-19 Monthly Report).
Our best estimate of the Re for September 22 (0.98) is higher than the estimates for that
date from Covid Act Now (0.94) and Harvard, Yale, and Stanford (0.91).5
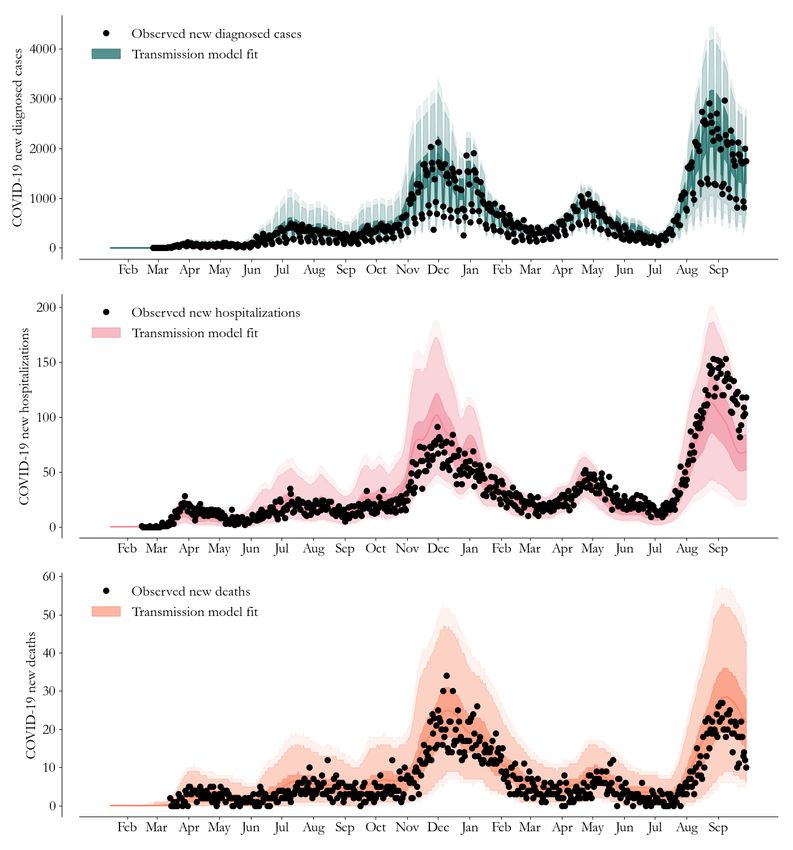
Model fit to Oregon COVID-19 data
Figure 2 shows how the transmission model captures trends in the daily Oregon
COVID-19 outcomes over time. Recent trends in diagnosed cases and occupancy-
imputed hospitalizations have been somewhat inconsistent, with hospitalizations
appearing to have peaked but not yet decreasing at a similar rate to diagnoses.
Because of this, the model fit is slightly high to recent diagnoses (likely due in part to
testing shortages) and deaths (due in part to reporting lag), but low to recent
hospitalizations. While reporting lags and testing shortages likely explain at least some
of these differences in model fit by outcome, another contributing factor could be the
Delta variant having higher infection hospitalization ratios than earlier variants. For the
hospitalization scenario projections in this report, we made a post-model fitting
adjustment to better track recent hospitalization counts.
4 Since the week starting August 1, the highly-infectious Delta variants (B.1.617.2 and AY.3) has comprised over 95%
of genetically-sequenced viral samples in Oregon (OHA Variant Dashboard).
5 Estimates dated September 22, 2021, accessed on October 6, 2021. An exact estimate from CMMID was not
available, but it was below 1. The latest estimate from IHME categorized effective R in Oregon as between 0.87 and
0.90 on September 16.
4Figure 2: Fitting the transmission model to Oregon’s COVID-19 data on diagnosed cases,
hospitalizations, and deaths. The lines represent the mean of 10,000 runs; the 25th-75th
percentiles are given in dark shaded areas, 2.5th-97.5th percentiles in the lighter shade, and
1st-99th percentiles the lightest shade. The black dots are observed data. Top panel: Modeled
cases (teal) capture the trend in observed, daily new diagnosed cases based on Re estimates
and a free number of importations on January 20, 2020 and February 1, 2020. Middle panel:
Simultaneously, the model (pink) captures the trend in observed daily new hospitalizations by
assuming hospitalizations are independent of testing volume. Bottom panel: With its time-
varying infection fatality ratio, the model (orange) captures the observed trend in daily deaths.
5Population-level immunity
Figure 3 includes estimates of population-level immunity from SARS-CoV-2 infection
over time.
Figure 3: Estimated population-level immunity to SARS-CoV-2 infection over time. The “natural
component” consists of people who developed and then recovered from COVID-19. The
“vaccine-derived component” consists of people who were not previously infected, but who
achieved immunity from a vaccination dose administered 21 days prior.
Rainier estimates that as of September 28, the population-level immunity to SARS-CoV-
2 was 59.1%. The actual population-level immunity to the Delta variants is unclear, but
our immunity estimate (59.1%) is above that from Institute for Health Metrics and
Evaluation (IHME) and below that from Oregon Health and Science University (OHSU).
The estimated immunity from vaccination (44.5%) is over triple the estimate for natural
immunity. Immunity due to vaccinations is helping prevent further spread of COVID-19.
If we remove all of those who have immunity from the model calculations and look at the
rate of infection, we see each infection spreading on average to 2.36 new people as of
September 22. That is to say, without any immunity (largely due to vaccination), our
estimated population Re would be 2.36 instead of 0.98, and new infections would be
rapidly increasing.
6COVID-19 trends after the data cutoff
Since we did not include COVID-19 data occurring after September 28 in our modeling
dataset due to reporting delays in all the COVID-19 outcomes in Opera, we examined
counts of Oregon COVID-19 hospital occupancy to see if trends have changed more
recently. Data from HOSCAP indicate that COVID-19 hospital occupancy decreased by
92 patients (11%) between September 28 and October 6.
Scenario Projections
With the fitted model, we can explore outcomes under future scenarios. That is, we do
short-term projections to compare what would happen if we assume particular future
scenarios, rather than specific forecasting about what will happen. More about this
distinction is described here. The CDC, OHSU, and IHME have COVID-19 forecasts.
For the current report, we modeled two scenarios. Both assume recent vaccination levels
will continue in the upcoming weeks.
Transmission continues at September 22 level: This scenario assumes the estimated
transmission level as of September 22, a high point in transmission compared to the
preceding week.
o We would see a continued decrease in diagnosed cases (Figure 4). For the
two-week period between October 13 and October 26, the projected number
of new diagnosed cases would decrease to 425 per 100,000 people. This rate
translates to a daily average of 1,275 cases.
o By October 26, there would be 78 people per day requiring hospital admission
(Figure 5).
7Transmission continues at the average level over the week of September 16 –
September 22: The first scenario might be too conservative because it assumes the
estimated transmission level being at the recent high point. Therefore, we ran a
scenario assuming the average transmission level over the week of September 16 –
September 22, which represents a transmission level more consistent with other models
and trends in hospital occupancy after our data cutoff.
o Diagnosed cases would decrease at a faster pace (Figure 4). For the two-
week period between October 13 and October 26, the projected number of
new diagnosed cases would be 350 per 100,000 people. This rate translates
to a daily average of 1,050 cases.
o By October 26, there would be 62 people per day requiring hospital admission
(Figure 5).
Figure 4: Observed diagnosed cases (per 100k population over the previous 14 days) for
Oregon and projection scenario. The black line shows observed cases, the grey line shows
model fit, and the colored lines show diagnosed cases projected assuming the estimated
transmission rate of September 22 (red) or the average transmission rate of September 16 – 22
(green). Shaded areas: 25th-75th percentile ranges of the model fit. The dashed horizontal lines
correspond to levels of Oregon Community Spread.
8Figure 5: Observed hospitalized cases for Oregon and projection scenario. Black dots show
observed daily counts, while the grey line shows model fit. The colored lines show
hospitalizations projected assuming the estimated transmission rate of September 22 (red) or
the average transmission rate of September 16 – 22 (green). Shaded areas: 2.5th-97.5th
percentile ranges.
9You can also read