BRINGING MODELS DOWN TO EARTH - Locally grounded network models for supporting HIV policy planning UW Network Modeling Group - GitHub Pages
←
→
Page content transcription
If your browser does not render page correctly, please read the page content below
BRINGING MODELS DOWN TO EARTH
Locally grounded network models for
supporting HIV policy planning
          Martina Morris
          Deven Hamilton, Jeanette Birnbaum
          Susan Buskin, Roxanne Kerani, Sara Glick, Tom Jaenicke

          UW Network Modeling Group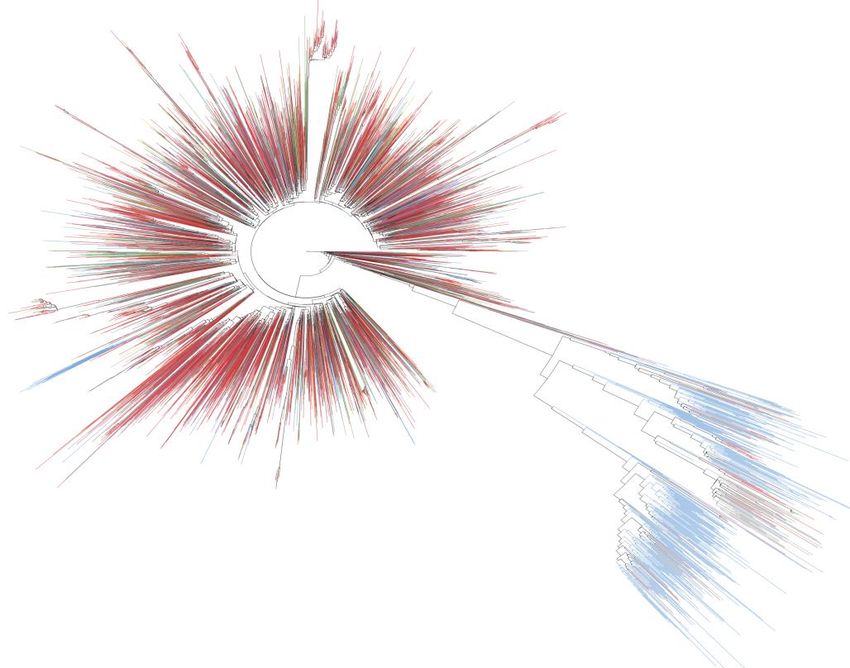
Start by acknowledging my collaborators
Modelers Epidemiologists
UW Network Modeling Group Joint UW/PHSKC
Deven Hamilton Sarah Glick
Jeanette Birnbaum Roxanne Kerani
Advisory Board
PHSKC – Amy Bennett, Susan Buskin, Katelyn Gardner Toren
WA DOH – Jason Carr, Tom Jaenicke
UW – Matt Golden, David Katz
Funding: NIAID R21
NME 2018 2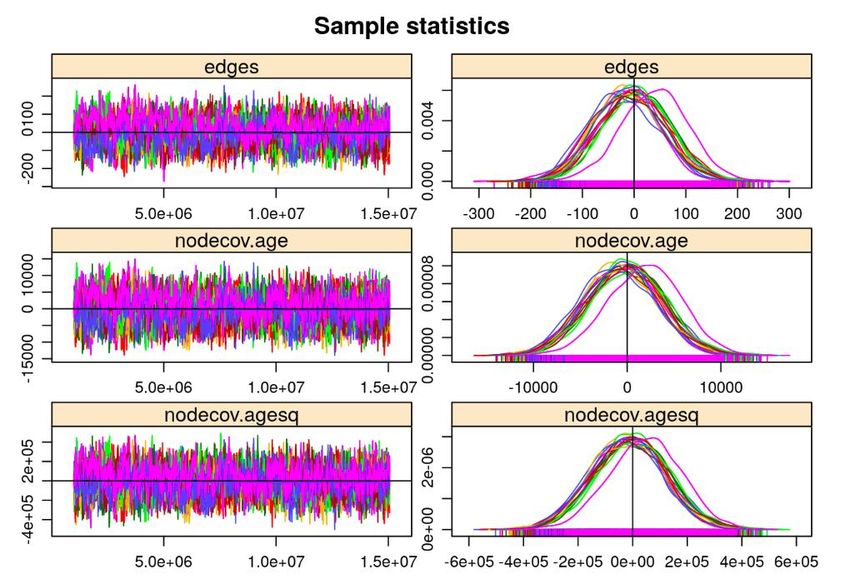
Outline
Project overview
Model structure … and data sources
Demography
Transmission system
Care continuum and clinical outcomes
Epidemic results
Preliminary – first set of runs
NME 2018 3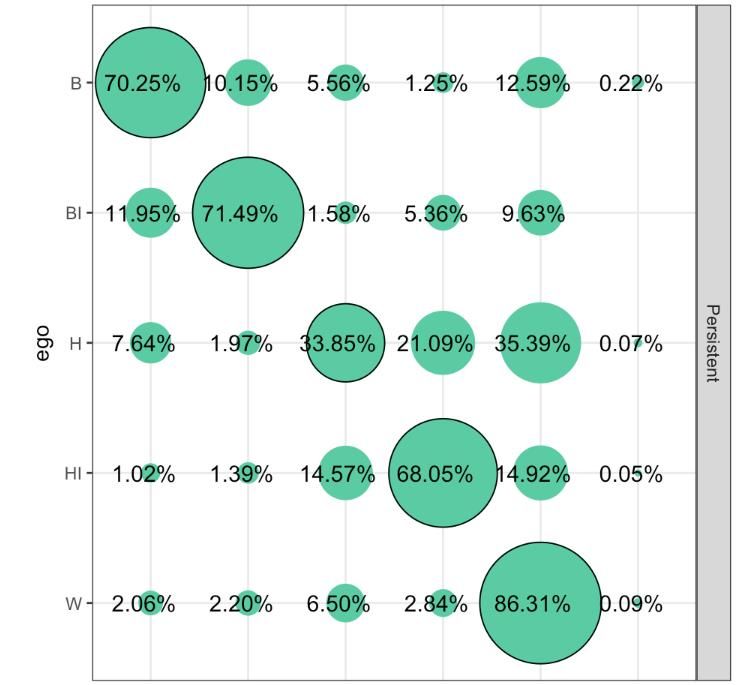
Project goals
Build locally grounded projection model to support HIV policy
Models have traditionally been built at the country level
But there is significant variation in HIV prevalence within countries
And in the US, prevention happens at the State/Local level
Start with the heterosexual epidemic in King County
Why?
Small, but potential for eradication
First step towards a more comprehensive model
It’s a challenge…
NME 2018 4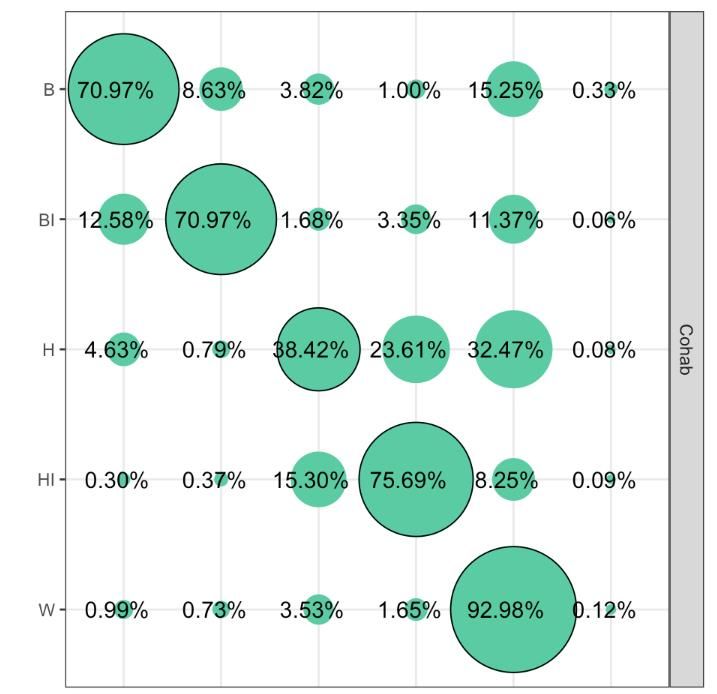
Heterosexual cases of HIV
Measured with Uncertainty
New HIV Diagnoses in King In King County
County: 2011-2016
350
6-7% of incidence is
300 attributed to
250
Heterosexual contact
200 Another 15-20% is
“No Identified Risk”
150
100
Total range: 6-27%
50
0
2011 2012 2013 2014 2015 2016
In Southeast US
As high as 30%
Total Het/NIR Heterosexual
NME 2018 5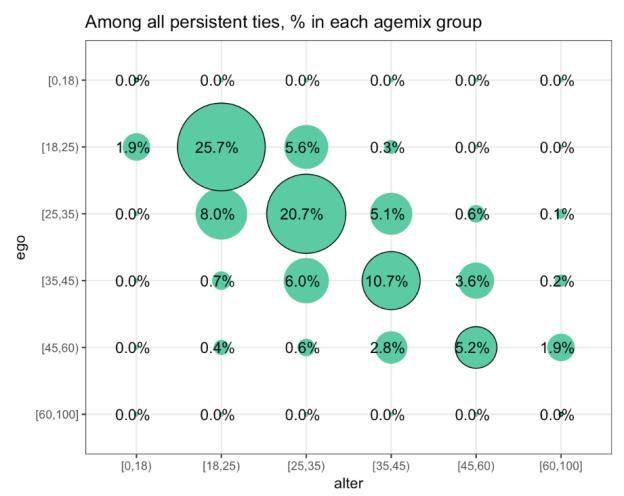
Race and Immigration in KC HIV

    HIV Prevalence: 2016

                   Estimated HIV
                                               US Born       Foreign Born
                  Prevalence/100K

   White                 314.2                   93%              2%

   Black                 1001.0                  56%              41%

   Hispanic              434.6                   42%              52%

    We see large racial disparities          And profound differences in
                                             country of origin by race

                                  NME 2018                                  6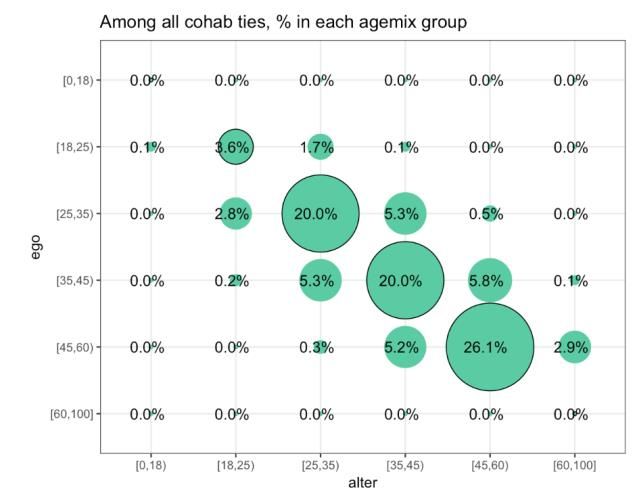
Importance of local MSM epidemic
MSM comprise the largest group of HIV diagnoses
Several papers have shown evidence that there is substantial
transmission across subpopulations
Based on phylogenetic clustering of HIV sequence data
In the US: Oster et al. (2015)
“Of heterosexual women for whom we identified potential transmission
partners,
29% were linked to MSM,
21% to heterosexual men...
a higher percentage of women in the West (52%) were linked to MSM”
NME 2018 7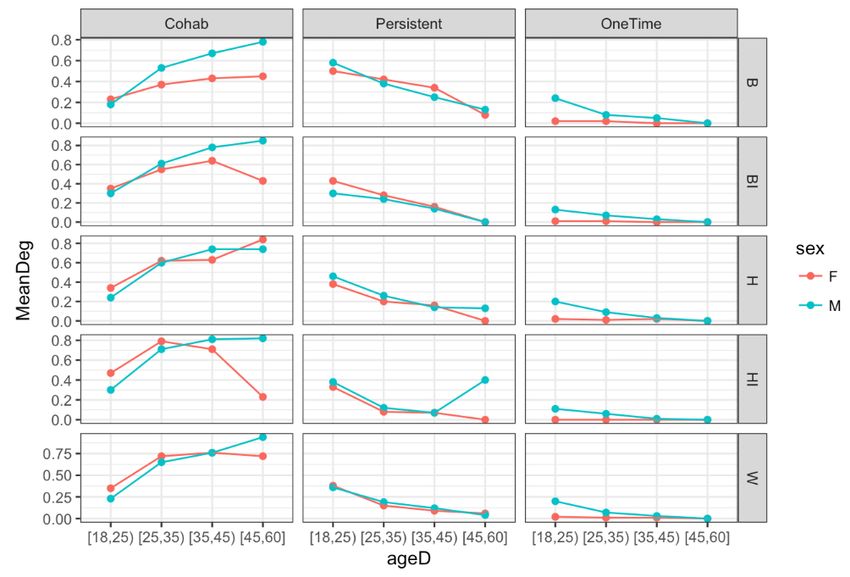
What this suggests
Ongoing transmission in the heterosexual population
could be below the reproductive threshold
sustained by cross-boundary transmissions?
This has implications for targeting prevention policy
Target the boundary to have the maximum impact
NME 2018 8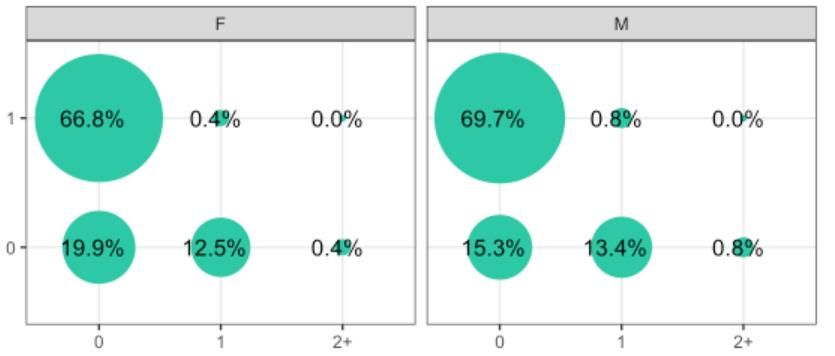
9   The modeling framework
    Dynamic network foundation (statnet)
    Epidemic model components (EpiModel)

                    NME 2018
Key components of our framework
Transmission system
Dynamic partnership network Handled by
Multilayer: Cohab, Persistent and one-time
partnerships statnet
Behavior within partnerships
Transmission
Function of viral load/stage of infection
Care continuum Handled by
Testing, treatment, viral suppression EpiModel
Demography
Aging
Travel
Entry/Exit NME 2018 10Dynamic network model(s)
Partnerships modeled with a STERGM
• Formation ERGM
• Dissolution ERGM
• Estimated from egocentrically sampled data
3 different types of partnerships
• Cohabiting
• Persistent So three different STERGMs
• One-time
NME 2018 11Transmission system components
Several processes are overlaid, and interact with the network
Within discordant Boundary exposure
partnerships:
Behavior Foreign
FB Travel
• Coital Frequency
• Condom Use Force of
infection
Infectivity, by MSMF
• Stage Local MSM
• CC engagement
• Clinical outcome
FB: Foreign Born
MSMF: Males who have sex with both males and females
NME 2018 12So our population has multiple subgroups
Race / Immigration subgroups (5)
US and foreign-born Black
US and foreign-born Hispanic
Other (predominantly White)
Sex / Sexual preference subgroups (3)
Female (F)
Males who have sex with females only (MSF)
Males who have sex with males and females (MSMF)
And age…
NME 2018 13Lots of other model components
Engagement in Care
HIV Testing (at sex and race-specific rates, some never test)
Treatment with ARVs
Adherence, with episodes of drop and return
Viral Suppression (some fraction are not full suppressors)
Clinical progression after infection
4 stages (acute rise, acute fall, chronic, AIDS)
Progression time: 6.4 wks, 3 wks, 10 yrs, 2 yrs
Stage-specific viral load (influences infectivity)
Demography: Open population model
Entry at 18, exit at 45
Age and AIDS specific mortality rates
Travel for foreign born (pauses local sexual activity, activates boundary exposure)
NME 2018 1415 Data sources
Locally sourced, … when possible
NME 2018Model components: LOCAL DATA NEEDED
Model Component Governs: Source
Sexual network Partnership NSFG (18-45)
formation/dissolution
dynamics
Behavior within partnerships Coital frequency, condom use, NSFG (18-45)
HIV status disclosure
Natural history of within-host Viral load, CD4, symptoms and Global Estimates
HIV infection infectivity
Clinical care cascade Testing, referral, adherence, PHSKC HIV Core Surveillance
suppression
Demographics Entries and Exits into the King County Census
population (pop’n growth,
mortality and in/out migration)
NME 2018 16US Data on sexual behavior
National Survey of Family Growth (NSFG, 2006-15)
Representative national sample with annual waves
Age 15-45
Egocentric data on last 3 heterosexual partners
Partner attributes (age, race/immig, cohab, duration/once only, ongoing)
Behavior within partnerships
HIV testing rates
Combined sample size: ~40K
Reweighted by age, sex, race/immigration group
To match King County demographics
NME 2018 17Local data on travel back to home country:
collected in public health interviews of new HIV cases
Added in
2010
But only for newly
diagnosed HIV cases
NME 2018 18Local “Cascade of Care”
We use sex/race specific values
NME 2018 1920 Some descriptive statistics
Population attributes
Partnerships patterns by subgroup
NME 2018KC Demographics by race/imm/sex
King County is predominantly white
About 15% of the population is Black or Hispanic
And half of those are foreign born
NME 2018 21KC Sex Group estimates
by Age and Race
About 1% of the population are MSMF
Based on NSFG, reweighted by age/race/sex to KC
49% 50% 50% 50%
50% 49%
1% 1% 1%
NME 2018 22Partnership Type Prevalence
by Age, Sex, and Race
Cohab Persistent One Time
Race
Sex
Age
NME 2018 23Age Mixing
Cohabiting Persistent One time
Ego Age
Alter Age
Strong age homophily for all types of partnerships
NME 2018 24Partnership Durations: Cohab & Persistent
by Race
AGE OF ACTIVE TIES
Cohab: Persistent:
average 10-15 years average 2 – 4 years
NME 2018 25Mixing by Race/Immigration group
Cohab Persistent
Ego Race/Immigration group
Alter Race/Immigration group
NME 2018 26Overlapping partnership networks
At any point in time, a person can have none, or some of each partnership type
About 1-2% of the population has two or more concurrent partners
Sex
Cohabiting partners
Cohab
1.2 9.6 0.0 Rate of 1
0.1 2.5 0.0
time partners
per 100
persons
4.1 1.9 2.2 23.2 15.3 13.1
Persistent partners
# Persistent Partners
NME 2018 27Concurrency by sex group
Highest overall rates are in
2.5 one of the boundary
populations: MSMF ~2%
2.0
About half of this is cross-
1.5 network
1.0 This is just the concurrency
with opp sex partners
0.5
45% of the MSMF also have
0.0 M partners during the year
F MSF MSMF
Any Cross-Network Lowest overall rates are
among women: ~0.5%
NME 2018 28Concurrency by race/immigration group
Female Male
5 5
4 4
percent
3 3
2 2
1 1
0 0
B BI H HI W B BI H HI W
Any CrossNet Any CrossNet
Highest rates are for Black, Hispanic and Hispanic immigrant men ~4%
Mostly multiple persistent partners for Black men
Mostly cross-network for Hispanic immigrants
Split equally for US born Hispanics
Black women have slightly higher rates among females : ~2%
NME 2018 29Concurrency: By age
This is a young
person’s game
Highest rates for young
men: 3-7%
But the configuration
changes with age too
The cross-network
fraction rises, as rates
of cohabitation rise
NME 2018 30Boundary force of infection
Boundary Groups:
BI HI MSMF
Percent of
2.3% 5.4% 1.5%
population
Exposure Depart: 0.01
probabilities 2.5 partners/yr
Return: 0.25
HIV acquisition F: 2.0e-04 F: 2.0e-05
probabilities * 7.2e-06
M: 1.0e-04 M: 9.9e-06
* The HIV acquisition probabilities are For example for MSMF:
MSM prevalence x
a function of several components, and condom use (.304) x efficacy (cond.rr=.4) x
determine the FOI at the boundary P(transmission | contact) (((.0082*1.09)+(.0031*1.09))/2) x
P(contact per week) (2.5/52)
NME 2018 31Much uncertainty about boundary inputs
So, we will use these for model calibration
At this stage, by just manually trying some values
Multiplying the FOI by a factor
Later: we have a better plan
NME 2018 3233 ERGM Results
NME 2018Formation models for each network
Cohab Pers OT
Age -0.87 -0.20 -0.38
Age2 0.02 0.00 0.01
Age Diff -3.22 -2.59 -2.40
Race (main) Black 1.10 1.14 0.42
Black Imm 1.14 1.61 -0.52
Hispanic 3.17 2.00 0.52
Hisp Imm 1.63 1.13 -0.78
Race (matching) Black 3.35 3.21
Black Imm 3.85 2.86
Hispanic 0.01 0.27
Hisp Imm 2.88 2.30
White 3.14 2.17
Concurrency Cross net -5.96 -4.36
Within net NA -2.85
NME 2018 34Model assessment: Convergence
This is what you
want to see
But we found it
requires a very
long MCMC
interval (1e5)
NME 2018 35Model assessment: Network fidelity
We want the dynamic simulations to reproduce the
observed network statistics (on average)
Degree distributions ERGMS should be
Within and between networks able to reproduce
By sex, age, race/imm the joint distribution
of all of the network
statistics
Mixing patterns
By age, race/imm in each model
Partnership durations
NME 2018 36Persistent network: All model stats
Good fit to observed…
NME 2018 37Example: Persistent degree by race
Good fit to observed, even though the
degree terms are not in the model
NME 2018 38Durations by partnership type
These also look
roughly like the
observed stats
… But there is
more of a story
here
NME 2018 3940 Epidemic results
Now we can simulate the epidemic,
on a network that we know closely represents
the observed data
NME 2018First things first
Even with a simulation size of 50,000 nodes
The smallest groups arePersistence and equilibrium
1. We can sustain an
epidemic
2. And we are “in the
ballpark”
KC Observed Prevalence:
Het only: 0.006
Het+NIR: 0.012
NME 2018 42Prevalence by race & immigration status
Simulation Observed KC prevalence
Black
Immigrant
Here, the rank order matches the observed pattern
But the BI prevalence is too high (by an order of magnitude)
NME 2018 43Prevalence by sexual partner group
Simulation
Here the rank order
is correct
And the prevalence
for Females and MSF
are about right
Working on
estimating the true
local prevalence is
for MSMF, current
estimate is ~30%
NME 2018 44Infections by source
Infections from
No persistence
original local Boundary without
heterosexual Infections continual
seeds infections across
MSMF
the boundary
And the primary
contribution is
via MSMF
Downstream
Infections
NME 2018 45A note on workflow
The project is managed on GitHub
Code and data repository
Organizing issues with Projects
We’re keeping a lab book using markdown/html
Exploratory data analysis: bookdown
Records both the descriptives and our decisions
Model results
It’s still a bit overwhelming …
NME 2018 4647 What’s next?
Model Calibration against Local Phylogenetics
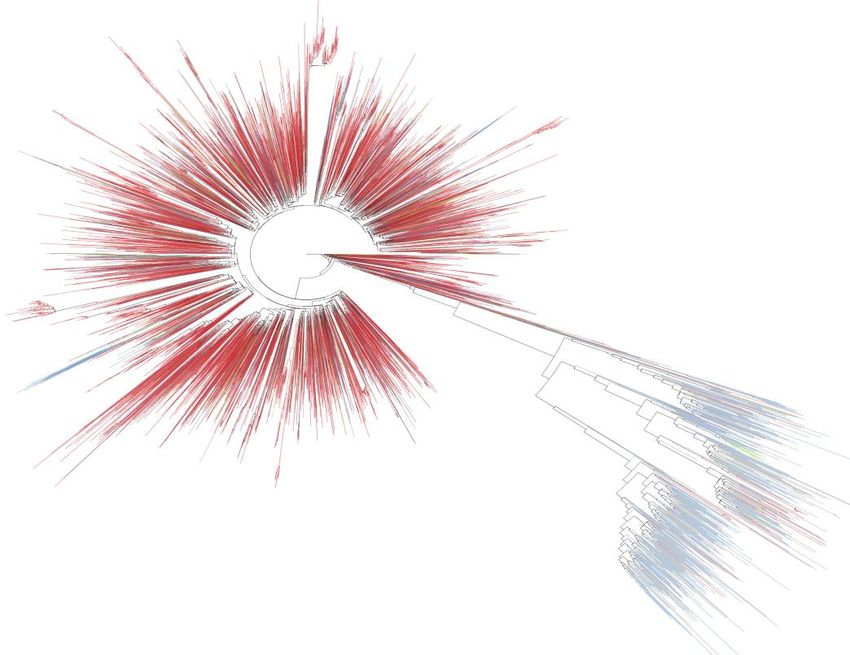
NME 2018From another project here at UW
Phylogenetic analyses of local HIV diagnoses
White
Black
Asian
• B Clades predominate in
Latino the US
• Non-B clades predominate
in Africa and Asia
They form a distinctive
cluster here,
Non-B
predominantly black
NME 2018 48Herbeck & Kerani
Phylogenetic analyses of local HIV diagnoses
MSM
Heterosexual
They form a distinctive
cluster here,
Non-B
And predominantly
heterosexual
NME 2018 49An empirical foundation for calibration
Directly relevant for calibrating our most uncertain
parameters – the FOI across the boundaries
And separate from HIV incidence and prevalence
data
So those can be preserved for model validation
Deven Hamilton is taking the lead on this project
NME 2018 50You can also read