BCCDC Data Summary 16 September 2021
←
→
Page content transcription
If your browser does not render page correctly, please read the page content below
BCCDC Data Summary
 16 September 2021

 1
Purpose
The surveillance deck is a summary of COVID-19 related indicators that can help inform the pandemic
response in British Columbia. This surveillance monitoring constitutes the medical chart for population
health assessment that guides the public health community of practice. As such this is a working
document that reflects a snapshot in time and may differ from other published reports.
Data Sources
The collection, use and disclosure of case data is subject to the Public Health Act. COVID-19 cases are
reported under the Public Health Act to the health authority of residence. Public health case
notification, clinical management, contact tracing and follow-up contributes surveillance data for
regional and provincial COVID-19 monitoring. Each regional health authority have their own workflows
and information systems for capture of relevant data. This data foremost serves the public health and
clinical management of the case and their contacts.
Disclaimer
• Data and key messages within these documents are not finalized and considered to be work in
 progress that is subject to retroactive changes as more data and information become available.
• Accurate interpretation of figures may be difficult with the limited inclusion of data notes and
 methodology descriptions in this document.
 2
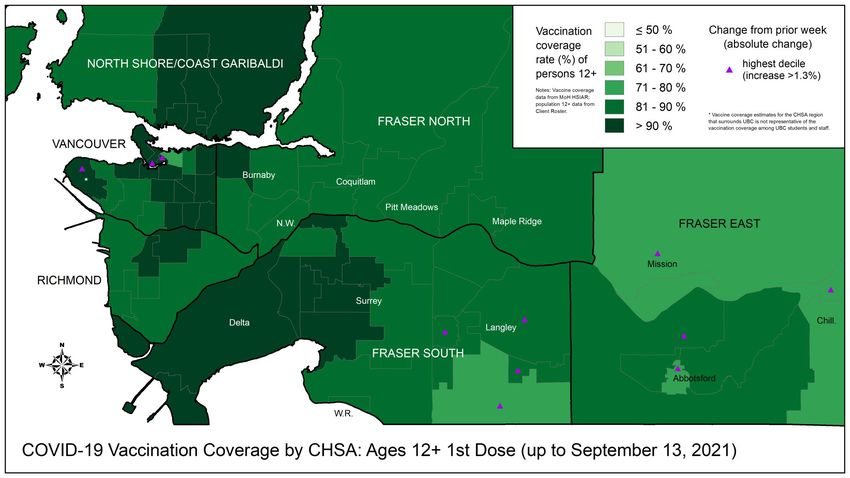
Table of Contents
 Overall Summary ……….…………………………………………………………………………………………………………………………4

 Surveillance ………………………………………………………………………………………………………………………………………….5

 BC Epidemiology………………………………………………………………………………………………………………….….5

 Outcomes by vaccine status……………………………………………………………………………………………………16

 Vaccinations…………………………………………………………………………………………………………………………..26

 Labs/Genomics…………………………………………………………………………………………….……………………….38

 Modelling…………………………………………………………………………………………………………………………………..…………47

 Additional Resources………………….……..………………………………………………………………………………………………….53
Overall Summary for surveillance data up to 14 Sep
• Case rates are increasing in NH, FH and VIHA, elevated but decreasing in Interior, and stable in VCH.
• Test positivity among public tests is stable (~10% provincially), and is highest in IH (15%) and NH
 (24%).
• New hospitalizations are elevated but stabilizing provincially; hospital/critical care census is increasing
 across BC; new deaths are low. Hospitalization rates among children continue to remain very low.
• The majority of new cases and hospitalizations continue to be among the unvaccinated individuals.
 Compared with fully vaccinated individuals, unvaccinated individuals are at much higher risk of
 infection and severe outcomes.
• Vaccine coverage in BC, 14 Sep, 1 dose (2 doses): 77% (70%) of total population, 86% (78%) of 12+
 eligible population. Lower vaccine coverage in Interior and Northern and among younger individuals.
• Variants of concern (VOCs) continue to account for ≈100% of all positive tests in BC. Delta is the
 dominant VOC (99.5%) across all of BC.
Sep 09 to Sep 15: BC COVID-19 Profile
 176,480 total cases 1,873 total deaths
 4,916 new this week 31 new this week

 9,273 ever hospitalized 168,459 removed from isolation
 266 new this week 4,666 new this week

 4
Case rates and new hospitalizations are stable in BC, trends differ by HA; new deaths are stable and low.

 For latest version of a graph similar to this one (difference:
 hospital census, not new hospitalizations), see the Epi App

 6
The majority of new cases and hospitalizations continue to be among the
unvaccinated individuals

 ***NEW***For latest version of this figure, see COVID-19 Regional Surveillance Dashboard 7
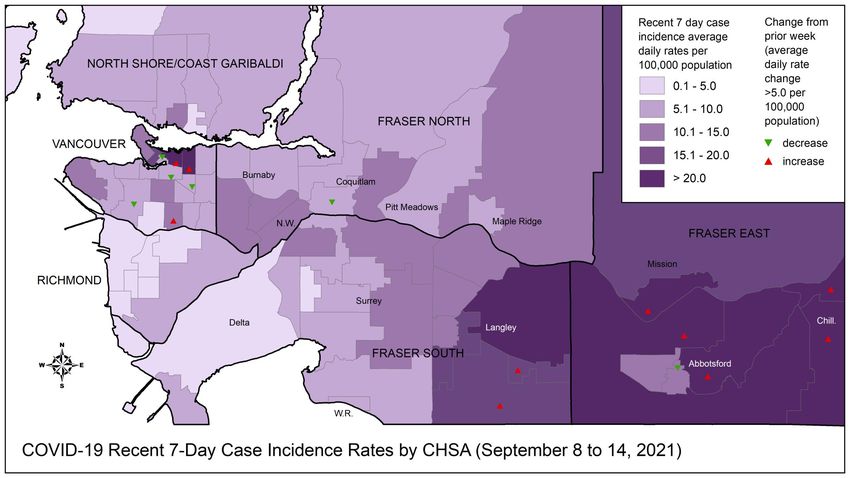
New daily COVID-19 cases by HA, Jan 1 2021 – Sept 14 2021

 *Data based on surveillance date (i.e. lab result date, or when not available, date reported to public health) 8
Case counts are highest among 19-39 year olds, followed by 40-59 year olds, consistent with
previous resurgences
 New daily COVID-19 cases by Age, Jan 1 2021 – Sept 14 2021

 9
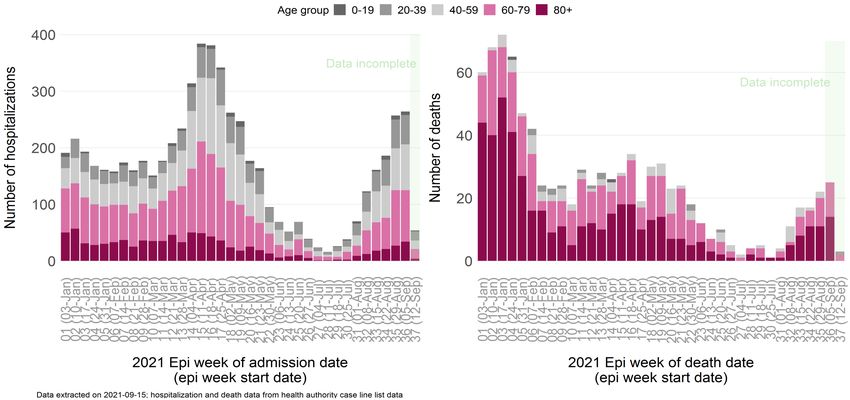
Hospital and critical care census is increasing in all regions. Note addition of % in critical
care line.

 10
Number of new hospital admissions is increasing across all ages >20 years, almost all are
among unvaccinated individuals (see slide 23). Deaths are low.

 11
Trends in number and rate of new hospitalizations by age group, BC, 1 Jan – 11 Sept 2021

 Hospitalization counts and rates among
 children (0-19 years) continue to
 remain very low

 12
 *Data based on admission date for hospitalizations
Sep 09 to Sep 15: Pediatric Profile
Age group: 0-4
 4338 total cases 85 ever hospitalized 2 total deaths
 141 new this week 1 new this week 0 new this week

Age group: 5-11
 9673 total cases 39 ever hospitalized 0 total deaths
 428 new this week 1 new this week 0 new this week

Age group: 12-17
 10745 total cases 38 ever hospitalized 0 total deaths
 309 new this week 2 new this week 0 new this week

 Hospitalization are extracted from Line list + BCCW 13
Hospitalizations continue to be low among children and youth

 14
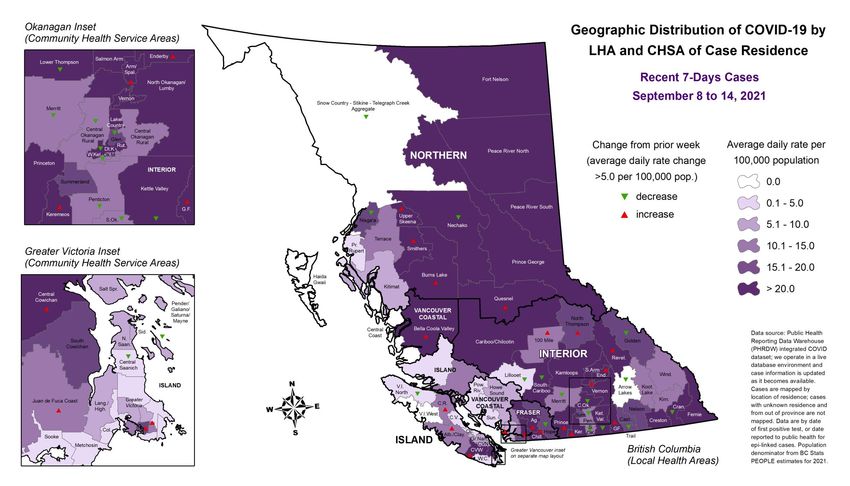
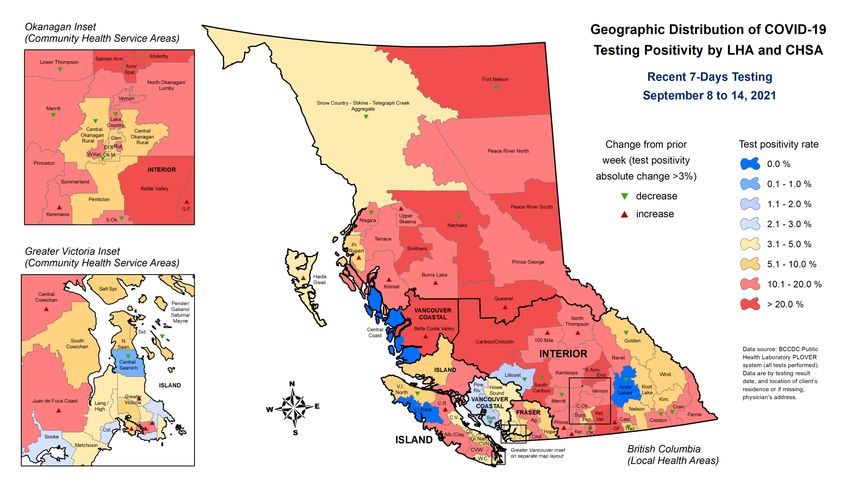
For latest version of this map (note: change symbols not 15
included), see COVID-19 Regional Surveillance Dashboard
For latest version of this map, (note: change symbols not 16
included), see COVID-19 Regional Surveillance Dashboard
For latest version of this graph, see COVID- 17
19 Regional Surveillance Dashboard
For latest version of this graph, see COVID- 18
19 Regional Surveillance Dashboard
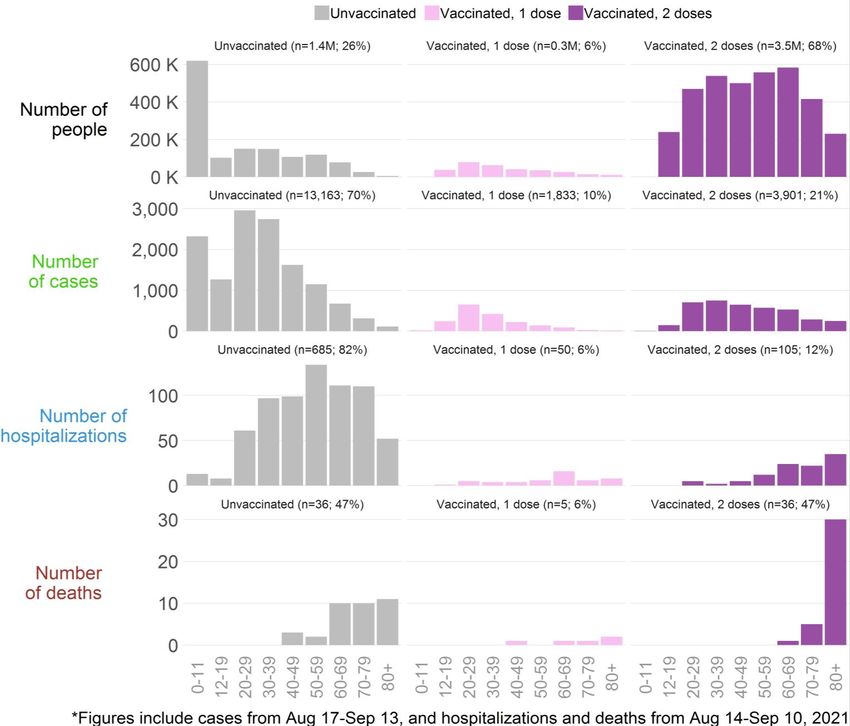
Key messages – Outcomes by vaccine status

• Most of the recent cases and hospitalizations continue to be among unvaccinated individuals
• Based on last month’s data, compared with fully vaccinated individuals and after adjusting for age
 differences, unvaccinated individuals are
 • ≈ 11x more likely to become a case
 • ≈ 59x more likely to be hospitalized
 • ≈ 19x more likely to die
 • NB: relative rates fluctuate over time and do not represent vaccine effectiveness

• Hospitalization rates among children continue to remain very low

• Unvaccinated: no dose or
Over the past week, fully vaccinated individuals represented 68% of BC’s total population, but
accounted for only 23% of cases and 13% of hospitalizations.

These % fluctuate over time. There are many more vaccinated individuals than unvaccinated individuals, and thus it is
important to take the denominator into account. These figures do not represent vaccine effectiveness.

We operate in a live database environment and data get updated retrospectively. These figures were run on Tuesday Sep 14th and may differ slightly from previously reported counts. Cases are
captured based on surveillance date. Hospitalizations are by admission date. Please note that there is often a multiple-days lag in recording hospitalizations, e.g. some hospital admissions that
occurred on Aug 24th may not be captured by our surveillance system until Aug 29th.

 20
Over the past month, fully vaccinated individuals accounted for 21% of cases and 12% of
 hospitalizations.

 These % are expected to increase over time as more people get fully vaccinated and there are fewer
 unvaccinated people. If 100% of population gets fully vaccinated (which is almost the case for many long term
 care residents for example), then any new cases, hospitalizations, or deaths will be among vaccinated people.

 Deaths continue to occur
 primarily among older individuals
 (see next slide), >90% of whom
 are vaccinated, which explains
 the higher relative % of deaths
 among the fully vaccinated.

 67%

We operate in a live database environment and data get updated retrospectively. These figures were run on Sept 14th and thus will differ slightly from previously reported counts. Cases are
captured based on surveillance date. Hospitalizations are by admission date. Deaths are by date of death. Please note that there is often a multiple-days lag in recording hospitalizations and
deaths, e.g. some hospital admissions that occurred on Aug 24 th may not be captured in our surveillance system until Aug 29th.

 21
Pie charts on the
 previous slide do not
 tell the full story.
 Denominators matter.

Please note that this is crude and not adjusted for age differences between the
vaccinated and unvaccinated individuals. See slide 28 for age adjusted calculation.

 22
COVID-19 health outcomes by vaccination status and age, BC, Aug 17 – Sep 13, 2021
COVID-19 case rate by
vaccination status and
Health Authority, July 1 –
Sept 14, 2021

Denominators for each vaccine status
group are dynamic and change daily
as people flow from being
unvaccinated to protected by 1 dose
to protected by 2 doses. Therefore,
the denominators are different across
groups and over time.

 ***NEW***For latest version of these figures, see COVID-19 Regional Surveillance Dashboard 24
COVID-19 case rate by
vaccination status and
age, July 1 – Sept 14,
2021

Denominators for each vaccine status
group are dynamic and change daily
as people flow from being
unvaccinated to protected by 1 dose
to protected by 2 doses. Therefore,
the denominators are different across
groups and over time.

 ***NEW***For latest version of these figures, see COVID-19 Regional Surveillance Dashboard 25
COVID-19 hospitalization
rate by vaccination status,
July 1 – Sept 9, 2021

Data by hospital admission date.
Denominators for each vaccine status
group are dynamic and change daily
as people flow from being
unvaccinated to protected by 1 dose
to protected by 2 doses. Therefore,
the denominators are different across
groups and over time.

 ***NEW***For latest version of these figures, see COVID-19 Regional Surveillance Dashboard 26
COVID-19
hospitalization rate by
vaccination status and
age, July 1 – Sept 9,
2021

Given relatively low
numbers, please
interpret these results
with caution. Trends
tend to be unstable
with lower counts.

 Rates for unvaccinated/1 dose
 80+ year olds not shown as they
Denominators for each vaccine status are unstable, making it difficult
group are dynamic and change daily to interpret data for other age
as people flow from being groups
unvaccinated to protected by 1 dose
to protected by 2 doses. Therefore,
the denominators are different across
groups and over time.

 ***NEW***For latest version of these figures, see COVID-19 Regional Surveillance Dashboard 27
After adjusting for age, unvaccinated individuals continue to be at a significantly higher risk of
infection, hospitalization, and death from COVID-19 compared with fully vaccinated
Relative rate fluctuates over time (see graph to the right). These figures do not represent vaccine effectiveness.

 11 fold
 reduction
 59 fold
 reduction

 19 fold
 reduction

 Note the bar graph was
 switched to monthly time
 frame and now includes
 confidence intervals

 28
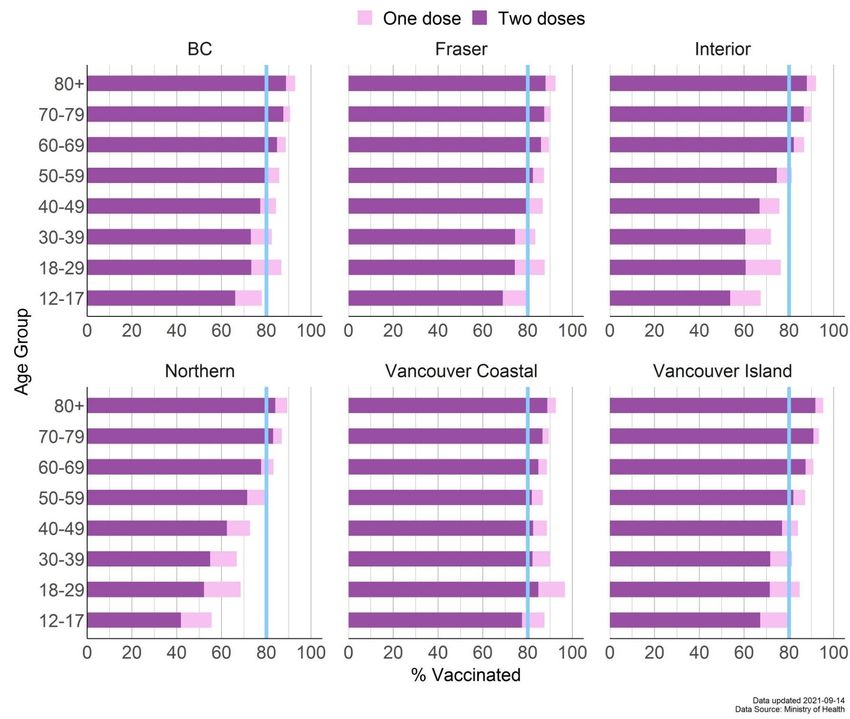
Vaccination progress in BC over time by age group and dose number up to Sept 14

 29
Vaccination progress in
BC and by Health
Authority as of Sept 13,
by age group and dose
number (%)

 ***NEW***For latest version of this figure, see COVID-19 Regional Surveillance Dashboard 30
BC communities
with higher
vaccination rates
generally had lower
total number of
cases per capita Lower vaccination
 rate, higher case rate
 Higher vaccination
 rate, higher case rate
between July 1 and
Sep 13
 Note the general absence
 of dots in this quadrant –
 very few communities with
 high vaccination rates also
 have high case rates

 Lower vaccination
 Higher vaccination
 rate, lower case rate
 rate, lower case rate

 31
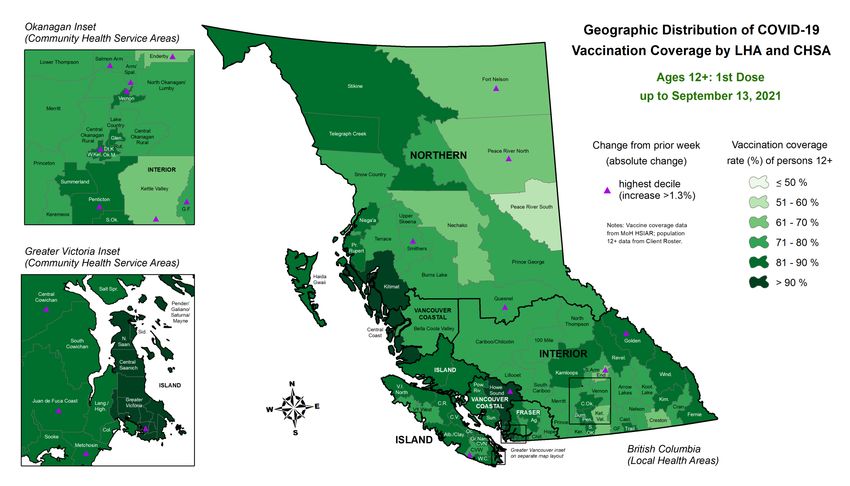
For latest version of this map, see COVID-19 32
Regional Surveillance Dashboard
For latest version of this map, see COVID-19 33
Regional Surveillance Dashboard
COVID-19 vaccination coverage with 1st dose among 12-17 year olds, by Local Health Area,
up to Sept 13, 2021: there is more variation in this age group compared with older age groups

 For latest version of this graph, see COVID- 34
 19 Regional Surveillance Dashboard
Nationally, BC’s vaccination rate is very close to the Canadian average; internationally, Canada
is one of the countries with the highest proportion of the population with at least one dose.

 For latest vaccination progress statistics in BC, 35
 Canada and internationally, see the Epi App
BC’s case rate has flattened
and has diverged from the
continuing increasing trends
in AB and SK, but it is higher
than in other provinces.

BC’s hospital census is
increasing more slowly than
AB and SK.

For most up to date figures, and to make your
own comparisons, please go to the Epi App

 36
Case rate is stable in the US
and UK, and elevated in Israel.
Case rates for European
countries shown here are
stable or declining.

Over the past two months,
BC’s case rate has been
similar to Germany’s and
lower than US, UK and Israel.

For most up to date figures, and to make your
own comparisons, please go to the Epi App

 37
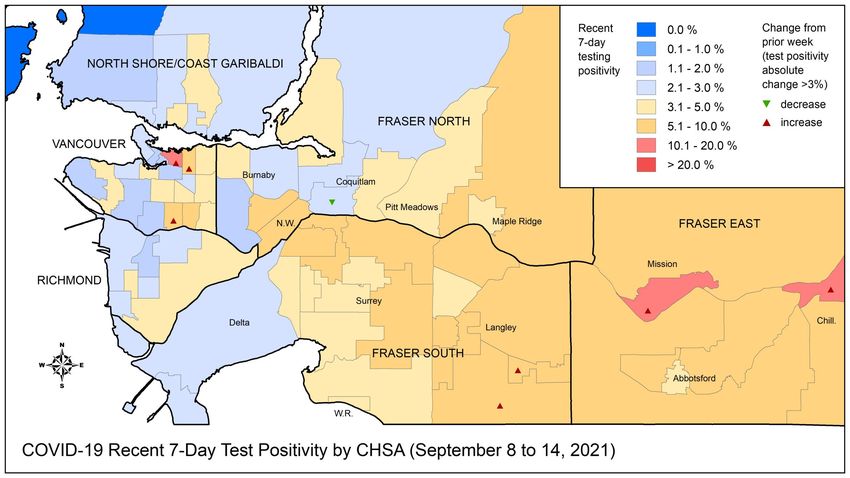
Lab - Key Messages
• Test positivity among publicly funded tests is stable at ≈ 10%
 • Test positivity varies by HA, ranging from 6.9% in VCH to 24% in NH.
 • Test positivity in high in NH (>20%) and IH (>10%)
 • Test positivity is >10% among 5-44 years.
• Publicly funded testing rates were stable this week
• The provincial weekly median turnaround time (time from specimen collection to
 lab result) remains low, at 15 hours indicating good testing capacity; 1 in 4 tests
 took > 21 hours to result.
• Delta is the most prevalent COVID-19 variant in BC representing 99.5% of all
 sequenced specimens in most recent week.
Weekly Summary of ALL lab tests performed
 3,574,221 total specimens tested
 6% relative to last week
 78,384 new this epi week

 183,472 total positive specimens 6.6% positivity
 0.7% absolute change from
 5,201 new positive this epi week
 last week
 15 hr mean turnaround time (TAT)
 3% TAT relative to last
 13 [9-21] Median [Q1 – Q3] TAT week
 Weekly Summary of Lab tests paid Publicly
 2,700,534 total specimens tested
 1% relative to last week
 52,840 new this epi week
 181,233 total positive specimens 9.7% positivity 39
 0.6% absolute change from
 5,121 new positive this epi week
 last week
Data source: PLOVER extract at 10:30am on September 14, 2021.
Epi week 36 (Sep 5 – Sep 11)
For latest version of this map, see the new (note: change 40
symbols not included) COVID-19 Surveillance Dashboard
Includes all tests

For latest version of this map, see the new (note: change 41
symbols not included) COVID-19 Surveillance Dashboard
Among publicly funded tests: percent positivity is stable at ~10%, and number of tests is stable.

 42
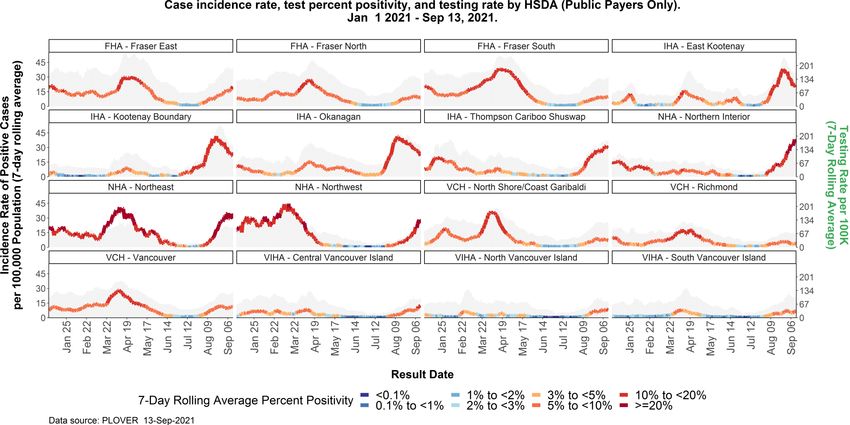
NH case incidence continues to increase considerably and has the highest test positivity since
the start of the pandemic. Test positivity is highest in Northern (25%) and Interior (16%).

 9.5% 8.0% 14.7%

 6.9% 9.4%
 24.4%

 43
Test positivity continues to be high in Interior and Northern HSDAs

 For latest version of a graph similar to this one 44
 (difference: all tests, not public tests), see the Epi App
Test positivity differs by age group and is >10% among 5-44 years

 45
Among sequenced VOC samples provincially based on information for September 5 to 11, the
dominant VOC continues to be Delta > 99%

 Alpha (%) ≈ 1%

 Delta (%) ≈ 99%

 Gamma (%) ≈ 0%

 46
Dynamic modeling: recent trends
Modelling indicates that overall Rt is near 1, but trends differ by region. Estimates are shown for
 last week → this week, with 90% range of possible values given next to most recent estimate.
Modeling scenarios - overview
– All scenarios begin September 16th, 2021 with a one-month time horizon. Output is limited to short-term projections only because
 uncertainty increases greatly over time and it is unrealistic to assume no changes to policies or behaviour.
– Three transmission scenarios are shown based on most recent estimates and range of Rt for BC. A projection of the current
 vaccination rate is compared to a potential higher vaccination rate for each scenario. Importantly, recent public health measures may
 further reduce transmission and decrease the likelihood of the upper range scenario
– Model scenarios are based on a plausible range of vaccine effectiveness including reduction in risk of infection, reduction in risk of
 onward transmission if infected, and reduction in risk of hospitalization.
– It is assumed that all eligible and willing individuals will have completed their two-dose vaccination schedule and sufficient time has
 passed such that they are fully immunized.
– Reduction in infection due to vaccination is 80%, reduction in onward transmission ranges from 40-45%, and reduction in
 hospitalization ranges from 95-99%. Additionally, the increased severity of the delta variant ranges from 0-125%. Initial number of
 infections also varies over a plausible range. Reduction in reporting infection due to vaccination ranges from 80-95%. Vaccination
 parameters are comparable with other established models [1], [2], [3]
– Projected vaccination coverage scenarios were compared to where coverage in each age group is additionally increased by a level
 consistent with individual hesitancy derived from the COVID SPEAK survey, and an additional counterfactual scenario which considers
 if none of the population were vaccinated.

 Scenario 12 - 17 18 - 24 25 - 34 35 - 44 45 - 54 55 - 64 65 - 74 > 75
 Projected 80% 79% 83% 83% 85% 86% 90% 89%
 vaccination
 Higher 87% 87% 85% 86% 89% 95% 98% 99%
 vaccination

 DRAFT - NOT FOR FURTHER DISTRIBUTION
Lower range scenario
Scenario: lower transmission levels, equivalent to an initial = 0.79 in the projected vaccination
scenario and = 0.7 in the potential (higher) vaccination scenario. Currently, for BC is 0.95 (0.79 -
1.13).

 DRAFT - NOT FOR FURTHER DISTRIBUTION
Mid-range scenario
Scenario: moderate transmission levels, equivalent to an initial = 0.95 in the projected vaccination
scenario and = 0.84 in the potential (higher) vaccination scenario. Currently, for BC is 0.95 (0.79 -
1.13).

 DRAFT - NOT FOR FURTHER DISTRIBUTION
Upper range scenario
Scenario: moderate transmission levels, equivalent to an initial = 1.13 in the projected vaccination
scenario and = 1 in the potential (higher) vaccination scenario. Currently, for BC is 0.95 (0.79 -
1.13). Note: scenarios do not include further public health measures that may be implemented to
reduce transmission.

 DRAFT - NOT FOR FURTHER DISTRIBUTION
Mid-range scenario - comparison to no vaccine
Scenario: Comparing mid-range transmission scenario to a no-vaccination scenario (equivalent to an
= 2.79). Note: scenarios do not include further public health measures that may be implemented to
reduce transmission.

 DRAFT - NOT FOR FURTHER DISTRIBUTION
Additional Resources
• BCCDC COVID-19 Regional Surveillance Dashboard showing maps, vertical plots, and trends by LHA
 can be found here

• More BC COVID-19 data, including the latest Situation Report, maps, and BC COVID-19 public
 dashboard, can be found here

• For more information on variants of concern and whole genome sequencing, the latest report is
 posted here

• To put BC provincial, Health Authority, and HSDA trajectories into national and international
 context, see BCCDC COVID-19 Epidemiology app

• COVID SPEAK 2020 Round 1 Survey results

• Slides for previous public and modelling briefings by Dr. Bonnie Henry can be found here

• PHAC’s COVID-19 Epidemiology update can be found here
You can also read