Antibiotic Resistance (AR), Antibiotic Use (AU), and COVID-19 - HHS.gov
←
→
Page content transcription
If your browser does not render page correctly, please read the page content below
THE INTERSECTION OF
Antibiotic Resistance (AR),
Antibiotic Use (AU), and COVID-19
for the Presidential Advisory Council on Combating Antibiotic-Resistant Bacteria

Arjun Srinivasan, MD
CAPT, USPHS
Associate Director for Healthcare-Associated Infection (HAI) Prevention Programs
Division of Healthcare Quality Promotion
National Center for Emerging and Zoonotic Infectious Diseases

February 10, 2021
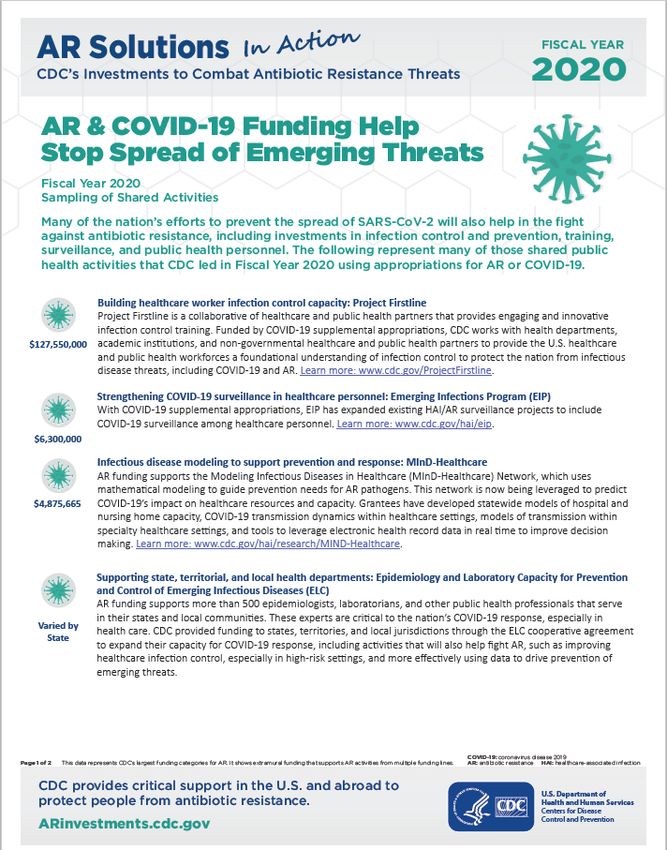
CDC AR Investments Support U.S. through Pandemic
500+ experts in infection prevention and control, HAI, AR,
laboratorians responding domestically
AR Lab Network in 50 states, several cities, territories to CDC
provide COVID-19 testing and identify AR outbreaks Funding
2016-2020:
Data collection systems, like the National Healthcare Safety
Network, gather COVID-19 and AR/AU data $558+ million
across all 50 state and
CDC antibiotic stewardship tools for frontline workers several local health
departments for
Infection control experts responding globally to COVID-19 detection/prevention
CDC has invested
Building on foundational innovations for AR sewage
surveillance to detect COVID-19 in wastewater $160+ million
in 100+ institutions to
Leverage antibiotic stockpile for continuity of TB treatment due investigate AR innovations
across One Health
to drug shortages
Preliminary unpublished analysis, please do not reproduce without permission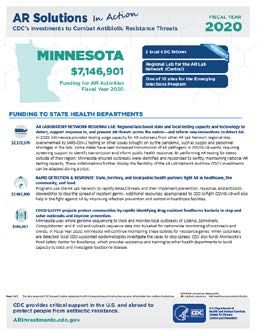
Key Takeaways: AR Infections
Healthcare infection control is critical to fight AR and COVID-19.
• No clear evidence that patients with COVID-19 are more susceptible to bacterial/fungal infections—similar
frequency as patients with influenza-like illness (ILI). However, sporadic outbreaks of AR infections in
COVID-19 units & higher rates of hospital-onset infections are being reported.
• COVID-19 can create a perfect storm for AR infections in healthcare settings: increased length of stay,
increased number of patients, staffing shortages, sick patients, antibiotic use, challenges implementing
infection prevention and control.
Some preliminary analyses have identified increases in hospital-onset resistant infections (e.g.,
MRSA) and potential changes for community-onset infections.
• Given the significant changes in healthcare utilizations and, possibly, lab testing (due to supply issues)
during the pandemic, additional analyses are needed to assess the net impacts on AR threat pathogens.
Findings highlight continued importance of healthcare infection control as one of the foremost tools
needed to address emerging infectious diseases.
Preliminary unpublished analysis, please do not reproduce without permission
AR Pathogen Outbreaks and COVID-19
CDC and public health partners responded to 20 outbreaks of AR pathogens in COVID-19
treatment and observation units since April 2020
2 MMWRs about outbreaks from Urgent Threats in hospitals during COVID-19 surges
New Jersey: 34 cases of carbapenem-resistant Acinetobacter baumannii attributed to
changes in infection prevention and control practices1
Florida: 39 cases of Candida auris attributed to unconventional PPE practices and
environmental contamination2
Outbreaks resolve after surge but long-term impact on spread of AR pathogens in a region is
uncertain
1Perez S, Innes GK, Walters MS, et al. Increase in Hospital-Acquired Carbapenem-Resistant Acinetobacter baumannii Infection and Colonization in an Acute Care Hospital During a Surge in COVID-19 Admissions —
New Jersey, February–July 2020. MMWR Morb Mortal Wkly Rep 2020;69:1827–1831.
2Prestel C, Anderson E, Forsberg K, et al. Candida auris Outbreak in a COVID-19 Specialty Care Unit — Florida, July–August 2020. MMWR Morb Mortal Wkly Rep 2020; 70;56–57.
Preliminary unpublished analysis, please do not reproduce without permission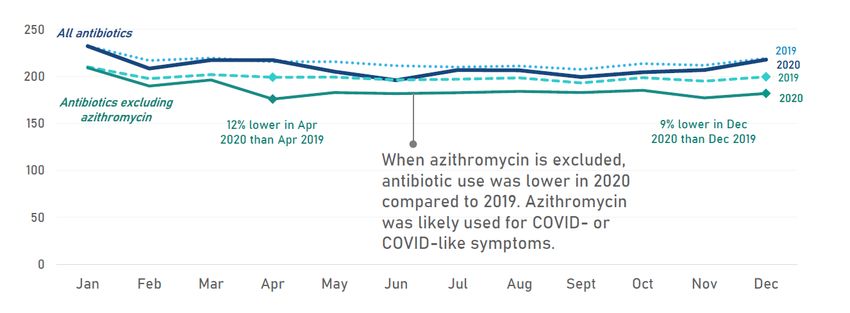
Key Takeaways: Antibiotic Use
Hospitals: Lots of variability.
• Overall increases in some agents (azithromycin/ceftriaxone). No
national increases in broad spectrum agents; some facilities have
seen shifting.
• Decreases in overall prescribing vary; facilities with more COVID-
19 cases had higher rates of prescribing on average for
azithromycin/ ceftriaxone.
Outpatient: Significant drop in antibiotic prescribing.
• Drop appears related to decrease in healthcare utilization;
however, antibiotic use has remained lower than pre-pandemic
levels even as healthcare utilization has risen.
Nursing Homes: Spikes in use.
• Spikes were greatest early in the pandemic and subsequent
increases were lower.
Preliminary unpublished analysis, please do not reproduce without permission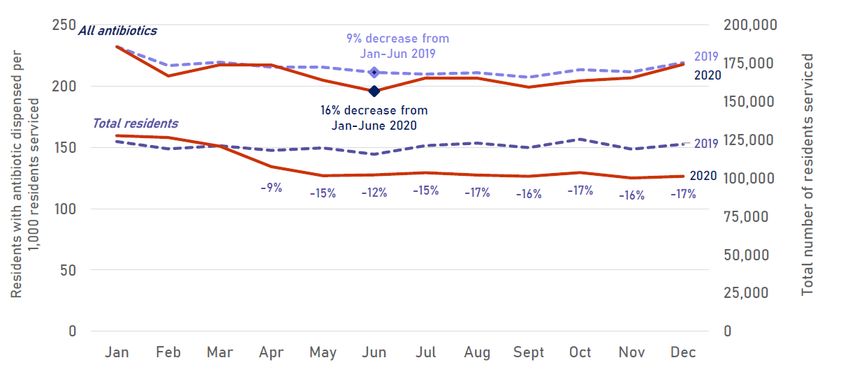
About Data Shown Today
Preliminary data provide the largest snapshot to date about relative
burden of AR infections and antibiotic use in U.S. patients with
COVID-19.
Hospital data reflect:
Infection data from 150+ hospitals and 14,000 hospital discharges
Antibiotic use data from 1,400+ hospitals & 4+ million hospital discharges
2 data systems: CDC’s National Healthcare Safety Network and Premier
Healthcare Database
Outpatient data reflect:
National estimates extrapolated from 92% of retail prescriptions (IQVIA data)
Nursing home data reflect:
Pharmacy info based on PharMerica data from 1,900 U.S. nursing homes
Preliminary unpublished analysis, please do not reproduce without permission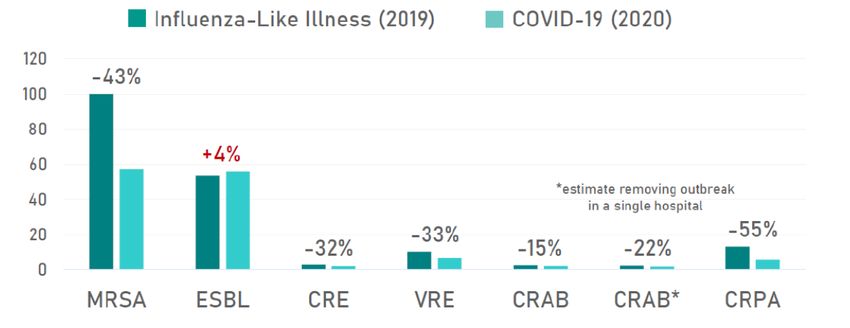
AR Pathogens &
SARS-CoV-2 in
Hospitalized Patients
Patient Discharge Data: Flu & COVID-19

                                                            Patients with Influenza-Like                          Patients with COVID-19
                                                             Illness (Jan-March 2019)                              (Jan-October 2020)

 Median length of stay                                                     5.88 days                                        8.20 days

 Discharges with bacterial/fungal culture                                    55.8%                                             56.7%

 Discharges with an AR-positive culture
 with a susceptibility result
                                                                              12.4%                                             9.1%

 Source: Premier Healthcare Database

 Influenza-Like Illness Definition: A hospitalization with a discharge during January 1, 2019-March 30, 2019, and any of the following ICD-10-
 CM codes: B97.89, H66.9, H66.90, H66.91, H66.92,H66.93, J00, J01.9, J01.90, J06.9, J09.X, J10.X, J11.X, J12.89, J12.9, J18, J18.1, J18.8, J18.9, J20.9,
 J40, R05, R50.9

 COVID-19 Definition: An ICD-10-CM code of U07.1 (confirmed) with a discharge date April–October 2020 or ICD-10-CM code of B97.29
 (suspected) with a discharge date March–April 2020, and admission dates February–April 2020

 Data collected January 10, 2021
                                     Preliminary unpublished analysis, please do not reproduce without permission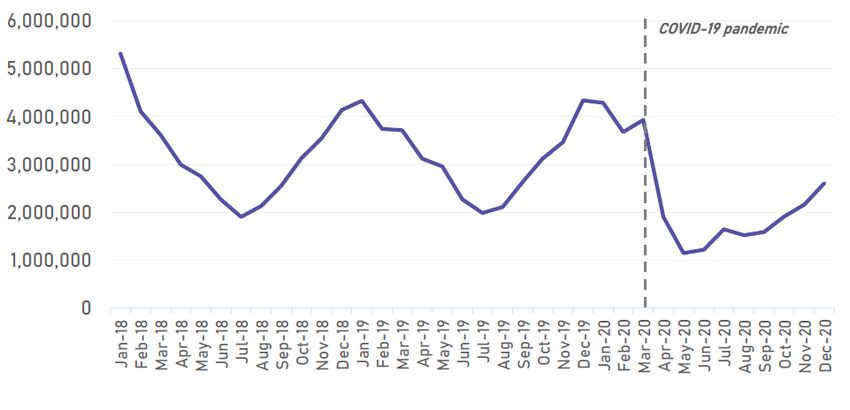
Frequency of Positive Cultures from Patients with
COVID-19 and ILI
                 Proportion of discharges with a positive culture

                                  Source: Premier Healthcare Database
               Preliminary unpublished analysis, please do not reproduce without permission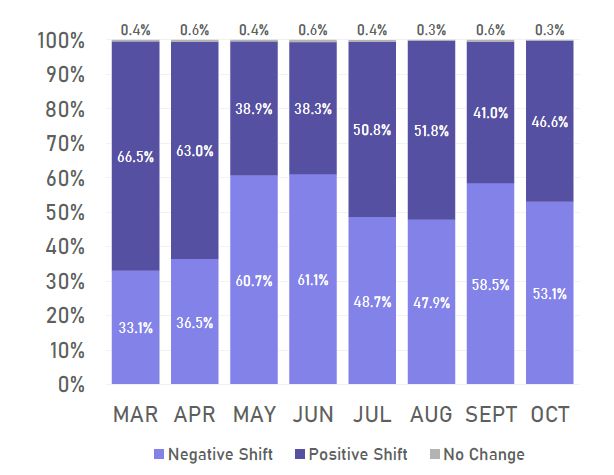
AR Pathogens in Hospitalized Patients:
Community-Onset Infections Only
          Rate of community-onset resistant organisms per 10,000 discharges

                                    Source: Premier Healthcare Database
                  Preliminary unpublished analysis, please do not reproduce without permission
AR Pathogens in Hospitalized Patients:
Hospital-Onset Infections Only
Rate of hospital-onset resistant organisms per 10,000 discharges
Source: Premier Healthcare Database
Preliminary unpublished analysis, please do not reproduce without permissionIncrease in Healthcare-Onset MRSA Bacteremia SIR
in 2020: Quarter 2
Difference in Pooled Values
2019 Q2 2020 Q2 (2020-2019)
N (%)
# Hospitals 3,039 3,039
# Hospitals with ≥ 1 HO event 890 882 -8 (-0.9%)
HO MRSA Events 1,690 1,704 14 (0.8%)
# Predicted HO MRSA 2,064.55 1,813.43 -251.12 (-12.2%)
Patient Days 32,937,724 28,058,539 -4,879,185 (-14.8%)
> Inpatient HO MRSA Rate 5.1 6.1 0.9 (18.4%)
SIR 0.82 0.94 0.12 (14.8%)
Inpatient CO MRSA Events 4,119 3,737 -382 (-9.3%)
Admissions 7,719,330 6,368,916 -1,350,414 (-17.5%)
> Inpatient CO MRSA Rate 5.3 5.9 0.5 (10.0%)
Outpatient MRSA Events 10,615 10,463 -152 (-1.4%)
Outpatient Encounters 28,792,424 19,056,924 -9,735,500 (-33.8%)
> Outpatient MRSA Rate 3.7 5.5 1.8 (48.9%)
Source: National Healthcare Safety Network (NHSN)
Preliminary unpublished analysis, please do not reproduce without permissionLarger Increases in Healthcare-Onset MRSA Bacteremia
in 2020: Quarter 3
Difference in Pooled Values
2019 Q3 2020 Q3 (2020-2019)
N (%)
# Hospitals 3,157 3,157
# Hospitals with ≥ 1 HO event 929 1,082 153 (16.5%)
HO MRSA Events 1,873 2,364 491 (26.2%)
# Predicted HO MRSA 2,339.17 2,359.80 20.63 (0.9%)
Patient Days 37,062,230 36,285,640 -776,590 (-2.1%)
> Inpatient HO MRSA Rate 5.1 6.5 1.5 (28.9%)
SIR 0.80 1.00 0.20 (25.1%)
Inpatient CO MRSA Events 4,620 4,399 -221 (-4.8%)
Admissions 8,747,884 8,157,200 -590,684 (-6.8%)
> Inpatient CO MRSA Rate 5.3 5.4 0.1 (2.1%)
Outpatient MRSA Events 12,277 12,919 642 (5.2%)
Outpatient Encounters 31,896,130 25,779,810 -6,116,320 (-19.2%)
> Outpatient MRSA Rate 3.8 5.0 1.2 (30.2%)
Source: National Healthcare Safety Network (NHSN)
Preliminary unpublished analysis, please do not reproduce without permissionAntibiotic Use During the COVID-19 Pandemic - Hospitals
Aggregate Hospital Antibiotic Use: All Antibiotics
National Healthcare Safety Network (710 hospitals)                                                        Premier Healthcare Database (716 hospitals)
Days of Therapy per 1,000 Days Present – All Antibacterial Agents                                         Days of Therapy per 1,000 patient days – All Antibacterial Agents

Note: NHSN AU days present denominator counts any portion of a day when a patient was hospitalized and thus is larger than the Premier patient day denominator, which counts 24-hour periods.
% indicates percent difference in pooled mean rate by year.
                                                      Preliminary unpublished analysis, please do not reproduce without permission
Aggregate Hospital Antibiotic Use: Azithromycin
National
Healthcare
Safety Network
(710 hospitals)
Days of Therapy per
1,000 Days Present –
Azithromycin
Premier
Healthcare
Database
(716 hospitals)
Days of Therapy per
1,000 patient days–
Azithromycin
Note: NHSN AU days present denominator counts any portion of a day when a patient was hospitalized and thus is larger than the Premier patient day denominator, which counts 24-hour periods.
% indicates percent difference in pooled mean rate by year.
Preliminary unpublished analysis, please do not reproduce without permissionAggregate Hospital Antibiotic Use: Ceftriaxone
National
Healthcare
Safety Network
(710 hospitals)
Days of Therapy per
1,000 Days Present –
Ceftriaxone
Premier
Healthcare
Database
(716 hospitals)
Days of Therapy per
1,000 patient days–
Ceftriaxone
Note: NHSN AU days present denominator counts any portion of a day when a patient was hospitalized and thus is larger than the Premier patient day denominator, which counts 24-hour periods.
% indicates percent difference in pooled mean rate by year.
Preliminary unpublished analysis, please do not reproduce without permissionAggregate Hospital Antibiotic Use:
Piperacillin-Tazobactam
National
Healthcare Safety
Network (710
hospitals)
Days of Therapy per
1,000 Days Present –
Piperacillin-
Tazobactam
Premier
Healthcare
Database
(716 hospitals)
Days of Therapy per
1,000 patient days–
Piperacillin-Tazobactam
Note: NHSN AU days present denominator counts any portion of a day when a patient was hospitalized and thus is larger than the Premier patient day denominator, which counts 24-hour periods.
% indicates percent difference in pooled mean rate by year.
Preliminary unpublished analysis, please do not reproduce without permissionHospital-Level Antibiotic Use: Azithromycin
National Healthcare Safety Network (710 hospitals)
Median shifts in prescribing when a hospital is compared to itself and Percent of facilities with a positive increase in antibiotic use, normalized to
normalized to January 2020 – Azithromycin January 2020 – Azithromycin
Preliminary unpublished analysis, please do not reproduce without permissionHospital-Level Antibiotic Use: Piperacillin-Tazobactam
National Healthcare Safety Network (710 hospitals)
Median shifts in prescribing when a hospital is compared to itself and Percent of facilities with a positive increase in antibiotic use, normalized to
normalized to January 2020 – Piperacillin-Tazobactam January 2020 – Piperacillin-Tazobactam
Preliminary unpublished analysis, please do not reproduce without permissionHospital Antibiotic Use: All Antibiotics
Based on COVID-19 Burden – Premier Data
Rate per 1,000 patient days
Premier Healthcare Database
(716 hospitals)
Median Total Antibiotic Use during
March-October per 1,000 patient days by
COVID-19 Hospital Burden
Hospitals were categorized into quartiles by COVID-19 burden based on the rate of COVID-19 cases per 10,000 discharges for each hospital and month. *indicates statistical significance
Preliminary unpublished analysis, please do not reproduce without permissionHospital Antibiotic Use: Azithromycin
Based on COVID-19 Burden – Premier Data
Rate per 1,000 patient days
Premier Healthcare Database
(716 hospitals)
Median Azithromycin Use per 1,000
patient days by COVID-19 Hospital Burden
Hospitals were categorized into quartiles by COVID-19 burden based on the rate of COVID-19 cases per 10,000 discharges for each hospital and month. *indicates statistical significance
Preliminary unpublished analysis, please do not reproduce without permissionHospital Antibiotic Use: Piperacillin-Tazobactam
Based on COVID-19 Burden – Premier Data
Rate per 1,000 patient days
Premier Healthcare Database
(716 hospitals)
Median Piperacillin-Tazobactam Use per
1,000 patient days by COVID-19 Hospital
Burden
Hospitals were categorized into quartiles by COVID-19 burden based on the rate of COVID-19 cases per 10,000 discharges for each hospital and month. *indicates statistical significance
Preliminary unpublished analysis, please do not reproduce without permissionAntibiotic Use During the COVID-19 Pandemic - Outpatient
National Outpatient Antibiotic Prescription Trends

                                                                  Number of antibiotic prescriptions dispensed from retail pharmacies

December 2020
32% year-over-year decrease
7% month-over-month
increase (compared with 14%
MOM increase in Dec 2019)

Source: IQVIA National Prescription Audit   Last update: January 19, 2021

                                                     Preliminary unpublished analysis, please do not reproduce without permission
National Outpatient Antibiotic Prescription Trends
Number of antibiotic prescriptions dispensed from retail pharmacies
December 2020
32% year-over-year decrease
7% month-over-month
increase (compared with 14%
MOM increase in Dec 2019)
Source: IQVIA National Prescription Audit Last update: January 19, 2021
Preliminary unpublished analysis, please do not reproduce without permissionNational Outpatient Antibiotic Prescription Trends:
Azithromycin
Number of azithromycin prescriptions dispensed from retail pharmacies
December 2020
40% year-over-year decrease
21% month-over-month
increase (compared with 25%
MOM increase in Nov 2019)
Source: IQVIA National Prescription Audit Last update: January 19, 2021
Preliminary unpublished analysis, please do not reproduce without permissionAntibiotic Use During the COVID-19 Pandemic – Nursing Homes
Nursing Home Antibiotic Dispensing Rates
       Residents with antibiotic dispensed and total residents serviced, 2019 vs. 2020

                     Preliminary unpublished analysis, please do not reproduce without permission
Nursing Home Antibiotic Dispensing Rates
Residents with antibiotic dispensed per 1,000 residents serviced – Excluding Azithromycin
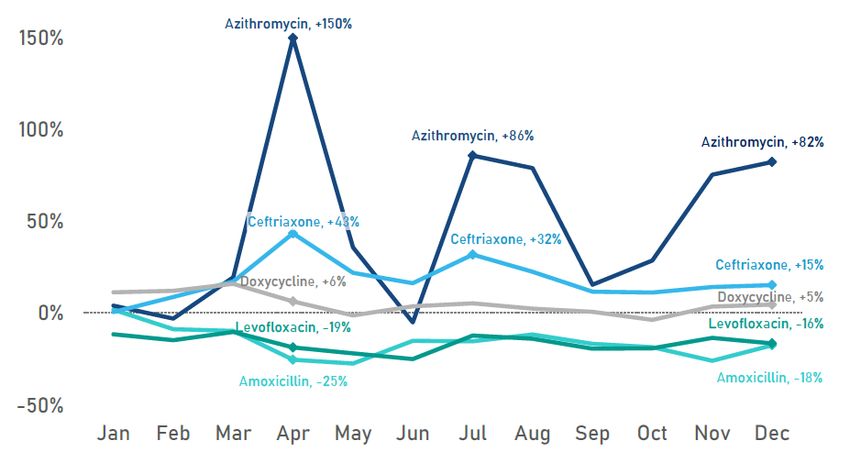
Preliminary unpublished analysis, please do not reproduce without permissionHigher Rates of Antibiotics Commonly Used for
Respiratory Infections in Nursing Homes
Percent change in prescription rate from 2019
Antibiotics higher in
2020 than 2019
Azithromycin
Ceftriaxone
Doxycycline
Antibiotics lower in
2020 than 2019
Levofloxacin
Amoxicillin
Preliminary unpublished analysis, please do not reproduce without permissionMore AR & COVID-19 Studies Coming from CDC
Academic and healthcare collaborations to better understand COVID-19 and
the impacts on AR/AU, some examples:
• University of Pennsylvania
• Washington University School of Medicine
• Cook County Health, Rush University, and Northwestern Medicine
Deeper dive on C. auris and COVID-19 in Orange County and Chicago
International collaborations to explore bacterial/fungal infections and
antibiotic use in patients with COVID-19 in South America and Asia
Publications & additional studies from preliminary data presented today
Preliminary unpublished analysis, please do not reproduce without permissionFuture Implications for AR & COVID-19
Continued emphasis of healthcare infection prevention and control in
infectious disease transmission cannot be overestimated
• Spread of pathogens can be contained and outbreaks can be prevented but we
must ensure ongoing robust infection control training, continuity of PPE supply,
support for frontline healthcare providers
Support greater resiliency in antibiotic resistance and antibiotic use
programs in healthcare and state/local health departments
• Without resiliency, critical work will not happen as new threats emerge
Continued gathering and analysis of AR and AU data from multiple sources
like those presented today is critically important as it allows resilience when
some systems are impacted and provides a fuller picture of impact
Preliminary unpublished analysis, please do not reproduce without permissionAcknowledgements James Baggs Jessica Epting Sarah Kabbani Erin 0’Leary Dawn Sievert Daniel Budnitz Anthony Fiore Alex Kallen Lindsay Parnell Minn Soe Katy Capers Andrew Geller Laura King Sujan Reddy Sharon Tsay Michael Craig Katryna Gouin Jennifer Lind Rebecca Roberts Maroya Walters Heather Dubendris Lauri Hicks Maribeth Lovegrove Ashley Rose Amy Webb Shae Duka John Jernigan Natalie McCarthy Nadine Shehab Hannah Wolford Jonathan Edwards Sarah Jones Melinda Neuhauser Alicia Shugart Hsiu Wu For more information, contact CDC 1-800-CDC-INFO (232-4636) TTY: 1-888-232-6348 www.cdc.gov The findings and conclusions in this report are those of the authors and do not necessarily represent the official position of the Centers for Disease Control and Prevention.
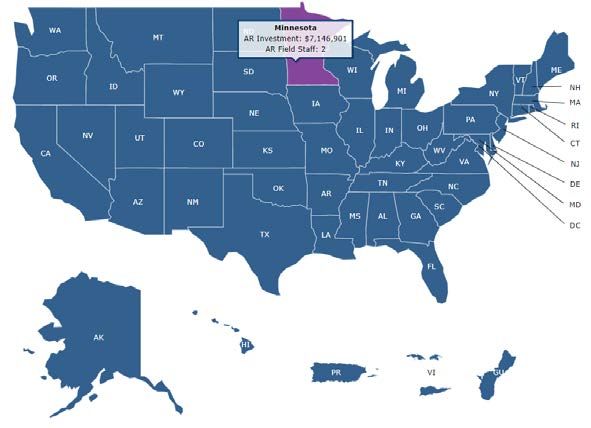
Find More Info on CDC’s Efforts to Combat AR
CDC’s AR Investment Map shows global-, state- and city-
specific fact sheets showing how CDC invested $118+
million in 2020 AR activities—plus a new AR & COVID-19
investment overview: https://ARinvestments.cdc.gov.

                       Preliminary unpublished analysis, please do not reproduce without permission
You can also read