Improving Model Geometry for CFD Analysis
←
→
Page content transcription
If your browser does not render page correctly, please read the page content below
Applied Math Modeling White Paper

        Improving Model Geometry for CFD
                    Analysis

                By Liz Marshall, Applied Math Modeling Inc., Concord, NH

                                           October, 2010

                                                       solid objects, and too much detail can make
Introduction                                           the simulation process more cumbersome
In today’s world, computer-aided engineer-             than it needs to be. This is certainly true in
ing (CAE) is an integral part of engineering           data centers, where small gaps between
design and analysis. At the root of all CAE            equipment are fair game for the CFD solver,
is computer-aided design (CAD), which is               but may not be particularly relevant to the
used to build virtual models of objects and            large-scale flow patterns in the room. Facil-
spaces. CAD models are used as input for a             ity analysts must always consider whether or
number of engineering software packages,               not the air flow in a narrow gap is an impor-
where stress analysis, heat transfer, or fluid         tant feature of the flow in the room as a
flow is simulated. Fluid flow analysis is
done using computational fluid
dynamics (CFD), and this tech-
nology is used for applications
ranging from aircraft wings to
coal furnaces to room air
flows. Despite their close rela-
tionship, CAD models differ
from CFD models in one im-
portant way. With CAD the
focus is on solid geometry, so
more detail is generally consid-
ered better than less detail.       Figure 1: An example of a
With CFD, the focus is on the       mesh, used for perform-
fluid flow in the space between ing a CFD calculation of
                                      the air flow in a room
© 2010 Applied Math Modeling Inc.                  1                                            WP104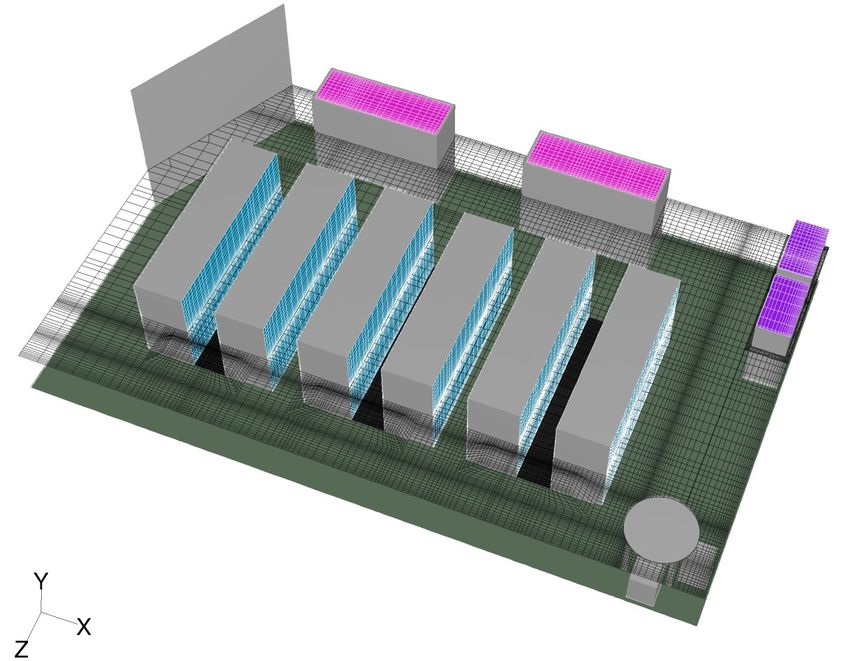
whole. It if is not, the geometry should be           cases, the results confirm that the simpler
modified to eliminate such gaps. Cleaning             geometry is more cost effective for the appli-
up – or more accurately, dumbing down – the           cation of CFD.
geometry in this manner can make for a
much more rapid time to CFD solution with             Case 1
minimal impact on the final results.
                                                      Problem Definition
The CFD simulation process begins with the            A 5000 sq.ft. L-shaped data center is in op-
construction of the model geometry. In the            eration at a major medical facility in the
case of a data center, this includes the room,        Northeast. It has a raised floor and ceiling
the equipment in the room, and perforated             return. Three downflow CRACs with turn-
floor tiles and ceiling grills to allow for the       ing vanes are positioned on the perimeter and
passage of air, as needed. Once the room              an upflow CRAC is positioned in the center
geometry is specified, a computational mesh           of the room. Ductwork is used to pipe the
is built. The mesh (Figure 1) is used to break        supply air from the upflow CRAC to several
up the air space into thousands or millions of        locations around the room.
small cells. In each of these cells, the rele-
vant variables are computed and stored. It            Racks with heat loads ranging from 10 Watts
is widely believed that models with more              to 8 kW comprise a total heat load of 226
cells have the potential to offer a more accu-        kW with a heat density of about 45 kW/sq.ft.
rate solution, assuming that the equipment is         Four power density units (PDUs) each add an
represented correctly. Cells can be wasted,           average of 1 kW of heat to the room. The
however, if they are used in regions where            supply plenum contains a number of pipes
the information is not relevant. When this            and blockages. The rooms adjacent to the
happens, the cell count is larger than it needs       data center are at a constant temperature of
to be but the accuracy in the solution is no          72°F, and the wall resistance is 2 ft2-F/(Btu/
better. Furthermore, the time to solution can         Hr).
be considerably longer than it needs to be.

To illustrate this point, two models of me-           In the original model, the racks – and 1inch
dium-sized data centers are considered using          gaps between them - were properly sized, as
CoolSim software. The original models of              shown in Figure 2 (top). Gaps created in this
the data centers are both accurate in the CAD         fashion are assumed to be important details
sense. All of the equipment is carefully rep-         when the automated mesh generator goes to
resented, but as a result, there are gaps be-         work. However, their importance in the
tween adjacent equipment or there is exces-           global data center flow is questionable. To
sive geometric detail. The models are then            find out how important the gaps are, a second
“improved” for CFD by simplifying the ge-             model is built in which the racks have the
ometry. The simulations are run and a thor-           same location but are given a slightly in-
ough comparison is done to contrast the               creased width to eliminate the gaps. The
original and modified geometries. In both
© 2010 Applied Math Modeling Inc.                 2                                           WP104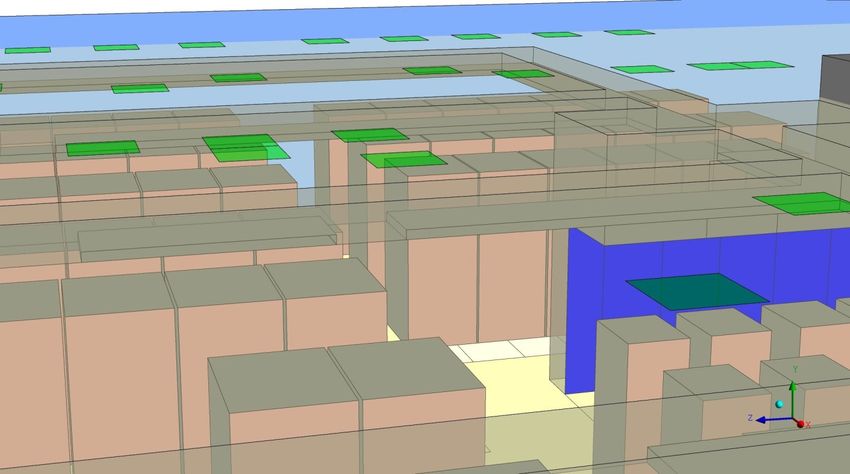
shows that the maxi-
                                                                       mum room temperature
                                                                       differs by only 1°F
                                                                       while the maximum rack
                                                                       inlet temperatures are
                                                                       identical. The maxi-
                                                                       mum flowrate through a
                                                                       perforated tile is within
                                                                       1% while the minimum
                                                                       is within 8%. Taking a
                                                                       closer look at the maxi-
                                                                       mum rack inlet tempera-
                                                                       tures, 35% have the
                                                                       same value and only 3%
                                                                       have a value that differs
                                                                       by more than 5%. The
                                                                       maximum difference in
                                                                       the average rack inlet
                                                                       temperature is 5% for all
                                                                       racks in the room.
                                                                       Based on these results,
                                                                       simplification of the
                                                                       model has the benefit of
                                                                       reducing the model size
                                                                       and time to solution
                                                                       without introducing
                                                                       negative consequences
                                                                       such as large scale error
                                                                       in the results.
Figure 2: In the CAD-style geometry (top), the racks are accurately
sized, but have 1 inch gaps between them; a CFD-style geometry
(bottom) eliminates the gaps between racks by increasing the
widths by 1 inch

                                                                          With Gaps No Gaps
modified geometry is shown in Figure 2
                                       Number of Cells                       3.766 M     2.801M
(bottom).
                                           Solution Time (Hours)                  4.53      3.74
Results
                                           Max Room Temperature (°F)               81         82
A CFD analysis is done using both of
the geometries and the results are com- Max Rack Inlet Temperature (°F)           77          77
pared in Table 1. The results show that Max Perf Tile Flowrate (CFM)             729         734
elimination of the gaps leads to a model
                                         Min Perf Tile Flowrate (CFM)            472         436
with about 1 million fewer cells. The
time to solution is reduced by about 45   Table 1: A comparison of the size, solution time, and
minutes. Comparison of the results        a few results for the data center modeled with and
                                             without gaps between the equipment
© 2010 Applied Math Modeling Inc.               3                                         WP104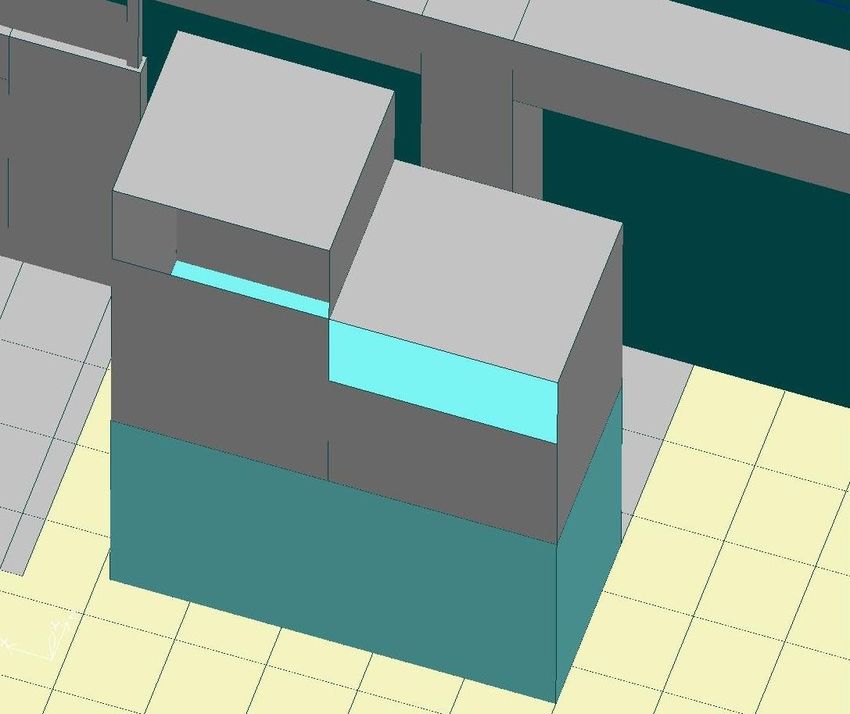
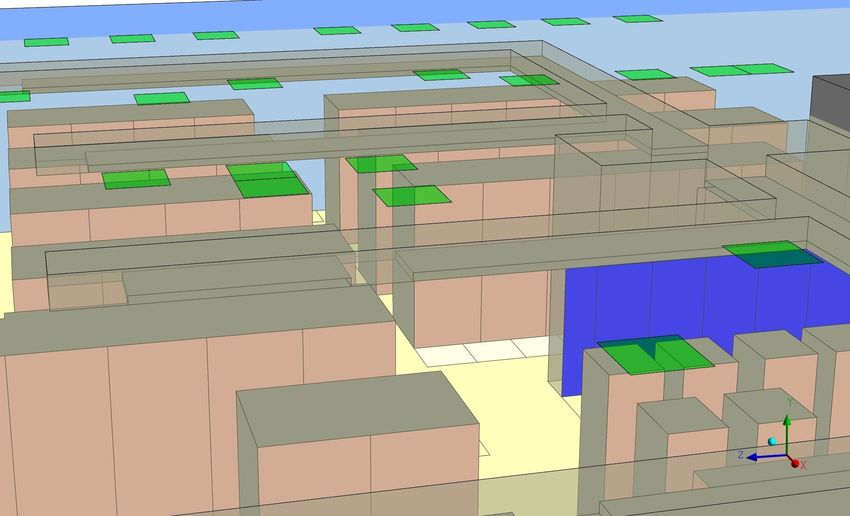
Case 2 used to guide the return air in an area where a
number of geometric constraints are present.
Problem Definition The original CFD model of the CRAC and
As a second example, consider one of the top is shown in Figure 3. While the top is an
small data centers at a large collocation facil- accurate representation of reality, its com-
ity. The 2500 sq. ft. raised floor data center plexity is perhaps more than is needed. After
has two downflow CRACs, one of which is all, the fan in the CRAC return will draw the
outfitted with a complex structure on the re- air into the unit. The role of the mounted
turn. The equipment heat load in the room is structure is simply to guide the air into the
about 100 W/sq.ft. and the complex top is
Figure 3: A complex structure mounted on the return of a downflow CRAC is used to
help guide the return air back to the unit
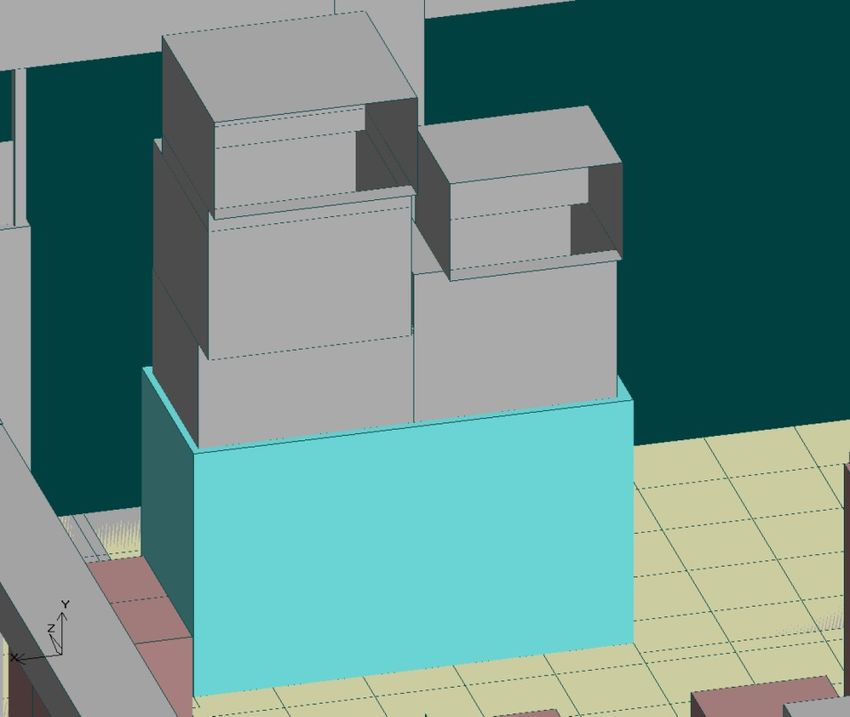
Figure 4: A simplified structure on the CRAC return does not have all of the features
of the original, but does include the essential shielding and open areas
© 2010 Applied Math Modeling Inc. 4 WP104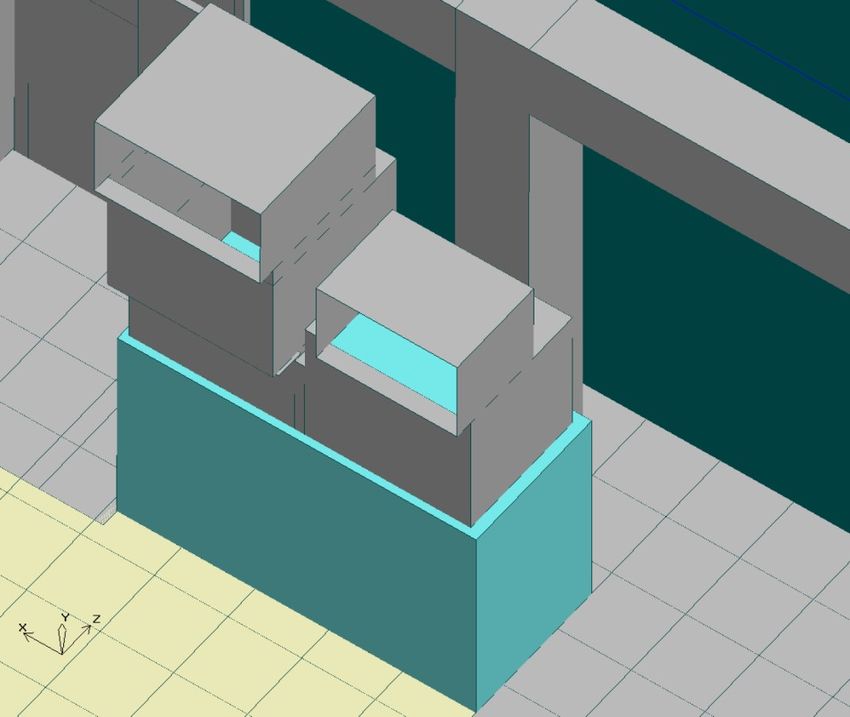
openings and a much simpler structure could          Looking again at the maximum rack inlet
accomplish the same goal.                            temperatures, half of the racks have identical
                                                     values and only 1 rack has values that differ
An alternative design is shown in Figure 4,          by more than 5%. For the average rack inlet
where one such simplified structure is               temperature, all of the racks in the room
shown. It has the same overall dimensions as         agree to within 0 or 1% except two, where
the complex structure, but avoids the minute         the agreement is within 2.5% and 5%. This
detailing.                                           example further illustrates that less complex-
                                                     ity in a CFD model can translate into more in
Results
                                                     terms of decreased time to solution with neg-
Using the two CRAC top designs as the only
                                                     ligible loss of accuracy.
difference between the cases, two CFD simu-
lations are performed and the results com-
                                                     Summary
pared. An overview of the results is summa-
rized in Table 2.                                    These examples demonstrate that for the pur-
                                                     pose of CFD modeling, simplified geometry
                                                             has advantages over complex, CAD-
                                  Complex     Simple
                                                             style geometries. In addition to saving
Number of Cells                      1.590 M     1.168M      on the number of computational cells
Solution Time (Hours)                    2.32        1.87    and solution time, the effort involved
Max Room Temperature (°F)                  98          96    in the setup is reduced as well. With
                                           91          90
                                                             automatic grid generation and solution
Max Rack Inlet Temperature (°F)
                                                             procedures in place for software de-
Max Perf Tile Flowrate (CFM)            2,530      2,515
                                                             signed for data center modeling, time
Min Perf Tile Flowrate (CFM)              839         818    savings during the setup can be sig-
                                                             nificant. For the complex CRAC top,
  Table 2: A comparison of the size, solution time,
  and a few results for the data center modeled with a
                                                             for example, the original structure was
  complex CRAC top and a simple CRAC top                     built using 33 baffle objects. By con-
                                                             trast, the simple model needed only 9
By changing only the structure on top of one         baffles. Even if the final goal is to have a
of the CRACs in the room, about 400,000              CFD model with a large amount of geometric
cells are saved and the CPU time is reduced          detail, these results show that simplified
by just under 30 minutes - or 19%. The               models are an excellent first pass solution
maximum rack inlet temperature differs by            and indeed, are usually just as good as mod-
1°F and the maximum temperature in the               els with increased detail.
room by 2°F. The maximum and minimum
flowrates through the perforated tiles are
within 2.5%.

© 2010 Applied Math Modeling Inc.                5                                            WP104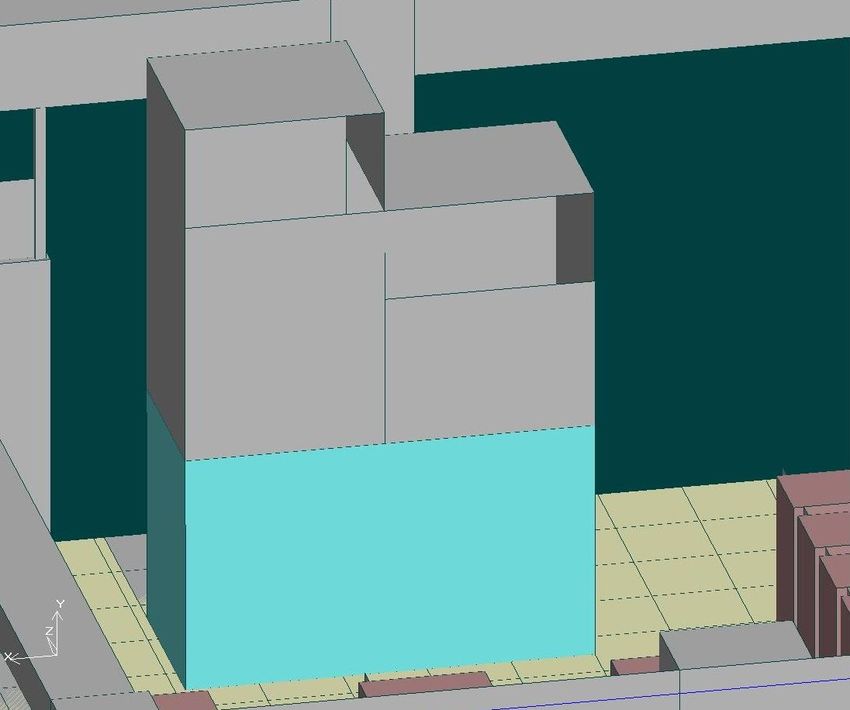
You can also read