WINTER 2020 INVESTOR PRESENTATION - Artificial Intelligence Meets Ecommerce - The ...
←
→
Page content transcription
If your browser does not render page correctly, please read the page content below

Artificial
                                    Intelligence
                                    Meets
                                    Ecommerce

WINTER 2020 INVESTOR PRESENTATION

                                                   1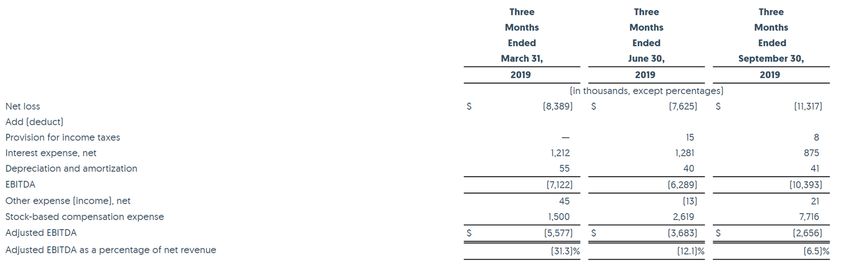
Disclaimer
             CAUTION CONCERNING FORWARD-                  All forward-looking statements are        NON-GAAP FINANCIAL MEASURES
             LOOKING STATEMENTS                           based upon current estimates and          In addition to financial results prepared
             This presentation includes “forward-                                                   in accordance with U.S. generally
                                                          expectations about future events and
             looking statements” with the meaning                                                   accepted accounting principles
                                                          financial and other trends. There is no
                                                                                                    (“GAAP”), this presentation contains
             of Section 27A of the U.S. Securities        guarantee that future results,            certain non-GAAP financial measures.
             Act of 1933, as amended, and Section         performance, or events reflected in the   Such non-GAAP financial measures in
             21E of the U.S. Securities Exchange Act      forward-looking statements will be        this presentation may differ from
             of 1934, as amended.                         achieved or occur.                        similarly named non-GAAP financial
             All forward-looking statements are           No person assumes responsibility for      measures used by other companies.
             subject to a number of risks,                                                          Management believes that in addition
                                                          the accuracy and completeness of the
             uncertainties and assumptions, and you                                                 to using GAAP results, non-GAAP
                                                          forward-looking statements, and,          financial measures can provide
             should not rely upon forward-looking         except as required by law, no person      meaningful insight in evaluating the
             statements as predictions of future          undertakes any obligation to update       Company’s operating performance. You
             events. You can identify forward-            any forward-looking statements for any    are encouraged to review the
             looking statements by words such as          reason after the date of this company     reconciliation of non-GAAP financial
             “anticipate,” “believe,” “could,”            presentation.                             measures with their most direct
             “estimate,” “expect,” “intend,” “may,”                                                 comparable GAAP financial results set
             “plan,” “potential,” “predict,” “project,”                                             forth in the Appendix to this
                                                          INDUSTRY & MARKET DATA
                                                                                                    presentation.
             “should,” “will,” “would,” or the negative   Certain data in this presentation was
             of those terms, and similar expressions      obtained from various external sources.
                                                                                                    For a full discussion of the Company's
             that convey uncertainty of future events     Neither the Company nor its affiliates,
                                                                                                    risks, you should review the Company's
                                                          advisers or representatives have
             or outcomes.                                                                           existing SEC filings including the
                                                          verified such data with independent
                                                                                                    Company's most recently filed Form
                                                          sources. Accordingly, neither the
                                                                                                    10Q for the period ended September
                                                          Company nor any of its affiliates,
                                                                                                    30, 2019
                                                          advisers or representatives make any
                                                          representations as to the accuracy or
                                                          completeness of that data or to update
                                                          such data after the date of this
                                                          presentation. Such data involves risks
                                                          and uncertainties and is subject to
                                                          change based on various factors.

                                                                                                                                                2
WHO IS MOHAWK?

Mohawk is
                Proprietary technology
the Consumer    leveraging AI to automate
                                                ●    Identifies new market opportunities

Products        various aspects of
                                                ●    Launches new products
                                                ●    Manages marketing variables
Company         eCommerce:
of the Future

                Categories         Home                     Consumer
                                 Appliances   Kitchenware   Electronics   Beauty Products

                Marketplaces
                Focus
Mohawk Sits
High Growth CPG
at the Intersection
of CPG & Technology
Direct-to-Consumer Technology
platform
4The Decline of WHERE CUSTOMERS BEGIN SEARCHING FOR PRODUCTS (1)
Brand influence
Brands in a World is declining
of Data Driven 60%
2015
2016
Over half of millennials,
Consumers 50%
51%, have no real
preference between
private-label and
40% national brands
To derive the most
value from a product, 30%
Only 22% of searches on
shoppers are driven by Amazon include a brand
data using 20% name (2)
a mixture of:
10%
Search keywords
highlight how Amazon
0%
Reviews + Social Media + Store-to-store shoppers’ behavior is
Sources pricing shifted from a brand-
driven world observed
Amazon Search Retailers elsewhere to a needs-
Engines based decision process
5
1: BloomReach, State of Amazon 2016 2: Marketplace Pulse Article July 1, 2019Massive and Growing RETAIL ECOMMERCE SALES WORLDWIDE &
% OF TOTAL RETAIL SALES (1)
Total Addressable
Market $ In trillions
$7.0 $6.5
$6.0 $5.7
$4.9
Worldwide eCommerce $5.0
$4.2
Sales are expected $4.0 $3.5
to grow: $2.9
$3.0 $2.4
$4.2 trillion 22.0%
$2.0
in 2020 20.0%
18.1%
$1.0 16.1%
$6.5 trillion 14.1%
12.2%
by 2023 10.4%
$-
2017 2018 2019 2020 2021 2022 2023
CAGR: 18.1%
6
1: eMarketer, Worldwide Retail and e-Commerce Sales: eMarketer’s Estimates for 2017 - 2023AIMEE Multi-Channel
eCommerce Platform
1 2 3
AIMEE ingests Defines right product Targets high intent
massive amounts specs consumers
of data
USABLE WITH ANY PRODUCT AND ANY BRAND
7Thank
AIMEE You
DemonstrationTime Advantages vs Incumbents
18 - 24 Month Go-To-Market Cycle 3 Month Marketing Cycle
Standard
Business
Model
● Idea ● Manufacturing ● Agents ● Retailer
● Focus Group ● Shipping ● Distributor ● Customer
● R&D ● Warehousing ● Ad Agency
AIMEE Idea Generator AIMEE Trading Engine
Mohawk
Business Real Time ● Manufacturing Data Driven Automated ● Marketplaces
Model Data Driven Opportunity & ● Shipping Marketing & Product Lifetime ● Customer
Trend Tracking ● Warehousing Management
6 - 8 Month Go-To-Market Cycle 1 min - 1 hr Marketing Cycle 9Proven Product Success
Offers quality hair products and tools Brings quality home appliances from
~250 at a cost effective price Window ACs to Ice Makers, delivering the
SKUs features consumers want
~80%
of Product Provides affordable, user-friendly home Offers Cube, a mobile mini projector and
Revenue Reaches and kitchenware Sound Cube, a wireless, Bluetooth mini
Sustain speaker
10Platform Leverage Effect
Business Model
AIMEE’s automation creates
operating leverage and
allows us to manage a
growing number of products
while keeping operating
costs growing linearly
Demand for existing and
new products combined with
growing shift in consumer
consumption to e-commerce
Products
leading to market share Cost OPS
gains
11AIMEE Delivering Results
Number of $500k Products Top 20 Products Average Review Count
40 37 1,400
1,203
35 1,200
30 1,000 923
25
21 800 717
20 18
600
15
400
10
6
200
5
0 0
2016 2017 2018 2019E 2017 2018 2019
Average Review Score Average Review Score Products Listed in Top 5
(All Mohawk Products): 4.5 Stars (>$500k Products): 4.6 Stars in Amazon Searches: 47
12
* Data accurate as of 12/2019Business Model Driving Improved Y/Y Results
($mm) 2017 2018
0%
$140
-10%
$120 $114-$115*
$100 -20%
-30%
-39%
$80
$73
$60 -40%
-59%
$40 $36 -50%
$20
-60%
$0
2017 2018 2019E -70%
Revenue Adjusted EBITDA % of Revenues
*2019 Estimates 13Business Model Driving Improved Y/Y & Q/Q Results
($MM) 1Q19 2Q19 3Q19
($MM) ($MM) 1Q19 2Q19 3Q19 $4
$45 $0
$40
+64% $2
$3.1
($1) $0
$35 ($2.7)
$30
+108% ($3.7) ($2)
($2) ($4.4)
($5.6)
$25 ($4)
($40.6)
($3) +40%
$20 +25% ($6)
$15 ($30.4)
($4) +55% ($8)
($11.9)
$10 ($17.8)
($10)
$5 ($5)
$0 ($12)
1Q19 2Q19 3Q19 ($6)
+33%
($14)
Cash Used in Operating
Revenue Adjusted EBITDA
Activities
14Multiple Opportunities
to Drive Growth / Profitability
1 2 3 4
Pursue higher value Expand into Continue to optimize Continue to expand into
products and larger international markets unit economics new domestic
product markets and other online on existing product eCommerce
marketplaces portfolio marketplaces
5 6 7
Monetize AIMEE Opportunistically add Drive manufacturing
platform by providing new products and and logistics costs
access to third-party categories through down from purchasing
brands acquisition power
15Investment
Highlights
1 2 3 4 5
Rapidly growing Proprietary AI / ML Massive and Improving Founder-led
and highly scalable tech platform to drive growing financial metrics and experienced
business model addressable with clear management team
● New product market pathway to
ideation profitability
● Automated sales
and marketing
● Real-time supply
chain visibility
16Thank You Appendix
Management
                                                                                   Team
 Yaniv Sarig       Fabrice Hamaide     Peter Datos      Roi Zahut   Tomer Pascal
Co-Founder & CEO        CFO                COO            CTO           CRO

                                     PRIOR EXPERIENCE
                                                                                   Deep experience in
                                                                                   eCommerce, CPG &
                                                                                   Tech

                                                                                                        18
Non-GAAP Reconciliations: Adjusted EBITDA
19You can also read