January 2018 Investor Presentation - Dynacor Gold Mines
←
→
Page content transcription
If your browser does not render page correctly, please read the page content below
January 2018 Investor Presentation
A Gold Cash Flow Business Model

               A lower risk                                                                                                                   $0.33
              gold producer                                                                                                                  cash flow
               $13M+ CF                                                                                                                      per share
               annualized                                                                                                                   annualized
                                                             A Debt-Free
                                                            Cash Generator
          Paid off US$ 6.3
                                                                                                                                  26 consecutive
           million of debt
                                                                                                                                  quarters of profit
          in last 5 months

*CF (Cash Flow) based on Q3-2017 cash flow from operating activities before change in working capital annualized; US to CAD exchange 1.25

   dynacor.com                                                 DNG – TSX | DNGDF - OTC (Q)                                                               2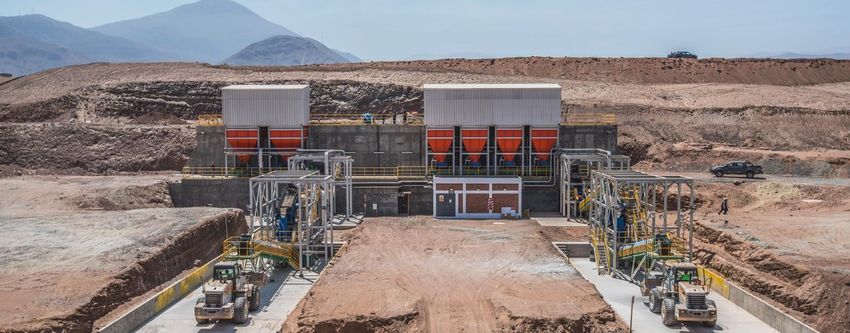
Capital Market Summary
                        Market Summary
                    Stock Price (Year High-Low)             $1.50 - $2.75
                           Ticker Symbol                     DNG - TSX
                    Shares Outstanding (Basic)                  39M
                             Warrants                            Nil
                  Average Daily Volume (Shares)                90,513
                         Monthly Dividend                       TBD
                           Dividend Yield                       TBD
              Director & Senior Management Ownership            4%
                        Capital Structure
                       Market Capitalization                    74M
               Enterprise Value (As of Sept 30, 2017)           82M
                               Debt                              Nil

dynacor.com                   DNG – TSX | DNGDF - OTC (Q)                   3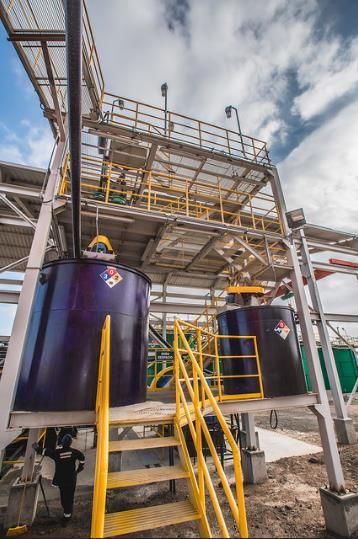
Shareholder Return 2008-2018                                             Q3-2018
                                                                         Implied Share
                                                                             Price
                                             DNG-TSX stock price          See Slide #9
                                             S/P TSX Global Gold Index

                                               32%
                                             annualized
                                            return since                          2200%
• Continues to profit through the                2008                              2000%

  cycles of the gold market                                                       1800%
                                                                                  1600%
                                                                             1558%
                                                                                 1400%

• Built to survive and prosper with or                                            1200%
                                                                                  1000%
  without a gold bull environment                                                 800%
                                                                                  600%
                                                                                  400%

                                                                           -38%   200%
                                                                                  0%
                                                                                  -200%

dynacor.com                DNG – TSX | DNGDF - OTC (Q)                                    4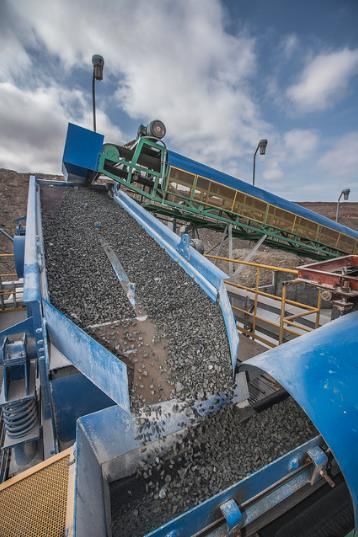
The Cash Flow Proven Dynacor Model
                     Weigh, assay and
                                                        3       Pay miners after

           2
                        screen ore                              24 hours from
                      deliveries for                              delivery and
                       gold content                                process ore
                       at our new                                 through mill
                      modernized
                        plant

                                                                                                 4
                                                                                   After 10-14
           Receive ore                                                               days of
                                                                                    processing

1
         shipments from

                                                                5
         more than 400                      Receive payment
           government                      for gold dore bars
            registered                      from strategic
        Peruvian artisanal                  partner, PX
           gold miners
                                             Precinox

dynacor.com                             DNG – TSX | DNGDF - OTC (Q)                                  5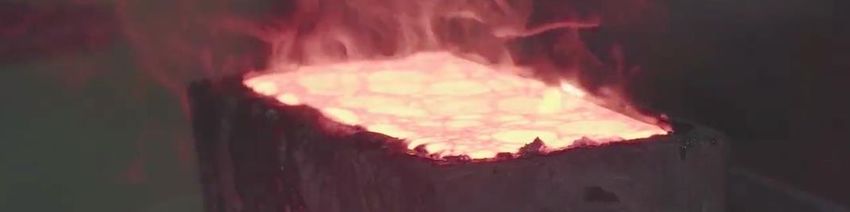
Record High Gold Production

                 Monthly gold production ounces (Jan-Dec 2017)
                                                                                                      8,910
9,000
                79,897 ounces
                                                                                      7,905               +71%
8,000          produced in 2017
                                                                              7,192           7,253
                                                      6,895           7,042
7,000                 6,733
                                                              6,287
                                              6,206                           24,068 ounces produced
6,000                                                                             in Q4-2017, an
              5,208           5,181   5,087                                     annualized basis of
5,000                                                                         nearly 100,000 ounces
4,000
              Jan Feb Mar Apr May Jun                         Jul Aug Sep Oct Nov Dec

dynacor.com
dynacor.com                             DNG – TSX | DNGDF - OTC (Q)                                           6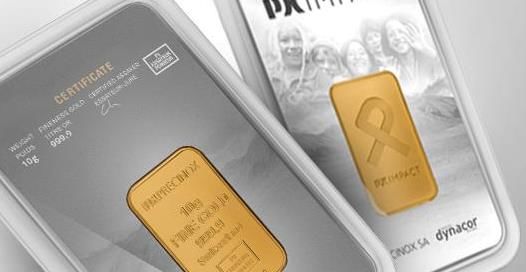
Ore Supply and Deliveries Growing

                          Average Monthly Ore Processing Rate (TPD) in 2017
    310                                                                                                   300
                                       2018 goal ramp up to
    285                                                                                                         +62%
                                                  360 TPD                               265
                                                                                              270
                                                                                                    265
    260                                         (tonnes per day)               245

    235
                               220
                                                                  215
    210                                     200
                                                                         190
                 185                                       185
    185                                             180

    160
                Jan          Feb Mar Apr May Jun                         Jul   Aug Sep Oct Nov Dec
*TPD is rounded to the nearest five (5) units

   dynacor.com
   dynacor.com                                            DNG – TSX | DNGDF - OTC (Q)                             7
Rising Cash Flow & Compelling Value

      Cash Flow Per Ounce $CAD                         Q4     Q1     Q2     Q3
                                       $CAD
165
                                                      2016   2017   2017   2017
                                     CF From
140                                            1,067 2,326 1,917 3,268
                                    Operations
115
                                      CF Per
                             159               0.03 0.06 0.05 0.083
 90           136                     Share
 65                  105                CF
         51                                     11    11     9     9
                                     Multiple
 40

                                      Currently Trading With A Multiple of
                                         8.9 Times Cash Flow

dynacor.com
dynacor.com             DNG – TSX | DNGDF - OTC (Q)                          8
Annualizing CF On Last Quarter Report
Last 2
Q3 2018 Assumes
CAD$ Q3 2018 Implied
(Millions)
Q3 2017
(TTM)
Yrs Price to CF
Share 10-13
Multiple Range
Price times
Cash Flow $0.33
From 3.3 13.0 $3.30 cash flow
Operations 10-13 to
Cash Flow $4.16 per share
Per Share
0.08 0.33 (TTM)
Gross Margin %
13% 12% 14%+40%
15 10%
10
5
Q4-16 Q1-17 Q2-17 Q3-17
*CF (Cash Flow) based on Q3-2017 cash flow from operating activities before change in working capital annualized; US to CAD exchange 1.25
dynacor.com
dynacor.com DNG – TSX | DNGDF - OTC (Q) 9Strong Strategic Partner With Swiss Co
PX Precinox (www.pxgroup.com)
• Is one of 10 companies under the PX Group
• Experts in precious metal refining
• Mastered the process of high quality refining to finishing
• A leading Swiss producer of gold bars
• Partner of the PX Impact Gold Program
dynacor.com DNG – TSX | DNGDF - OTC (Q) 10Circulating New PX Impact Gold
Environmental, social and ethical Guarantees complete traceability
practices that respect human rights are an across the gold ore supply chain coming
integral part of the PX Impact Gold program from government registered miners in Peru
An investment PX Impact 100% of the
premium flows back premium is paid into
to our
miner’s
Equals the fund and reinvested
into Dynacor’s mining
communities
Ethical Gold communities
A lasting & positive contribution The fund finances projects
to the economic, social and environmental in health, education, economic dev & the
development of our mining communities environment of the mining communities
dynacor.com DNG – TSX | DNGDF - OTC (Q) 11Strategic Plan
Short Term Strategy > 3 – 12 Months
• Self fund throughput growth to 360 TPD (CAPEX 2 – 5 Years
• Expand throughput growth to 600+ TPD
• Bring to fruition low risk development plan on gold project, Tumipampa
• Establish world renown brand as socially accountable high quality gold
• Target yield contraction through responsible shareholder dilution plan and
per share growth (a sustainable/steady dividend history)
dynacor.com
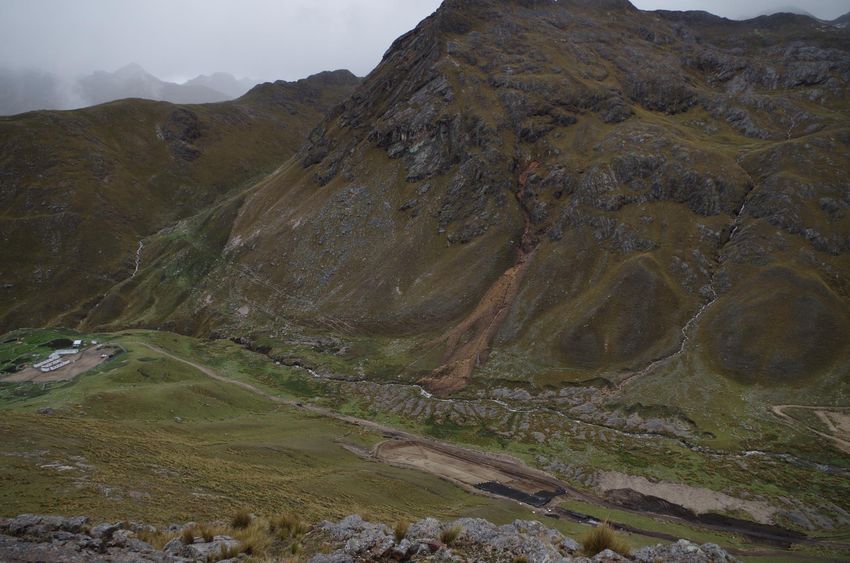
dynacor.com DNG – TSX | DNGDF - OTC (Q) 12Our Exploration Asset, Tumipampa • 500 km southeast of Lima • 9,756 ha • Surface results pending • Drilling planned for 2018 (drill results) • 21,610 meters of drill results • 2,881 meters of underground workings dynacor.com dynacor.com DNG – TSX | DNGDF - OTC (Q) 13
Concession Map
BEER CREEK
GOLDEN
IDEAL
GOLD
MINING
SUPER
STRONG
FRESNILLO PERU PROYECTO TUMIPAMPA
MINERA DEL NORTE SA
CONCESSION
TAPAIRIHUAJA TRIVEÑO
(VETADORADA)SOUTHERNPERU
BARRICK
DISEMINADO
TUMIPAMPA MAP
FRESNILLO PERU V 2014
TUMIPAMPA
SOUTHERN TUMIPAMPA TUMIPAMPA
X 2014
BARRICK IV 2014 VB 2014
ANGLOAMERICAN ORTEGA
TUMIPAMPA
TUMIPAMPA III 2014 XI 2014
MERIDIAN TUMIPAMPA CONCESIONES
SOUTHERN (HORIZONTE) ORTEGA ORTEGA MERIDIAN VI 2014 TUMIPAMPA
PERU
(HORIZONTE) 9755.60 Aprox. Has -Área
NICOLE 11 neta
TUMIPAMPA Total 22 Concesiones
TUMIPAMPA IX 2014
IAM GOLD VII 2014
ORTEGA CONCESIONES PERSONAS
NATURALES Y/O PPM
TUMIPAMPA
TUMIPAMPA
VIII 2014 ZONAS LIBRES
ORTEGA XII 2014
CHANCADORA CENTAURO MERIDIAN
(HORIZONTE) BARRICK PETITORIOS EN DISPUTA
DESDE EL 2014
0 1 2km
Escala Gráfica
dynacor.com
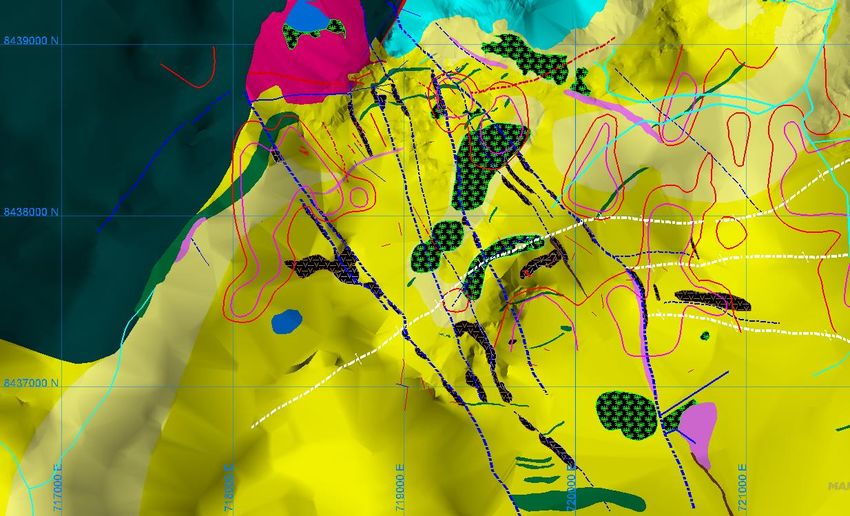
dynacor.com DNG – TSX | DNGDF - OTC (Q) 14Geological Map Of Disseminated Zone
Caliza Km-Fe
Laguna
patacocha
N
Cuarzomonzonita 19.49 g/t Au
18.18 g/t Au 3.57 g/t Au 11.30 g/t Au
8.21 g/t Au
Veta Cuyana7.63 g/t Au 10.94 g/t Au 3.17 g/t Au 5.06 g/t Au
16.79 g/t Au 4.56 g/t Au
Mármol
Km-Fe 28.60 g/t Manto
Au Lucha ANOMALIA 5
ANOMALIA 2
31.16 g/t Au 6.15 g/t Au
Veta sondoro
22.09 g/t Au ANOMALIA 1 ANOMALIA 3
7.38 g/t Au ANOMALIA 6
4.86 g/t Au 3.35 g/t Au
9.01 g/t Au
3.66 g/t Au SECCION L 37800
1.26 %/Cu Cuerpo Sumac ANOMALIA 4
35. 58 g/t Au
Bx. Adriana
LEYENDA
CALIZA (Ki-Fe)
BOFEDAL
CUARZO MONZONITA
CUARZO DIORITA
MARMOL (Ki- Fe)
CUARCITA Au (gr/tn)
EXOSKARN 0 1 KM Sym >=Minimum = 3.00 100.00
dynacor.com
dynacor.com DNG – TSX | DNGDF - OTC (Q) 15Investment In Dynacor
Near Term Catalysts
✓ Recent debt free status removes interest from 2018 financials
✓ Lower costs and higher earnings with greater gold production
✓ 2018 quarterly financials comparing to 2017 start up year
✓ Annualized CF per share of CAD $0.33 (P/CF range 10-13X)
✓ Defining new dividend policy (increases ROI)
✓ Renewing Tumipampa drill campaign (drill results)
dynacor.com
dynacor.com DNG – TSX | DNGDF - OTC (Q) 16Forward Looking Statements This presentation contains certain forward-looking statements regarding operational information, future exploration and development plans and anticipated future production. Words such as, potential”, “building” “inferred”, “if”, “will”, “expect”, “forecast”, “estimate”, “consider”, “may”, “possible” and similar expressions have been used to identify these forward-looking statements. These statements are management’s current beliefs and are based on information currently available to management. Forward-looking statements involve significant risk and uncertainties. A number of factors could cause actual results to differ materially from the results discussed in the forward-looking statements including, but not limited to, changes in general economic, political and market conditions and other risk factors. Although the forward- looking statements contained herein are based upon what management believes to be reasonable assumptions, management cannot assure that actual results will be consistent with these forward-looking statements. Investors should not place under reliance forward-looking statements. Forward-looking statements and other information contained herein concerning the metals and mining industry and Dynacor’s general expectations concerning the industry are based on estimates prepared by management using data from publicly available industry sources as well as from private sources, industry analysis and on assumptions based on data and knowledge of the this industry which the Company believes to be reasonable. However, this data is inherently imprecise. While Dynacor is not aware of any misstatements regarding any industry data presented herein, the industry involves risks and uncertainties and is subject to change based on various factors. There is no certainty the projections will be met. dynacor.com dynacor.com DNG – TSX | DNGDF - OTC (Q) 17
Canadian | TSX: DNG

        American | OTC (Q): DNGDF

dynacor.com | investors@dynacor.com

          Director, Investor Relations
    Dale Nejmeldeen (604) 492 0099
You can also read