Interim Results Presentation - 17 August
←
→
Page content transcription
If your browser does not render page correctly, please read the page content below

Interim Results Presentation
17 August
BUSINESS REVIEW
   AND OUTLOOK

BRAND + PRODUCT
Cherry Chen(陳晨), Executive Director and Brand VP
FULL ENHANCEMENT OF BRAND
VALUE

    Reinforcement and emphasis of brand DNA

    Development and sales of products compatible with
    market demands through analysis and application
    of end retail sales data to seize more business
    opportunities

    Immersion and upgrade of star products

4

TRACKING MARKET DEMAND TO ENHANCE
PRODUCT COMPETITIVENESS

                                               Product positioning
    Stabilising product prices to maintain
    gross profit margin
                                                Mid-High
    Tracking market demand, adjusting
    product structure, and speeding up
    the precipitation of star products by       Low-Mid

    analyzing the big data of our brand.
    Notable increase in overall order volume                                         Order
                                                                     15FW   16FW     volume
    Rescheduling product launch based on
    the changes of consumers' matching, in
    order to seize market windows

Adding value through emphasis on quality and appearance
    Presentation of products by brand ambassador increases new and old consumers'
    recognition
    Enhancement in quality and appearance further increases the added value of products

6
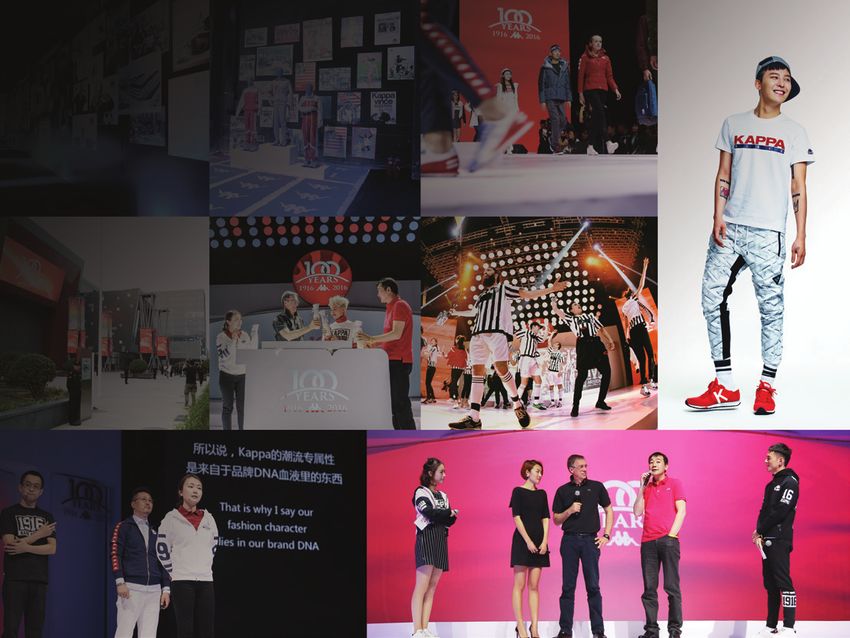
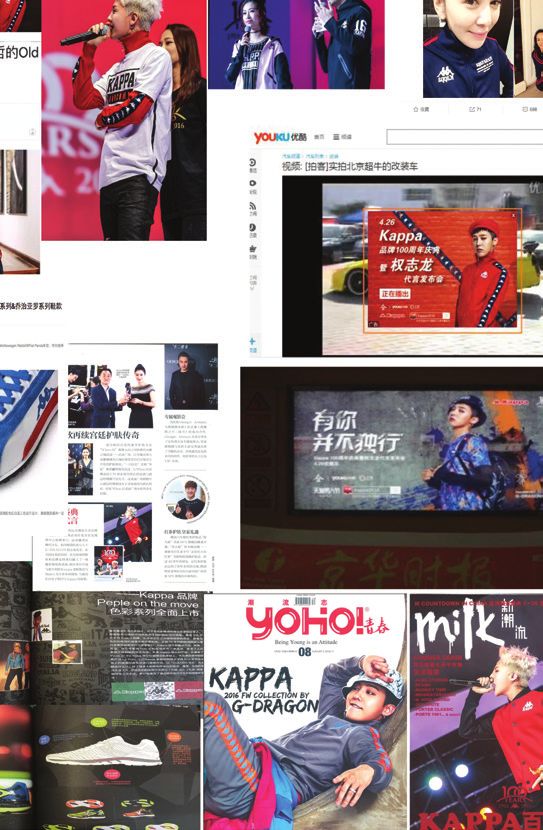
KAPPA CHINA — MARKETING REVIEW

    Asian pop and fashion superstar G-Dragon appointed brand
    ambassador to mark Kappa 100th anniversary in 2016

    Reinforcing brand style and enhancing brand value and
    added value of products

    Enhancing interaction with consumers to
    facilitate full marketing coverage

7
360 INTEGRATED
MARKETING

                        Brand

                     Marketing

                                Marketing
                 Product         channel

    Enhancing interaction with consumers
    by deepen the brand culture to facilitate
    full marketing coverage to increase brand
    addiction

    Focused on ‘Internet+’ to embark on new
    marketing approach

    Increase product sales on all platforms
    through expanding brand promotion
    coverage and connecting both online and
    offline channel

8
MARKETING IN 2H2016

    Ongoing enhancement and reinforcement of star products

    Offline marketing activities for 2H2016

9
BACK TO SPORTS

                                                   Trend + Light “Auxiliary” Functions
     Real-time adjustments to product mix
     according to market requirements

     Increasing supply of functional products to
     enrich and diversify product lines

     Smart combination of product portfolio to
     enhance product competitiveness

10
INTEGRATION OF SINO-JAPAN
OPERATIONS TO
CENTRALIZE MANAGEMENT
Centralized management allowing comprehensive resource
sharing, amalgamation of strengths and complementary
effects
Leveraging premium resources of Japan and sharing R&D
results on TC new technologies of Japan for reasonable
application in brands under the Group
Increasing technical input and intrinsic value of products to
assure market leadership and competitiveness
Continue to implement fast reaction method in supply chain
11BRAND + RETAIL Daniel Yang(楊洋), Assistant to CEO and Finance Director
OVERVIEW OF CHANNEL PERFORMANCE 1H16

     Enhancement of channel quality is crucial for future channel expansion

         Gross Sales                    Same-store Sales               Self-owned Store Sales

                 +5%                                                                 +7%

                                                    -2%

       15SS       16SS                    15SS       16SS                     15SS   16SS

13
OVERVIEW OF OFFLINE CHANNELS 1H16
01
Net increase of 15 Kappa stores, up to a total of 1,282 stores
02
419 self-owned retail stores accounting for 32% of total number of
stores
03
2016
Expect mid-digit growth by the end of 2016 versus end of 2015
04
Stable pace of expansion with diverse
channel types to satisfy consumers’ new approach of shopping
• Shopping Mall, Integrated Stores (Adults + Kids wear), Outlet Stores
14E-COMMERCE
01
Sales of RMB107 million representing yoy growth 88.7%
02
Accounting for 21% of China sales, increasing by 9 percentage
points yoy
03
Gross profit margin stood at 60%
15KAPPA KIDS
01
RMB33 million, accounting for 6.5%
of China Sales
02
216 stores in total
16JAPAN BUSINESS
01
The integration of Sino-Japan business began last year by adjusting
the Japan business structure on all fronts. Currently, the first phase of
adjustment is completed
02
The national launch of Phenix coinciding with Winter Olympics in
2022, focusing on core ski grounds to embrace the fast growth cycle
of the ski market
17FINANCIAL REVIEW
Vincent Lui ( 呂光宏 ), Investment and Fund Management Director
All amounts in RMB million, unless otherwise stated.SUMMARY OF RESULTS
1H2016
RMB million YoY Change
Revenue 650 +8.9%
Gross Profit* 372 +8.1%
Operating Profit 552 +42.6
Operating Profit excluding investment income 79 +1.3
Profit Attributable to Equity Owners 479 +65.2
Gross Profit Margin* 57.2% -0.4 ppts
Operating Profit Margin 84.9% +20.1 ppts
Operating Profit Margin excluding investment income 12.2% -0.9 ppts
Net Profit Margin 73.7% +25.1 ppts
Basic Earnings Per Share (RMB cents) 8.68 +65
Interim Dividend and Interim Special Dividend
Per Share (RMB cents) 5.18 +41.1%
* Before provision of inventories
19SALES ANALYSIS 1H2016
By regional market
RMB million As % of total sales YoY Change
China 506 77.9% +6.8%
Japan 144 22.1% +17.1%
Total sales 650
China sales
RMB million As % of total sales YoY Change
Wholesale 245 48.4% -10.3%
Retail 219 43.3% 14.7%
Kids 33 6.5% N.A
International and
others 9 1.8% -10.0%
Total sales 650
20GROSS PROFIT MARGIN ANALYSIS 1H2016*
By regional market
YoY Change
China 63.8% -0.3 ppts
Japan 34.0% +2.3 ppts
Group overall 57.2% -0.4 ppts
China Kappa gross profit margin by product
YoY Change
Apparel 70.5% +1.4 ppts
Footwear 56.5% -2.7 ppts
Accessories 66.1% -1.0 ppts
Kappa brand overall 66.6% +0.3 ppts
Kappa Kids 55.6% N/A
* Before Provision of inventories
21EXPENSES ANALYSIS 1H2016
RMB million YoY Change
Advertising and selling expenses 127 +25.7%
As % of total sales +19.6% +2.6 ppts
Employees’ salaries and benefits 64 -9.9%
As % of total sales 9.8% -2.1 ppts
Design and product development expenses 19 +5.6%
As % of total sales 2.9% -0.1 ppts
22CHINA INVENTORY, TRADE RECEIVABLES
AND TRADE PAYABLES 1H2016
RMB million YoY Change
Net inventory* 146 +10.6%
Balance of trade receivables 175 +6.7%
Balance of trade payables 75 0.0%
* Inventory structure optimized with higher percentage of new products
YoY Change
Inventory turnover days 137 +6 days
Turnover of trade receivables days 59 -11 days
Turnover of trade payables days 80 -4 days
23INVESTMENT AND FUND
HK$Bn
12 2016E average return on investment 8%–10%
10.2
RMB million
10
Cash and bank balances* 1,686 8 7.6
Fixed income 41
High liquidity treasury products 2,469 6
Alibaba 29%
Bank loans (903) 4
*Equity investment 21%
Total 3,252 2
Net Cash 9%
0
Market value Cash and investment
*including restricted cash
Partners: Yunfeng, Fosun, Citic, and etc
Investment in advanced technologies, financial services, new energy,
medicine and manufacturing
Note: * excluding Alibaba
The figures set out above are based on the exchange rate of HKD1: RMB0.85467
as at 30 June 2016.
242016 INTERIM DIVIDEND
The Group has maintained a relatively high dividend payout ratio
to provide maximum assurance for shareholders’ earnings
Six months ended 30 June
RMB cents
2016 2015
Basic Earnings Per Share 8.68 5.26
Interim Dividend Per Share 2.59 1.57
Interim Special Dividend Per Share 2.59 2.10
Interim Dividend Payout Ratio 60% 70%
25Q&A
INVESTOR RELATIONS – CONTACT INFORMATION

Website:                                     http://www.dxsport.com

Email:                                       ir@dxsport.com.cn

Tel:                                         +86 (10) 6783 6585

Fax                                          +86 (10) 6785 6606

Address:                                     Building 21, No. 2 Jingyuanbei Street,
                                             Beijing Economic-Technological Development Area Beijing, China

Disclaimer

Warning about Forward-looking Statements

This presentation contains certain forward-looking statements in relation to the financial conditions, operating results and business of the Company. These statements
represent the expectations or beliefs of the Company regarding future events, and are subject to risks and uncertainties, whether known or unknown. Such risks
and factors might result in significant difference between actual results, performances or events and the results, performances or events stated or implied in such
statements. Certain statements, such as those including words and expressions such as “potential”, “estimate”, “expect”, “anticipate”, “target”, “intend”, “plan”,
“believe”, “project” and similar phrases expressed in different forms, are regarded as “forward-looking statements”. Forward-looking statements are subject to inherent
risks and uncertainties. It should be noted that a number of factors might result in the actual outcome deviating from conditions expected or implied in the forward-
looking statements, and in some cases such deviation might be significant. The contents of the forward-looking statements are updated as at the date on which such
forward-looking statements are made, and should not be assumed to have been revised or updated to reflect latest information or subsequent events. Market trends
and factors that are expected to affect the operating results of the Company are set out in the sections headed “Business Review and Outlook” and “Financial Review.”
You can also read