Ares
  Stock
  Pitch


Annie
  Wang,
  David
  Chui,
  Derek
  Wei,
  Mitesh
  Amarthaluru,
  Albert
  Li
←
→
Page content transcription
If your browser does not render page correctly, please read the page content below
Ares Stock Pitch Annie Wang, David Chui, Derek Wei, Mitesh Amarthaluru, Albert Li
Table
  of
  Contents


  I. Investment
  Thesis

  II. Industry
  Overview

  III.Company
  Overview

  IV.Financials

  V. ValuaFon

  VI.Appendix


                                 2
I.
  Investment
  Thesis
Ares
Management,
L.P.
(NYSE:
ARES)
Ares
Management
is
under-‐recognized,
which
has
resulted
in
a
significant
undervalua7on
of
the
firm’s
LP
units,
despite
consistently
strong
earnings
within
the
highly
aHrac7ve
alterna7ve
asset
management
sector
Recommenda7on:
Buy
Current
Price:
$17.68
Price
Target:
$25.45
(44%
upside)
Catalysts
n Robust
growth
in
global
alternaFve
AUM
as
investors
seek
higher
returns
from
non-‐tradiFonal
sources
n ShiX
in
investor
preferences
to
relaFonships
with
fewer
firms
benefits
large
mulF-‐product
managers
with
consistently
strong
track
records
n High
proporFon
of
management
fees
should
drive
a
higher
valuaFon
relaFve
to
other
alternaFve
asset
managers
n Increased
a[enFon
as
the
firm
completes
larger
deals
and
the
industry
in
general
gains
addiFonal
a[enFon
Risks
n Poor
future
investment
results
could
result
in
the
loss
of
both
performance
fees
and
AUM
n Loss
of
senior
investment
professionals
n Downward
pressure
on
fees
by
investors
could
result
in
a
reducFon
in
both
quanFty
and
quality
of
revenues
n ConFnued
lack
of
a[enFon
and
recogniFon
from
investors
could
impede
stock
performance
4
II.
  Industry
  Overview
Industry
Overview
Tradi7onal
vs.
Alterna7ve
Investments
Alternative Traditional
Higher
performance
objective Relative
performance
objective
May
use
leverage Limited
or
no
leverage
Performance
dependent
primarily
on
manager
s kill Performance
primarily
dependent
on
market
returns
Lower
correlation
with
market
indices Higher
correlation
with
market
indices
Less
liquid More
liquid
Higher
fees,
which
generally
include
performance
incentive
fees Typically
management
fees
only
Ability
to
s hort Shorting
restricted
Economics
of
an
Alterna7ve
Asset
Manager
n Revenues:
Management
fees,
performance
fees,
investments
in
firm’s
investment
funds
n Costs:
Base
compensaFon,
performance
compensaFon,
SG&A
n Drivers:
AUM,
fees
as
a
percentage
of
AUM,
investment
performance
n A[racFve
features
of
the
business
model
n Increasing
returns
to
scale
(declining
costs
as
a
percentage
of
revenue)
n SFcky
capital
combined
with
fixed
management
fees
as
a
%
of
AUM
results
in
very
predictable,
stable,
recurring
revenues
6
Industry
  Overview


80 16
Tradi7onal
vs.
Alterna7ve
Investment
Growth
Alloca7on
to
Alterna7ves
($
trillions)
25%
60 57 12
50
46 46 46
43 43
12%
40 37 38 8
7.2
6.8
6.3
5.9
5.3
5.0 5.0
4.1
20 3.2
4 2009 2013
n InsFtuFonal
allocaFon
to
alternaFve
investments
have
grown
significantly
over
the
past
few
years
0 0 n AlternaFves
needed
to
achieve
8%
return
target
for
insFtuFonal
2005 2006 2007 2008 2009 2010 2011 2012 2013 investors
Traditional
CAGR:
5% Alternative
CAGR:
11% n Also
seen
as
a
way
for
investors
to
diversify
investments
S&P
Historical
Returns
Representa7ve
Alterna7ves
Targeted
Returns
n Tradable
Credit
n Performing
Credit:
5-‐12%
n Special
SituaFons:
15-‐18%
n Direct
Lending
n US:
8-‐12%
n Europe:
8-‐15%
n Real
Estate
n Real
Estate
Debt:
4-‐10%
n Real
Estate
Equity:
12-‐18%
n Private
Equity
n US/Europe:
18-‐22%
n CAGR
over
the
period
was
3.9%
(assuming
dividend
reinvestment)
n China:
22-‐25%
7
Industry
Overview
8
III.
  Company
  Overview
Company
Overview
Core
Businesses
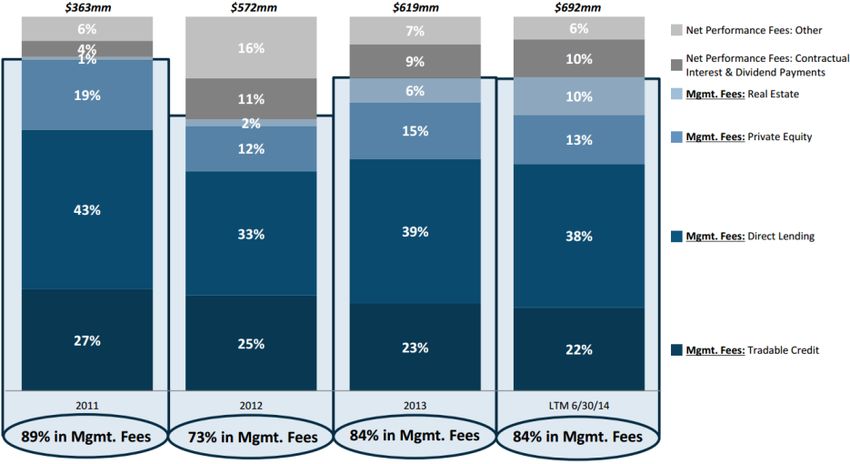
Strong
AUM
Growth
n Leading
global
alternaFve
asset
manager
headquartered
in
Los
Angeles
with
$79b
AUM
across
four
investment
groups
n Tradable
credit,
private
debt,
private
equity
&
real
estate
n Groups
are
highly
complimentary
and
allows
Ares
to
invest
across
the
capital
structure
n Founded
in
1990
as
the
capital
markets
group
of
Apollo
and
spun
out
in
1997
n IPO
in
April
2014
at
$19
per
share,
below
the
iniFal
expected
range
of
$21
to
$23
per
share
n Strong
focus
on
credit
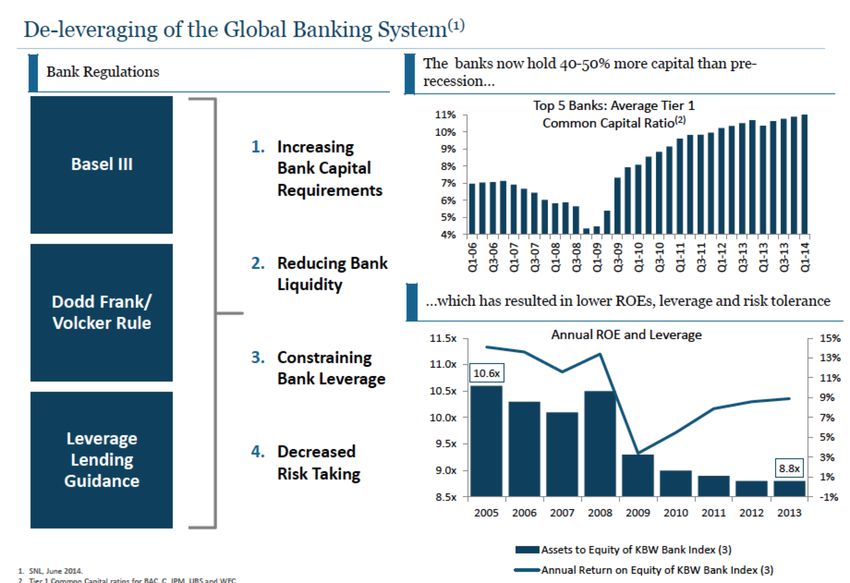
Fee
Revenue
Composi7on
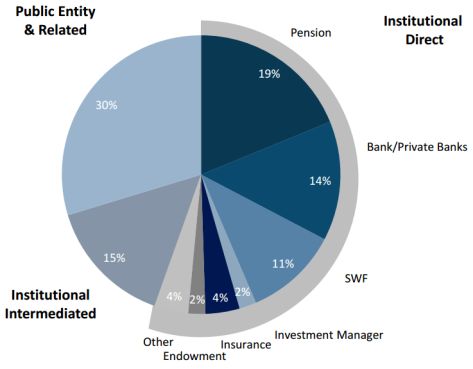
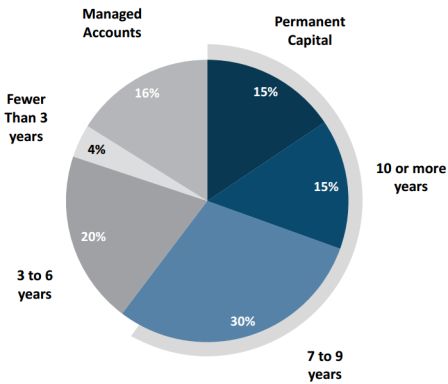
Stable
Capital
Base
from
a
Diverse
Investor
Group
10
Tradable
Credit
Segment
Overview
Assets
Under
Management
n Since
Ares’
incepFon
in
1997,
the
firm
has
been
managing
porfolios
of
non-‐investment
grade
credit
n One
of
the
largest
parFcipants
in
non-‐investment
grade
corporate
credit
markets,
with
$32b
AUM
in
two
disFnct
strategies,
long-‐only
and
alternaFve
credit
n Long-‐only:
invests
in
leveraged
loans
and
high-‐yield
bonds
seeking
to
outperform
the
corresponding
performing
bank
loan
or
high
yield
market
indices
n AlternaFve
credit:
invests
in
a
variety
of
performing
non-‐
investment
grade
credit
and
distressed
situaFons
seeking
to
deliver
compelling
absolute
risk-‐adjusted
returns
n Flagship
total
return
fund
ranked
#1
of
888
US
fixed
income
funds
for
5-‐year
performance
(Lipper)
AUM
Division
By
Investment
Type
n Management
fee
revenue
increased
14.9%
Y-‐o-‐Y
n Raised
$12.2b
of
new
commitments
in
the
past
year
Gross
Annualized
Return/Outperformance
vs
Indices
11
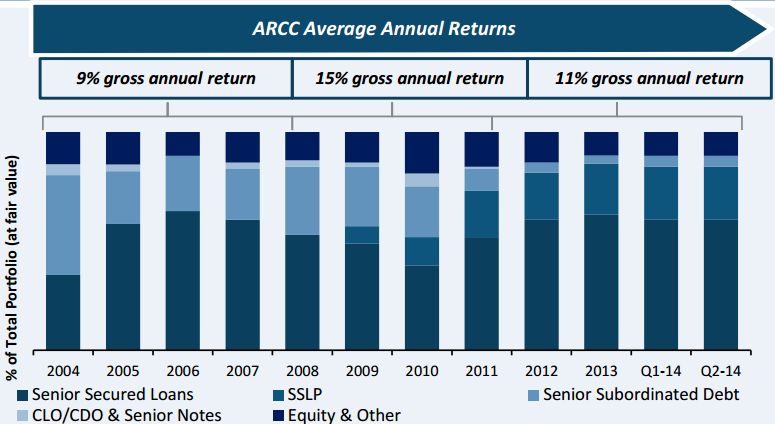
Private
Debt
Segment
Overview
Assets
Under
Management
n Launched
in
2004,
one
of
the
largest
self-‐originaFng
direct
lenders
in
the
US
and
Europe
with
$28b
AUM
and
ability
to
invest
across
the
capital
structure
n US:
Includes
Ares
Capital
CorporaFon,
the
largest
business
development
company
(non-‐bank
bank)
and
a
market
leader
in
the
non-‐bank
lending
sector
n Europe:
Quickly
established
presence
in
2007
and
has
completed
73
transacFons
totaling
€2.3b
of
commi[ed
capital
n Very
a[racFve
expansion
opportuniFes
in
the
direct
lending
segment
as
increased
bank
regulaFon
force
banks
to
cut
back
on
leverage
and
reduce
lending,
parFcularly
in
Europe
n Management
fee
revenue
increased
15%
Y-‐o-‐Y
Investment
History
n Raised
$5b
of
new
commitments
in
the
past
year
Gross
IRR
Since
Incep7on
12
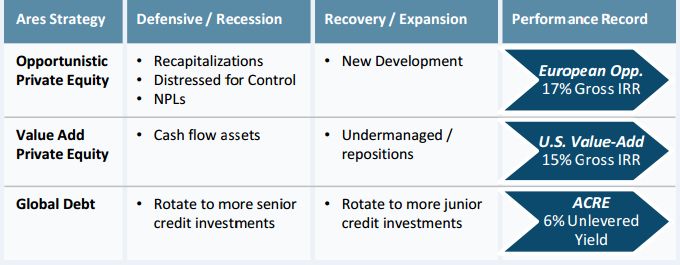
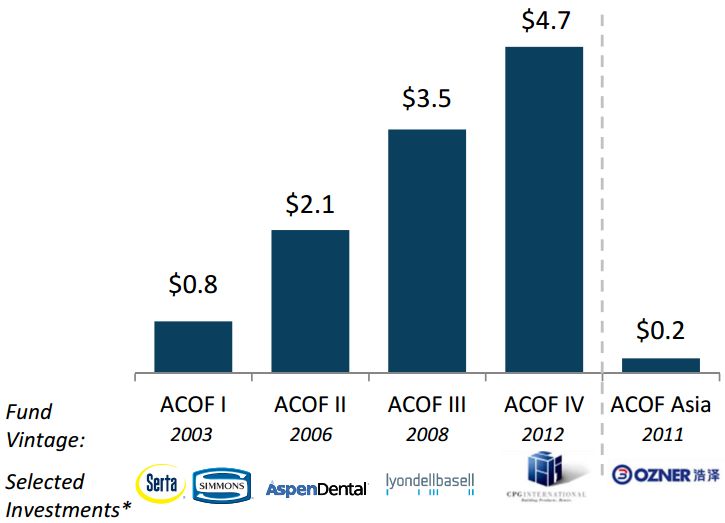
Private
Equity
Segment
Overview
Fundraising
n Launched
in
2003
with
$10b
AUM
across
5
funds
n Four
private
equity
funds
focused
on
buyouts,
growth
equity,
rescue
capital,
and
distressed-‐for-‐control
buyouts
in
the
US
and
Europe
n One
private
equity
fund
focused
on
minority-‐stake
growth
equity
investments
in
China
n Aggregate
gross/net
IRR
of
24%/18%
on
nearly
$8b
of
invested
capital
since
2003
n Top-‐quarFle
rankings
for
2006
and
2008
funds
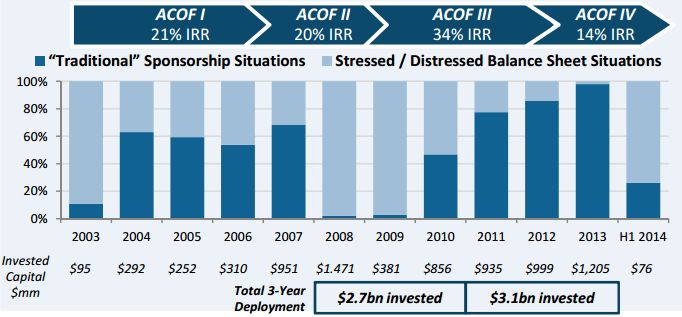
n Consistent,
strong
performance
across
economic
cycles
allowed
Ares
to
quickly
raise
a
larger
fund
in
2012,
in
contrast
to
nearly
all
other
private
equity
firms
Investment
History
Gross
IRR
Since
Incep7on
13
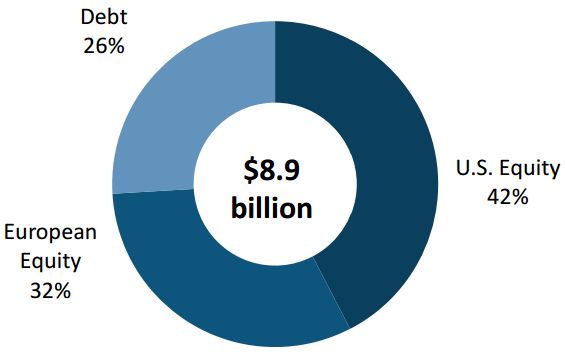
Real
Estate
Segment
Overview
Assets
Under
Management
n Launched
in
2011
and
currently
has
$9b
AUM
n Acquired
AREA
Property
Partners
in
2013
n Real
Estate
is
a
new
and
growing
area
for
Ares,
but
the
senior
team
has
been
together
for
over
20
years
and
previously
worked
with
the
Ares’
founders
at
Apollo
n Invests
in
the
debt
and
equity
of
US
and
European
real
estate
n Real
Estate
Equity:
Value-‐add
and
opportunisFc
investments
in
the
US
and
Europe
n Real
Estate
Debt:
Senior
debt,
mezzanine
debt,
and
loan
servicing
in
the
US
n Management
fee
increased
800%,
primarily
from
the
increased
AUM
as
a
result
of
the
AREA
acquisiFon
n Raised
$2.2b
of
new
commitments
in
the
past
year
AUM
Division
By
Investment
Type
Investment
Performance
Gross
IRR
Unlevered
EffecFve
Yield
Equity
Debt
14
How
Ares
Differs
Overview
Illustra7ve
Fee
Split
for
Compe7tor
n Focus
on
credit,
parFcularly
performing
loans,
results
in
Corporate
Private
Equity Real
E state Tradable
Credit Private
D ebt
more
stable
earnings
vs
other
alternaFves
managers
Management
n ~80%
of
fee
revenue
comes
from
stable,
recurring
Fees
management
fees
n ~10%
of
fee
revenue
comes
from
contractual
interest
and
dividend
payments
n CompeFtors
management
fees
make
up
20%-‐40%
Performance
of
fee
revenues
Fees
n Consistent
revenue
stream
merits
a
higher
mulFple
n Among
large,
mulF-‐offering
alternaFve
managers,
Ares
is
one
of
just
a
few
that
have
had
strong
performance
in
AUM
Breakdown
all
segments
through
the
downturn
AUM
CAGR
(2011-‐2013)
23%
17%
Publicly
Traded
Competitors Ares BX Carlyle Apollo KKR Oaktree Ares
Credit Private
E quity Real
E state Hedge
Funds
15
IV.
  Financials
Historical
  Performance

                                                                   Year
  Ended
  December
  31,

                                                             2011A             2012A                    2013A
      Direct
  Lending                                      $155              $190                     $238
      Tradable
  Credit                                       99                145                     145
      Private
  Equity                                        68                    69                   93
      Real
  Estate                                            3                    10                   40
      Management
  Fees                                     $324              $415                     $517
         Growth
  in

  Management
  Fees                                 28%                      25%

      Other
  Fees
  (Admin.
  &
  Deal
  Income)        $20                 $19                  $24
      Comp.
  &
  Benefits                                 (179)               (237)                (305)
      SG&A                                                    (44)                (58)                 (83)
      Fee
  Related
  Earnings                             $120                $138                 $153
        Growth
  in
  Fee
  Related
  Earnings                                15%                  11%

      Net
  Performance
  Fees                              $39                $157                 $102
      Net
  Investment
  Income                              34                 107                   74
      Performance
  Related
  Earnings                      $73                $265                 $176
        Growth
  in
  Performance
  Related
  Earnings                       263%                (34%)

      Economic
  Net
  Income                              $194                $402                 $329
         Growth
  in
  Economic
  Net
  Income                               107%                (18%)

      Memo:
      Fee
  Revenue
  (Mgmt
  &
  Net
  Performance)    $363                $572                 $619
      Distributable
  Earnings                               203                 302                  306

                                                                                                                17
Projected
  Financials

                                                                 Year
  Ended
  December
  31,

                                                           2013A             2014E                    2015E
     Management
  Fees                                    $517              $620                     $744

     Other
  Fees
  (Admin.
  &
  Deal
  Income)       $24                 $32                  $38
     Comp.
  &
  Benefits                                (305)               (354)                (425)
     SG&A                                                   (83)                (90)                (108)
     Fee
  Related
  Earnings                            $153                $208                 $249

     Net
  Performance
  Fees                            $102                 $80                  $99
     Net
  Investment
  Income                             74                  89                  114
     Performance
  Related
  Earnings                    $176                $169                 $213

     Economic
  Net
  Income                             $329                $377                 $462
        Growth
  in
  Economic
  Net
  Income                              14%                  23%

     Memo:
     Fee
  Revenue
  (Mgmt
  &
  Net
  Performance)   $619                $700                 $843

                                                                                                              18
V.
  Valua7on
Sum
of
the
Parts
Approach
n RaFonale:
Earnings
from
management
fees
should
be
valued
similarly,
if
not
higher,
to
that
of
tradiFonal
asset
managers.
Performance
fee
earnings
should
be
valued
at
a
discounted
mulFple.
Balance
sheet
investments
should
also
be
included.
n TradiFonal
asset
manager
P/E
mulFple
applied
to
2015E
management
fee
earnings
n 17.5x
for
base
case
n 20.0x
for
upside
case
n 15.0x
for
downside
case
n Reduced
mulFple
applied
to
2015E
performance
fee
earnings
n 7.5x
for
base
case
n 8.0x
for
upside
case
n 7.0x
for
downside
case
n 95%
of
value
of
2014E
balance
sheet
investments
n Price
Range:
$22.46
-‐
$28.43
n Implied
Premium:
27%
-‐
61%
20
Share
  Price
  CalculaFon

                                              Multiple   Metric   Value

   2015E
  Mgmt
  Fee
  Earnings             17.5x     $233    $4,077
                                                                           Base
  Case

   2015E
  Performance
  Fee
  Earnings        7.5x      93      743
                                                                           Price
  Target:
  $25.45

   2014E
  Balance
  Sheet
  Investments       .95x     605      575

   Market
  Cap                                                  $5,394
                                                                           Implied
  Premium:
  44%

   Price                                                          $25.45

                                              Multiple   Metric   Value

   2015E
  Mgmt
  Fee
  Earnings             20.0x     $233    $4,660
                                                                           Upside
  Case

   2015E
  Performance
  Fee
  Earnings        8.0x      93      792

   2014E
  Balance
  Sheet
  Investments       .95x     605      575
                                                                           Price
  Target:
  $28.43

   Market
  Cap                                                  $6,026
                                                                           Implied
  Premium:
  61%

   Price                                                          $28.43

                                              Multiple   Metric   Value

   2015E
  Mgmt
  Fee
  Earnings             15.0x     $233    $3,495   Downside
  Case

   2015E
  Performance
  Fee
  Earnings        7.0x      93      693    Price
  Target:
  $22.46

   2014E
  Balance
  Sheet
  Investments       .95x     605      575    Implied
  Premium:
  27%

   Market
  Cap                                                  $4,762

   Price                                                          $22.46

                                                                                                            21
VI.
  Appendix
TradiFonal
Asset
Manager
Comps
Share %
of
52
week Enterprise
Value
Market
Cap P/E P/E
Company Ticker Price High (US
BB) (US
BB) TTM FY1
Blackrock BLK $331.75 98% $58.4 $55.1 18.3x 17.3x
T.
Rowe
Price TROW 80.07 93% 19.4 21.1 18.6 17.4
Charles
Schwab
SCHW 30.37 98% 16.4 39.6 32.9 31.5
Fidelity FNF 27.78 80% 12.4 9.0 -‐-‐ 30.4
Legg
Mason LM 50.78 98% 5.8 5.9 19.8 24.6
Alliancebernstein AB 27.47 97% 2.7 2.7 15.7 15.0
State
Street STT 74.84 97% (49.2) 31.7 16.3 15.6
Mean
20.3x 21.7x
Median
18.4 17.4
23
AlternaFve
  Asset
  Manager
  Comps

                                     AUM         %
  of
  52
  week   Market
  Cap   P/E     P/E     P/ENI
     P/DE

          Company          Ticker   (US
  BB)         High                (US
  BB)    TTM     FY1     TTM         TTM

 Blackstone         BX               $279                 92%                 $38.3      12.7x    8.6x       8.9x     16.0x

 Carlyle            CG                203                 79%                     9.9     14.7    10.6       7.0       9.9

 Apollo             APO               168                 62%                     9.1      8.4     9.6       6.6       5.4

 KKR                KKR                 98                85%                   18.8       8.5     8.6       7.4       9.9

 Oaktree            OAK                 91                83%                     9.4     10.9    13.4      10.4      12.9

 Mean
                                                                   11.0x   10.2x       8.1x     10.8x

 Median
                                                                    10.9     9.6       7.4       9.9

 Ares               ARES              $79                 88%                  $3.8       7.5x    9.6x     10.2x      13.5x

                                                                                                                              24
Term
Sheet
n AUM:
(Asset
Under
Management)
The
market
value
of
assets
that
an
investment
company
manages
on
behalf
of
investors.
AUM
is
looked
at
as
a
measure
of
success
against
the
compeFFon
and
consists
of
growth/(decline)
due
to
both
capital
appreciaFon/(losses)
and
new
money
inflow/
(ouflow).
n ENI:
(Economics
Net
Income)
Economic
Net
Income
(“ENI”)
represents
segment
net
income
excluding
the
impact
of
income
taxes
and
transacFon-‐related
items,
including
charges
associated
with
equity-‐based
compensaFon,
the
amorFzaFon
of
intangibles
and
corporate
acFons
including
acquisiFons.
ENI=
Total
Fund-‐level
Fee
Revenue
+
Realized
Performance
Fees
+
Realized
Investment
Income
+
Interest
&
Other
Income
–
Direct
Base
CompensaFon
–
Performance
Fee
Related
CompensaFon
–
G&A
and
Other
Indirect
Expenses
-‐
Interest
Expense
n Distributable
Earning
Distributable
Earnings
differs
from
Economic
Net
Income
in
that
it
only
includes
the
cash-‐generaFng
porFon
of
the
performance
and
investment
related
revenues
and
compensaFon
expenses.
Distributable
net
income
is
the
maximum
amount
received
by
a
unit-‐holder
or
a
beneficiary
that
is
taxable;
any
amount
above
this
figure
will
be
tax
free.
DE
=
Total
Fund-‐level
Fee
Revenue
+
Realized
Performance
Fees
+
Realized
Investment
Income
+
Interest
&
Other
Income
–
Direct
Base
CompensaFon
–
Realized
Performance
Fee
Related
compensaFon
–
G&A
and
Other
Indirect
Expenses
–
Interest
Expense
25
You can also read