Investor Presentation August 2021 - AFR
←
→
Page content transcription
If your browser does not render page correctly, please read the page content below
Investor Presentation August 2021
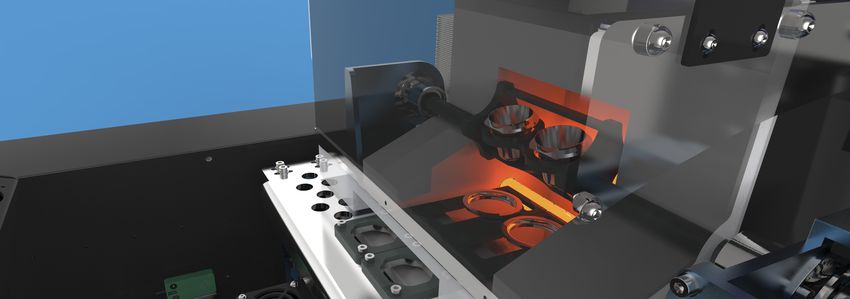
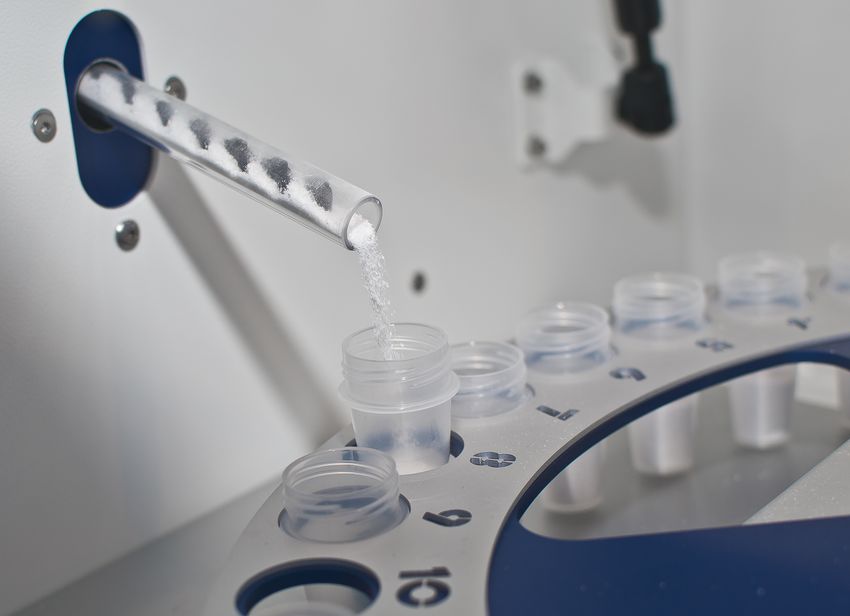
Our Technology
                                          Sample Preparation
                                             Technology

        Mining and
       Manufacturing                                                      Chemical Analysis

                                  Raw                          Prepared
                                Samples                        Samples

 Minerals:         Materials:
 Iron ore          Cement                                                  Analysis Techniques:
 Nickel            Steel                                                   XRF
 Copper            Glass                                                   ICP
 Aluminium         Ceramics
 Bauxite           Research
 Manganese         Education
 Uranium
 Lithium
 Mineral sands
 Commercial labs

                                                                                                  2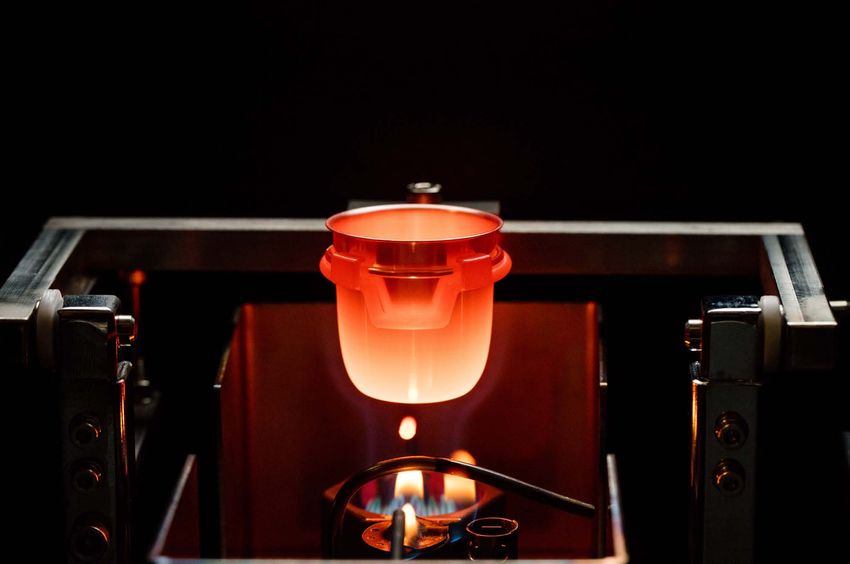
Lab Products
Sample Preparation Products
                              Platinum Labware

X-Ray Flux

                                                    Recycling service of
                                                    turning used platinum
                                                    products into new items

                                  Fusion Machines

                                                                          3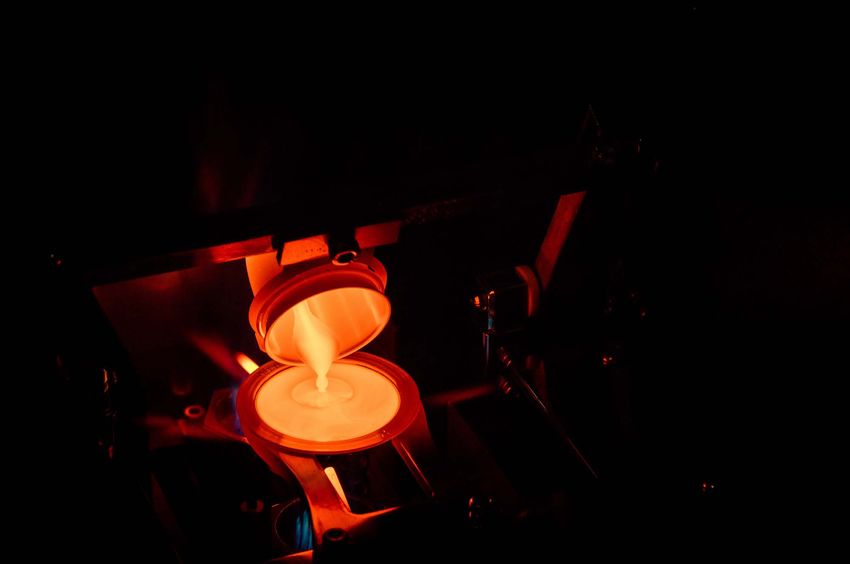
Lab Products
                                             Analytical Tools and Accessories
                      Weighing Instruments

Platinum Electrodes

                                             Drift Monitors

                                                                         4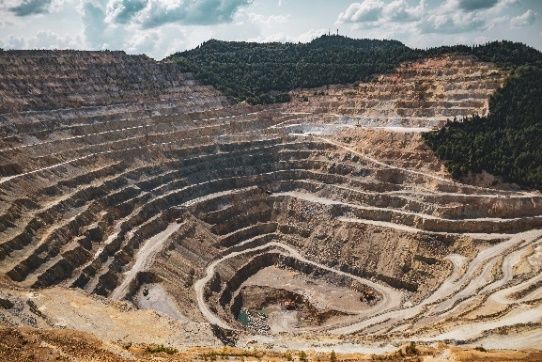
Platinum Products
                       Precision Products for Industry

        Aerospace   Glass Production   Crystal Growing     Measurement
       Components      Bushings            Vessels          Instrument
                                                           Components

       Chemical       Laboratory        Research and     Niche Applications /
       Production    Components         Development       Custom Designs
        Vessels

                                                                                5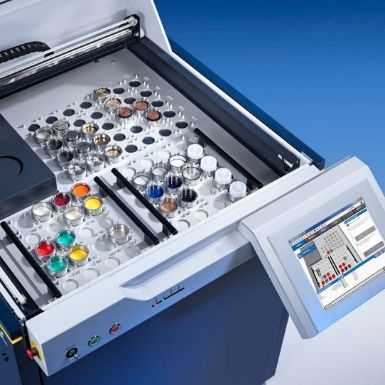
FY21 Highlights
Record revenue and profit
All divisions profitable and growing
Very strong demand from mining and industrial customers – driven by commodity prices,
construction activity and demand for manufactured goods
Strong demand for capital equipment products
Consistent profit from Germany office with a growing customer base in large industrial precious
metal product markets
Continued R&D investment in new capital equipment and precious metal products
6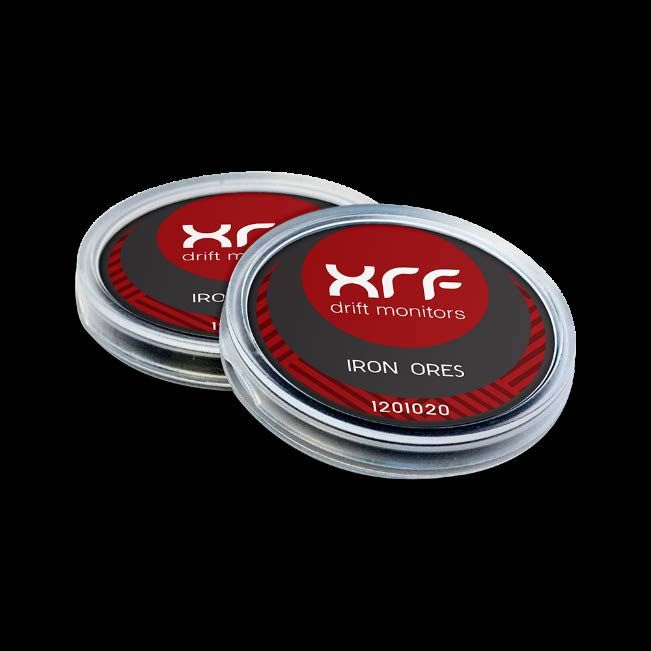
FY21 Financial Highlights
31,295
29,029 29,092
24,250
21,540
Revenue up 8% to $31.3m vs FY20
Statutory NPAT up 64% to $5.1m vs FY20
Adjusted PBT up 41% to $5.9m vs FY20
$4.5m positive operating cashflow FY17 FY18 FY19 FY20 FY21
Revenue ($'000)
Fully franked dividend of 2 cents per share
First full-year profit from Germany office of $0.2m 5,130
– driving forward our growth in the industrial
platinum sector
3,121
2,138
1,024
794
FY17 FY18 FY19 FY20 FY21
Net Profit After Tax ($'000)
7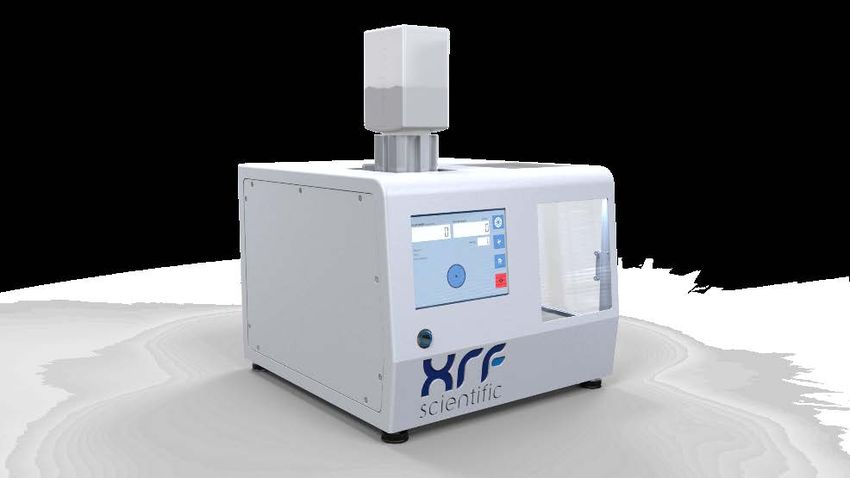
Full Year Results - Overview
  ($m)                                      2021             2020          Change      2019          2018
  Sales revenue                             31.3             29.1           8%         29.0          24.2
  Profit before tax                          6.8              4.5           52%         3.2           1.5
  Adjusted profit before tax*                5.9              4.2           41%         3.2           1.5
  Net profit after tax                       5.1              3.1           64%         2.1           1.0
  Earnings per share (cents)                 3.8              2.3           64%         1.6           0.8
  Weighted average no. of shares         134,345,542      133,825,803               133,825,803   133,825,803

  Dividends (cents per share)                2.0              1.4           43%         1.0          0.30
  Dividend payout ratio                     *60%             60%                       63%           39%
  *As a percentage of adjusted NPAT

  *Adjustments ($)
  COVID-19 wages subsidies                    (826,629)        (212,729)                      -             -
  COVID-19 other grants/subsidies              (29,522)         (74,776)                      -             -
  COVID-19 payroll tax refunds                        -         (82,837)                      -             -
  Interest on early loan repayment                    -          22,496                       -             -
  Redundancy / other employee payments                -          97,328                       -             -
  Total adjustments                           (856,151)        (250,518)                      -             -
                                                                                                                8
Balance Sheet
($m) 2021 2020 Change
Net cash position of $4.4m up from $2.7m
Cash and cash equivalents 5.3 3.6 45%
$0.8m debt for Melbourne platinum factory is
Trade and other receivables 4.5 3.8 19%
now in short-term due to initial three-year period
Inventories 12.5 11.2 11% expiring in November 2021. We expect this
Other assets 0.4 0.4 (2%) loan to be rolled over
Property, plant and equipment 8.1 8.3 (2%)
PPE lease asset 0.6 1.0 (39%)
Intangible assets 15.9 15.9 0%
Deferred tax asset 1.1 0.9 18%
Total assets 48.4 45.1 7%
Trade and payables
- platinum loan provisions 3.8 4.2 (11%)
- other items 3.0 2.6 13%
Debt (short-term) 0.8 0.1 642%
Debt (long-term) 0.0 0.8 (100%)
Current lease liabilities 0.4 0.4 (12%)
Non-current lease liabilities 0.2 0.6 (59%)
Income tax liability 0.6 0.5 23%
Deferred tax liability 0.5 0.3 80%
Total liabilities 9.3 9.5 (3%)
Total equity 39.1 35.6 10% 9
Cash Flow Statements
($m) 2021 2020
Net cash inflow from operating activities* 4.5 4.2
Net cash (outflow) from investing activities (0.6) (0.8)
Net cash inflow/(outflow) from financing activities (2.2) (3.0)
Cash at start of period 3.6 3.2
Net increase/(decrease) in cash 1.7 0.4
Cash at end of period 5.3 3.6
Highlights:
$1.65m cash paid out for FY20 dividend (2020: $1.34m). $221k dividends paid by new DRP
*Includes the $0.5m platinum purchase previously disclosed from July 2020
2020 includes $1.32m debt reduction
10Consumables
($m) FY21 FY20 FY19 Overview for FY21:
Sales revenue 9.3 8.9 8.0 Revenue up 5% on FY20
Change in % * 5% 11% 6% NPBT up 14% on FY20
Strong demand from the mining sector, both domestic and
NPBT 2.9 2.5 2.2 international
Change in % * 14% 18% 35% New customer acquisitions continue at a steady rate
Margin % 31% 29% 27%
* Compared to immediately prior period
2,896
2,546
2,358
2,158
1,930
1,830 1,739
1,594
FY14 FY15 FY16 FY17 FY18 FY19 FY20 FY21
Net Profit Before Tax ($'000)
11Precious Metals
($m) FY21 FY20 FY19 Overview for FY21:
Sales revenue 14.4 13.2 13.1 Revenue up 9% on FY20
Change in % * 9% 1% 19% NPBT up 81% on FY20
FY21 NPBT includes $363k of COVID-19 wages subsidies
NPBT 2.5 1.4 0.9 (FY20: $114k)
Change in % * 81% 50% 1564% Platinum labware products are regularly bundled with fusion
machines, driving new metal sales
Margin % 17% 10% 7%
High PGM precious metals prices growing profits
* Compared to immediately prior period
Result includes first profit from Germany office of $0.2m
2,507
1,492 1,387
1,341
925
551
56
-575
FY14 FY15 FY16 FY17 FY18 FY19 FY20 FY21
Net Profit Before Tax ($'000)
12Capital Equipment
($m) FY21 FY20 FY19 Overview for FY21:
Sales revenue 9.6 8.0 9.2 Revenue up 20% on FY20
Change in % * 20% (13%) 29% NPBT up 159% on FY20
FY21 NPBT includes $392k of COVID-19 wages subsidies
NPBT 1.5 0.6 0.6 (FY20: $93k)
Change in % * 159% (7%) 244% High level of machine sales from both mining and industrial
customers
Margin % 16% 7% 7%
Product development activities continue on two new
* Compared to immediately prior period
machines
1,511
633 625 583
354
170 181
70
FY14 FY15 FY16 FY17 FY18 FY19 FY20 FY21
Net Profit Before Tax ($'000)
13 Continuing our expansion in the Precious Metals
Division, with growth in profit expected to continue
Growth Strategy Continue with geographical expansion initiatives
for FY22 Release two new capital equipment products
Continue to pursue M&A opportunities. Our targets are
complementary manufacturing companies, in the
laboratory supply or precious metals sectors
Work to improve our scale/market cap and the share
priceCorporate Overview
Dividends
Shareholder Wealth EBIT
Earnings Per
Declared Per Share Price
Market
Share Capitalisation
Share
Financial Year $ Cents Cents Cents $
2015/16 2,318,737 1.2 0.5 18.0 24,088,645
2016/17 982,440 0.6 0.24 17.0 22,750,387
2017/18 1,598,268 0.8 0.3 16.0 22,081,257
2018/19 3,249,762 1.6 1.0 20.0 26,765,160
2019/20 4,602,319 2.3 1.4 24.0 32,118,193
2020/21 6,818,111 3.8 2.0 47.5 63,916,519
Directors Shareholders Capital Structure
Fred Grimwade – Chairman Board and Management – 14.6% Ordinary shares on issue: 134,561,093
Vance Stazzonelli – Managing Director Top 20 – 51.5% Options: Nil
David Brown – Non-Executive Director
David Kiggins – Non-Executive Director Substantial Shareholders
Private Portfolio Managers – 9.1%
Michael Karl Korber – 8.4%
D & GD Brown Nominees Pty Ltd – 7.1%
DRP Locations
Please visit www.xrfscientific.com for a Head Office – Perth
copy of the Dividend Reinvestment Plan Manufacturing – Perth and Melbourne
International Sales/Service – Brussels
(Belgium), Karstein (Germany) and Montreal
(Canada)
15Contact Information
Tel: (08) 9244 0600
86 Guthrie Street, Osborne Park WA
Vance Stazzonelli – CEO
vance@xrfscientific.com
16Disclaimer
No responsibility for contents of Investor Presentation
•To the maximum extent permitted by law, XRF Scientific Limited and representatives:
•make no representation, warranty or undertaking, express or implied, as to the adequacy, accuracy, completeness or reasonableness of
this Investor Presentation or any other written or verbal communication transmitted or made available to any recipient;
•accept no responsibility or liability as to the adequacy, accuracy, completeness or reasonableness of this Investor Presentation or any
other written or verbal communication transmitted or made available to any recipient; and
•accept no responsibility for any errors or omissions from this Investor Presentation whether arising out of negligence or otherwise.
Accuracy of projections and forecasts
•This Investor Presentation includes certain statements, opinions, estimates, projections and forward-looking statements with respect to
the expected future performance of XRF Scientific Limited. These statements are based on, and are made subject to, certain assumptions
which may not prove to be correct or appropriate. Actual results may be materially affected by changes in economic and other
circumstances which may be beyond the control of XRF Scientific Limited. Except to the extent implied by law, no representations or
warranties are made by XRF Scientific Limited, its advisers or representatives as to the validity, certainty or completeness of any of the
assumptions or the accuracy or completeness of the forward-looking statements or that any such statement should or will be achieved.
The forward-looking statements should not be relied on as an indication of future value or for any other purpose.
No offer to sell or invitation to buy
•This Investor Presentation does not, and should not be considered to, constitute or form part of any offer to sell, or solicitation of an offer
to buy, any shares in XRF Scientific Limited, and no part of this Investor Presentation forms the basis of any contract or commitment
whatsoever with any person.
This Investor Presentation does not constitute an offer or solicitation in any jurisdiction in which such offer or solicitation is not permitted
under applicable law. Distribution of this Investor Presentation in or from certain jurisdictions may be restricted or prohibited by law.
Recipients must inform themselves of and comply with all restrictions or prohibitions in such jurisdictions. Neither XRF Scientific Limited,
its advisers or representatives accept any liability to any person in relation to the distribution or possession of this Investor Presentation
from or in any jurisdiction.
17You can also read