ASX: WGX Corporate Update June 2021 - AFR
←
→
Page content transcription
If your browser does not render page correctly, please read the page content below
ASX: WGX Corporate Update June 2021
COMPLIANCE STATEMENTS

Competent Persons Statements

The information in this report that relates to Exploration Results and Mineral Resources and Ore Reserves is based on information
compiled Mr Jake Russell B.Sc. (Hons) MAIG and Anthony Buckingham B.Eng (Mining Engineering) MAusIMM. Both have sufficient
experience which is relevant to the styles of mineralisation and types of deposit under consideration and to the activities which they are
undertaking to qualify as a Competent Person as defined in the 2012 Editions of the “Australasian Code for Reporting of Exploration
Results, Mineral Resources and Ore Reserves (JORC 2012)”. Both consent to the inclusion in this report of the matters based on his
information in the form and context in which it appears. All are full time senior employees of the Company and are eligible to, and may
participate in short- term and long-term incentive plans of the Company as disclosed in its annual reports and disclosure documents.

Exploration and Production Target Statement
The information in this report that relates to exploration targets refers to targets that are conceptual in nature, where there has been
insufficient exploration to define a Mineral Resource and it is uncertain if further exploration will result in the determination of a Mineral
Resource. Production targets and mine designs are presented with the best of the knowledge and situation at this point in time and may
change in the future.

General Disclaimer
This presentation has been prepared by Westgold Resources Limited (“Westgold” or the “Company”). It should not be considered as an
offer or invitation or inducement to subscribe for or the purchase of any securities in the Company. This presentation contains forecasts
and forward looking statements. Such forecasts, projections and information are not a guarantee of future performance, involve
unknown risks and uncertainties. Actual results and developments may differ materially from those expressed or implied. Westgold has
not audited or investigated the accuracy or completeness of the information, statements and opinions contained in this presentation.
Accordingly, to the maximum extent permitted by applicable laws, Westgold makes no representation and can give no assurance,
guarantee or warranty, express or implied, as to, and take no responsibility and assume no liability for, the authenticity, validity,
accuracy, suitability or completeness of, or any errors in or omission, from any information, statement or opinion contained in this
presentation.

This overview of Westgold does not purport to be all inclusive or to contain all information which its recipients may require in order to
make an informed assessment of the Company’s prospects.

You should conduct your own investigation and perform your own analysis in order to satisfy yourself as to the accuracy and
completeness of the information, statements and opinions contained in this presentation before making any investment decision.
Investment Synopsis

                          Domestic Gold Producer, WA Murchison Focus

Focused                                   ASX 200, GDX, GDXJ

Increasing Output     Strong Balance Sheet – >A$178m in cash, no corporate debt

Self-sufficient
                    Self-sufficient, Owner Operator, Substantial Fixed Assets and Fleet
Fiscally Strong
                         Long Life Mines – Substantial Resource & Reserves
Long Life

High Margin             Increasing Output, Increasing Margins, Reducing Capex

                        Committed, Focused, Responsible Miner, Track Record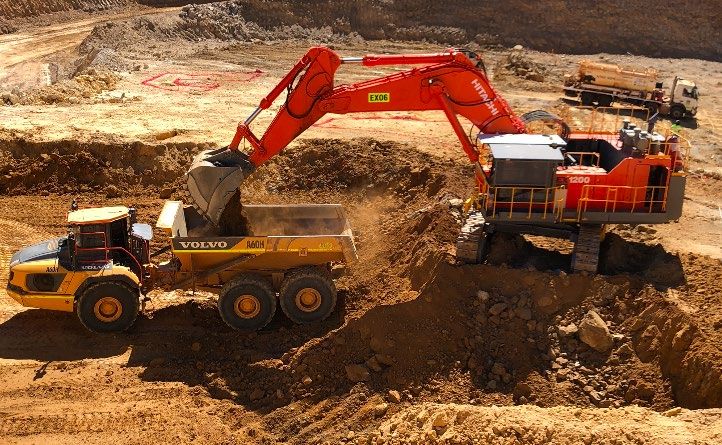
Corporate Snapshot
                        ASX: WGX           (ASX200, GDX, GDXJ)

                    FPO Shares on Issue: 423.86 million ($2.40/sh)
Focused
                     2.32 million ZEPO & Employee Perf. Rights
Increasing Output

Self-sufficient       Market Capitalization:          ~A$ 960 million
                      share price $2.27 (26/5/21)       (~US$775 million)
Fiscally Strong

Long Life             Cash & Bullion: $178 million (as at March 31, 2021)

High Margin
                    Corporate Debt: Nil ~ $30m equipment leasing

                       Cash & Bullion: $178 million (as at March 31, 2021)
Board & Executive Management

                    Board of Directors:

                    Executive Chair (Trans’n): Peter Cook
Focused
                    Independent NED:         Fiona Van Maanen
Increasing Output
                    Independent NED:         Peter Schwann
Self-sufficient
                    Independent NED:         Wayne Bramwell
Fiscally Strong
                    Co Sec:                  Lisa Smith
Long Life

High Margin         Executive Management:

                    CEO:                     Debbie Fullarton

                    COO:                  Anthony Buckingham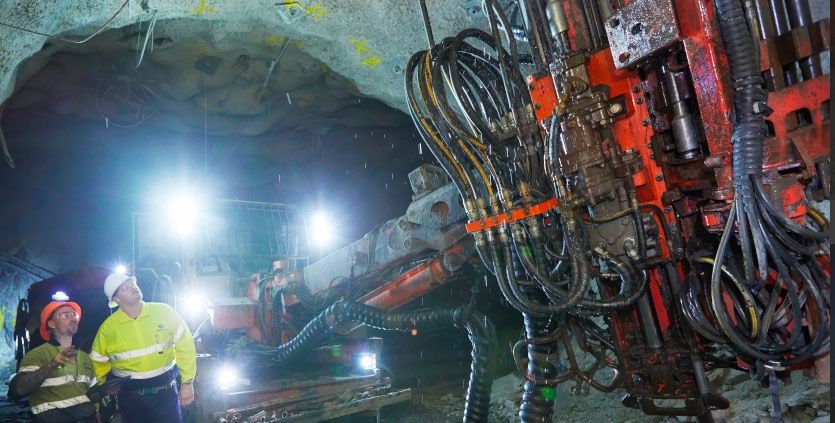
Murchison Gold Operations – Our Core Business

                    Aggregating a Gold Province – 22.9 million oz historic production and remaining resources.

                                                                               FGO

335 Mining Titles

>1,130 Sq Km
                                                                         MGO
                          FGO
                            MGO
                            CGO

                                                                                CGO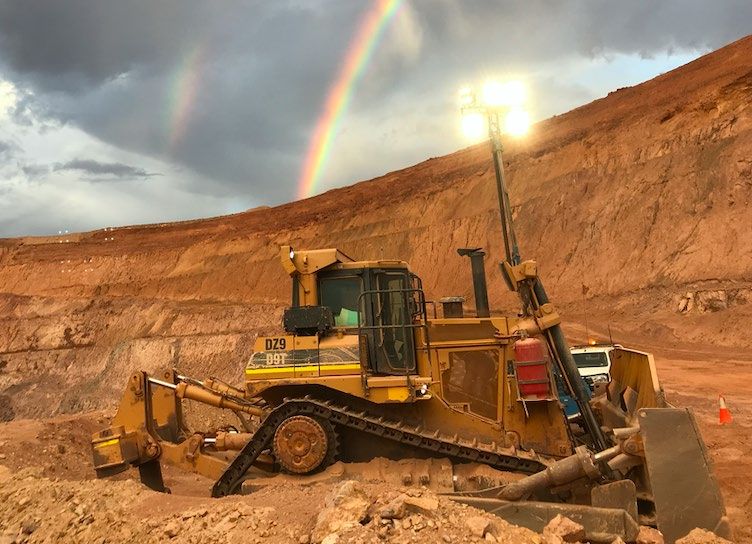
Murchison Gold Operations – Our Core Business

                      •   Regionally dominant land holdings
Focused
                      •   3 plants, 4Mtpa installed capacity
7 U/g Mines
                      •   Big Resource Base (8.8Moz @ June 30, 2020)
4 Open Pits
                      •   9yr + Reserves (2.5Moz @ June 30, 2020)
3 Process plants
                      •   270 – 300,000 ozpa baseline output
4 Villages
                      •   C1 Cash Costs: approx. A$1,100/oz (long term average)
Surface & U/g Fleet
                      •   AISC: A$1,400/oz (long term average)

                      •   Owner operator mining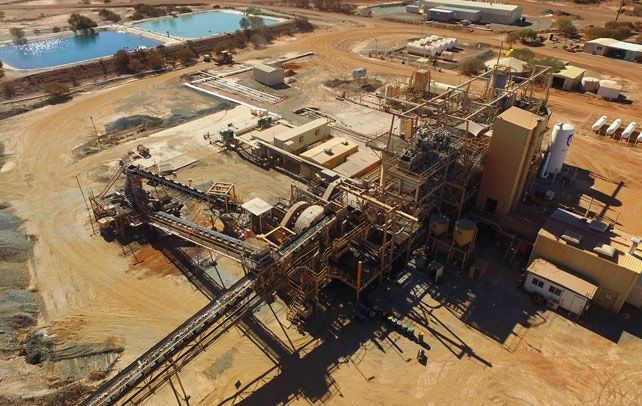
Fortnum Gold Operations – A snapshot!
       •   3 Major Gold Production Fields:

            •    Labouchere
            •    Fortnum
            •    Peak Hill

       •   Simple Metallurgy

       •   CIP Plant capacity of 0.9Mtpa

       •   Current Ore Feed :

            Starlight U/g Mine ~ 700 kt @ 3.0+ g/t

            Open Pit/Stocks     ~ 200kt @ 1.2 g/t

       •   Gold Output:     65 - 70,000 oz @ AISC
           A$1,300/oz

       •   Total IMR (June 2020):    1.32 million oz

       •   Total MR (June 2020):     398,000oz
Central Murchison Area – MGO & CGO

CMGP - Focus

5 U/g Mines (Operating)

4 U/g mines (planned)

Several Open Pits

2 Process plants          Steady Profile:                     Steady Profile:
                          110,000 – 120,000 oz p.a.           95,000 – 105,000 oz p.a.
3 Villages                C1 Cash Costs: $1,250 - $1,350/oz   C1 Cash Costs: $1,100 - $1,200/oz

Surface & U/g Fleet       AISC: $1,500 -1,600/oz              AISC: $1,250 - $1350/oz

                                    Total Resource (MGO & CGO): 7.48 million oz
                                     Total Reserve (MGO & CGO): 2.16 million oz
                                            Operating Life : 9 years +
Output Growth In The Murchison

                    250000

Focused
                    200000

Increasing Output                                                 104088
                                                        94280
                                                                                       270,000
Self-sufficient     150000                                                 250,000+       to
                                                                                       300,000

Fiscally Strong     100000
                                         112430
                                                                  70223
                                                        68255

Long Life
                     50000    101261
                                          8917
                                                                  60839
High Margin                              41820
                                                        58308

                        0       0
                               2061

                             FY2017     FY2018         FY2019    FY2020    FY2021(f)   CY2021
                                                                                         CY2020
                                                                                       Guidance

                                                 FGO       CGO       MGO
Forward Guidance (CY 2021 guidance advised 20/1/2021)
Gold Sales 270,000 – 300,000 oz
Focused
Increasing Output
Self-sufficient Note: Back-end skewed along with ramp-ups
Fiscally Strong
Quarter Sales C1 Cash Cost AISC
Long Life
High Margin
Still believe on track for CY guidance (COVID pending)Owner Operator - Underground Mining Services Focused Increasing Output Self-sufficient Fiscally Strong Long Life High Margin
Owner Operator - Open Pit Mining Services

Focused

Increasing Output

Self-sufficient

Fiscally Strong

Long Life

High Margin

                    UNIQUE - OWNER MINER
Efficiency Gains - Reducing Unit Costs
• Owner-operators: high fixed cost business.
• Operating expenditure (ex-growth essentially fixed).
Focused • As output increases unit costs decrease.
Increasing Output • Westgold costs have been reducing – industry increasing.
Self-sufficient 70,000
Quarterly Gold Prod'n and A$ Cost of Sales 1,800
60,000 1,500
Fiscally Strong
50,000
1,200
Qtr Prod'n Oz
Cost Per Oz
Long Life 40,000
900
30,000
High Margin 20,000
600
10,000 300
0 -
Mar Q 2020 Jun Q 2020 Sep Q 2020 Dec Q 2020
Gold Sales 53,265 66,234 60,030 65,167
C1 Cash Cost/oz 1,275 1,299 1,202 1,046
AISC/oz 1,525 1,638 1,459 1,293Fix the Operating Costs – Ride the Margin
3,000
$2,350/oz
Focused 2,500
$2,088/oz
A$800/oz (e)
A$ Gold Price/oz
Increasing Output 2,000 $1,768/oz A$570/oz
AISC Margin
$1,627/oz A$378/oz AISC Margin
$1,614/oz
Self-sufficient AISC Margin
1,500
Fiscally Strong
1,000
Long Life
High Margin 500
0
FY2017 FY2018 FY2019 FY2020 FY2021 Fcst
C1- Cash Cost AISC Achieved Gold PriceGrowth Capex - Shifting to Sustaining
18 Big Bell
Focused 14 ramp-up
26
Increasing Output 16
70
86
$' millions
Self-sufficient 90
60
20
Fiscally Strong 25 2
47
80 54
2 9 30
Long Life
5
47 45 17
28 23 17 18
High Margin FY2017 FY2018 FY2019 FY2020 FY2021 FCST FY2022 FCST
P&E Other Gold Op's P& E Big Bell
MP&D (big bell) MP&D
Expl & Eval'nScorecard Improving – HY Dec 2020 Results Focused Increasing Output Self-sufficient Fiscally Strong Long Life High Margin
Financially Engineered for Success

                                            Strong Cash & Bullion

                                          Spares, Ore Stocks & GIC

Focused
                                             3 Process Plants, 4
                                           camps o/pit & u/g mining
Increasing Output                                   fleet

                                            7 Underground mines,
Self-sufficient                                  5 open pits

                                              6.25 million oz of
Fiscally Strong                            resource not in reserves

Long Life                                  Prov’n Enviro Rehab

                                            Mine Equipment leases
High Margin                                     ROU contracts

                                          A 10 year Regional Project
                                                     with

                                           No Corporate Debt
ESG – Our Footprint (from our June 30, 2020 ESG Report)
1
Focused 950Trading Comparatives
2021 Forecast– World Gold Stocks
Size P/E (avg) P/CF (avg) EV/EBITDA (avg)
Large Caps (>$10bn US) 15.6 8.7 24.0
Upside
Mid Caps (>$2bn < $10bn US) 14.0 7.3 14.4
MEDIUM SMALL CAPs
Small Caps (>$1bn US)
CAPs 14.0 6.6 16.3
< 350k Oz pa
350k – 1m
Oz pa
Small Caps (< $1bn US) 13.8 8.9 24.7
Westgold 8.2 3.5 3.1
Source Data: Refinitiv ( from Thomson Reuters May 2021)Investment Synopsis
Domestic Gold Producer, Murchison WA Focus
ASX 200, GDX, GDXJ
Focused
Increasing Output Strong Balance Sheet – >A$178m in cash, no corporate debt
Self-sufficient
Self-sufficient, Owner Operator, Substantial Fixed Assets and Fleet
Fiscally Strong
Long Life Mines – Substantial Resource & Reserves
Long Life
High Margin Increasing Output, Increasing Margins, Reducing Capex
Committed, Focused, Responsible Miner, Track RecordResource & Reserves Summary
(@ June 30, 2020) – JORC 2012
Focused
Increasing Output
Self-sufficient Total Resource
8.8 Million Oz’s
Fiscally Strong
Long Life
High Margin
Total Reserves
2.56 Million Oz’sYou can also read