Fourth Quarter and Full Year 2019 Earnings Presentation - Feb. 4, 2020
←
→
Page content transcription
If your browser does not render page correctly, please read the page content below
Fourth Quarter and Full Year 2019
Earnings Presentation
Feb. 4, 2020

                           © 2019 ATI. All rights reserved.
Forward Looking Statements

This presentation contains forward-looking statements. Actual results may differ
materially from results anticipated in the forward-looking statements due to various
known and unknown risks, many of which we are unable to predict or control. These and
additional risk factors are described from time to time in the Company’s filings with the
Securities and Exchange Commission, including its Annual Report on Form 10-K for the
year ended December 31, 2018.

            © 2019 ATI. All rights reserved.                                                2
Five Strategic Imperatives Drive Our Focus

 • Execute aerospace production ramp

 • Sustainable profitability in Flat Rolled Products

 • Continue to improve the balance sheet

 • Create the foundation for future competitiveness and growth

 • Expand our competitive moat

          © 2019 ATI. All rights reserved.                       3
2019 Highlights
$M (excl. EPS)                                        Q4 2018    Q4 2019           % Chg.   FY 2018               FY 2019                  % Chg.
Revenue                                               $1,037.9   $1,018.6            (2%)   $4,046.6              $4,122.5                   +2%
Revenue (ex. divestitures)                            $989.9     $1,018.6             +3%   $3,863.8              $4,027.2                   +4%
Segment Operating Profit                               $87.3     $105.3              +21%   $413.2                  $380.7                   (8%)
Net Income*                                            $41.1      $56.5              +37%   $222.4                  $257.6                  +16%
Net Income* (ex. special items)                        $41.1      $50.2              +22%   $207.7                  $165.1                  (21%)
EPS                                                    $0.30      $0.41              +37%    $1.61                  $1.85                   +15%
EPS (ex. special items)                                $0.30      $0.36              +20%    $1.51                  $1.21                   (20%)
                                                                                                                                      *Attributable to ATI
Fourth Quarter vs. Prior Year
▪ Strong EPS growth driven by improved segment operating results
  ▪ Expansion across all HPMC product lines led by forgings
▪ Revenue growth (ex. divestitures) due to Aerospace & Defense increases in both operating segments

Full Year vs. Prior Year
▪ Solid revenue growth in Aerospace & Defense; declines in non-strategic end-markets
▪ Operating profit growth in HPMC segment, offset by FRP segment decline vs. strong prior year
▪ Increased retirement benefit expense of $36M primarily due to poor 2018 pension asset returns
▪ No material impact from 737 MAX grounding
▪ Accretive non-core asset sales aided net income improvement

                                                                                                       note: see appendix for reconciliation of non-GAAP financial measures
                                                                                                                                                                     4
                   © 2019 ATI. All rights reserved.
                                                                            January 2019                                                                                      4
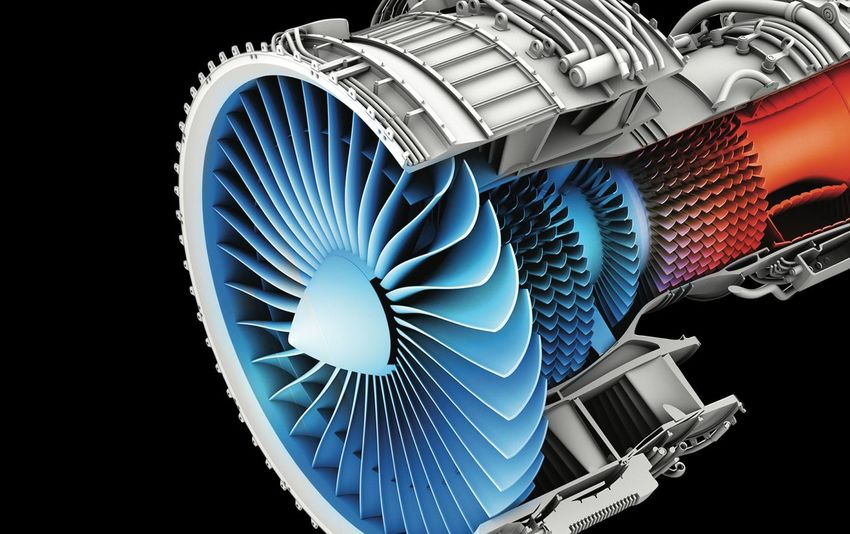
High Performance Materials & Components
Segment ($M)                                    Q4 ‘18       Q4 ‘19          ‘19 O/(U) ‘18    FY ‘18     FY ‘19    ‘19 O/(U) ‘18
Revenue                                         $596.1       $602.8                  +1%     $2,334.2   $2,398.1       +3%
Revenue (ex. divestitures)                      $548.1       $602.8                  +10%    $2,151.4   $2,302.8       +7%
Segment Operating Profit                             $76.0   $92.8                   +22%    $335.4     $343.1         +2%
% of Revenue                                     12.7%       15.4%              +270 b.p.     14.4%      14.3%       (10 b.p.)

Fourth Quarter vs. Prior Year
▪ Double-digit revenue growth (excl. divestitures)
   ▪ Defense and airframe sales increases; tempered by flat jet engine product sales
▪ Operating profit expansion
   ▪ Operating profit margin expansion led by profitable revenue growth and prior portfolio divestitures
   ▪ Increased operating rates across multiple facilities due to volume growth

Full Year vs. Prior Year
▪ Solid revenue growth (ex. divestitures) in a challenging industry environment
    ▪ Aerospace & Defense +9%; aggregate improvement in all other markets of +1%
▪ Operating profit improvement
    ▪ YOY margin expansion rate improved in H2’19

                                                                                                                                 5
                  © 2019 ATI. All rights reserved.
                                                                      January 2019                                                   5
High Performance Materials & Components
Revenue by Market (excluding divestitures)
                   2019 Full Year Revenue                                                                                Aerospace & Defense
                                                              Medical
                                   Gov’t &
                                   Defense               7%         Energy
                                     14%                       7%
                      Airframe
                                                                         Other
                                                                    7%
                         20%

                                      Jet Engine
                                          45%

                                                                                                       Jet Engine YOY
                  2019 YOY Revenue Change by Market
                                                                                                       ▪   Next generation: 51% of 2019 jet engine product sales
Jet Engine                       -1%               Medical                       -6%                   ▪   Temporary demand decline due to 3rd party billet supply issues and
Airframe                       +21%                Energy                        +19%                      customer management actions

Gov’t & Defense                +31%
                                                                                                       Airframe YOY
                                                                                                       ▪   Continued strong demand in Q4 up 14%; building on prior year growth
Aerospace & Defense             +9%
                                                                                                       Government & Defense YOY
                             HPMC Segment +7%                                                          ▪   Growth across product lines; led by naval materials and military aerospace

                                                                                                                              note: see appendix for reconciliation of non-GAAP financial measures
                                                                                                                                                                                            6
                      © 2019 ATI. All rights reserved.
                                                                                        January 2019                                                                                                 6
Flat Rolled Products
Segment ($M) Q4 ‘18 Q4 ‘19 ‘19 O/(U) ‘18 FY ‘18 FY ‘19 ‘19 O/(U) ‘18
Revenue $441.8 $415.8 (6%) $1,712.4 $1,724.4 +1%
Segment Operating Profit $11.3 $12.5 +11% $77.8 $37.6 (52%)
% of Revenue 2.6% 3.0% +40 b.p. 4.5% 2.2% (230 b.p.)
Fourth Quarter vs. Prior Year
▪ Revenue declined 6%
▪ Growth in Aero & Defense offset by continued soft standard value product demand
▪ Decline in Oil & Gas due to large pipeline project in prior year period
▪ Operating profit improved by 11%
▪ Positive raw material benefits; reduced A & T Stainless JV loss
ATI FRP Type 304 Surcharge 2018-2019
Full Year vs. Prior Year $0.6000
▪ Revenue increased 1% $0.5500
$0.5000
▪ Strong growth in several core markets $0.4500
$0.4000
▪ Market-driven declines for standard value products $0.3500
$0.3000
▪ Solid profitability for the 3rd straight year $0.2500
▪ Weak Q1’19 results offset by solid H2’19 operating profit
$0.2000
$0.1500
▪ Cost inefficiencies due to low standard value product demand
$0.1000
Oct '18 Nov Dec Jan '19 Feb Mar Apr May Jun Jul Aug Sep Oct Nov Dec Jan '20 Feb Mar
Source: ATImetals.com nickel ferrochrome
Lower raw material prices for Q1 ‘20
7
© 2019 ATI. All rights reserved.
January 2019 7Flat Rolled Products
Revenue by Market & Product
2019 Full Year Revenue by Market 2019 Full Year Revenue by Product
Construction & Mining
Energy
Food Equip/
Appliance 9% 8%
12% Electronics
9% Standard Value Precision & Eng.
Stainless Strip
4% Other 30% 32%
Aero & Def
15%
Oil & Gas Nickel &
Automotive Specialty Alloys
26% Titanium
17% 6%
32%
2019 YOY Revenue Change by Market 2019 YOY Revenue Change by Product
Oil & Gas -5% Const. & Mining -1% Precision & Eng. Strip -4%
Automotive -9% Energy +25% Nickel & Spec. Alloys +12% Standard Value Stainless -9%
Aero & Defense +30% Electronics +6%
Titanium Products +21%
Food Equip & Appl. -16%
Strong growth in key markets; Soft std. value market demand High-value product sales up 5% YOY
8
© 2019 ATI. All rights reserved.
January 2019 8Financial Update
Free Cash Flow Balance Sheet and Cash Flow
$ millions
▪ Q4 and FY 2019 results
2015 2016 2017 2018 2019 ▪ Strong liquidity with $491 million cash on hand and ~$450 million of
457 undrawn revolver capacity at year end
+59%
▪ Cash from operations of $240 million in Q4 2019
▪ Managed working capital: 30% of sales, lower by ~160 b.p. YOY
288 ▪ Capital expenditures of $70 million (2019 FY: $168 million)
▪ Reduced debt outstanding by $150 million; lowered annual interest
expense by $9 million
▪ Redeemed $500 million of 5.95% debt due Jan. 2021
38 ▪ Issued $350 million of 5.875% debt due Jan. 2027
▪ No scheduled maturities until 2022
(13) ▪ Year-end free cash flow and cash balance negatively impacted by
early redemption of 2021 debt
(129)
Significant YOY increase driven by portfolio actions
and ongoing managed working capital improvements
9
note: see appendix for reconciliation of non-GAAP financial measures
© 2019 ATI. All rights reserved.
January 2019 92020 Outlook
Full Year 2020 Key Outlook Assumptions
▪ 737 MAX production restart in Q2
EPS1 FCF2
▪ Nickel prices in expected range ($6.00/lb. - $6.50/lb.)
$0.75 - $0.90 $135M - $165M
▪ Minimal global impact from the Coronavirus epidemic
▪ Effective tax rate 23% - 25% in 2020
Q1 2020 Key Drivers
▪ Aerospace & Defense growth beyond 737 MAX
EPS1: $0.12 - $0.16 ▪ Emergent demand fulfillment across 2020
▪ Continued managed working capital discipline
▪ Benefits realized from:
1
2
excluding special items
see appendix for reconciliation of non-GAAP financial measures
✓ Cost containment actions
✓ Lower retirement benefit expense
✓ Interest savings
© 2019 ATI. All rights reserved.
✓ Active management of working capital 102020 Financial Assumptions
Category 2020 Expected Impact 2019 Actual
U.S. Pension trust contribution ~$130 $145
Retirement benefit expense ~$60 $88
Capital expenditures $200 - $210 $168
Managed working capital ~30.0% sales 30.0% sales
Interest expense $86 - $90 $99
Effective book tax rate 23% - 25% 5.5%
Cash tax rate 5% - 7% ~2%
Diluted average share count (Q1) ~147 million shares 146.5 million shares
$2.4 (after-tax) quarterly interest expense addback to EPS numerator when
Impact of 2022 convertible notes
using diluted average share count
$ millions unless otherwise stated
Comments
▪ Lower pension contribution in 2020 due to strong 2019 return on pension assets
▪ Capital expenditure increase to support long-term profitable share gains and volume growth
▪ Increases offset by managed working capital improvements in cash flow
▪ Interest expense reduced due to $150M debt reduction in Q4 ‘19
▪ Normalized book tax rate post year-end 2019 tax valuation allowance release
11
© 2019 ATI. All rights reserved.
January 2019 11Fourth Quarter and Full Year 2019
Earnings Presentation
Q&A
© 2019 ATI. All rights reserved.
12Additional Materials Appendix
Non-GAAP Financial Measures
Allegheny Technologies Incorporated and Subsidiaries
Non-GAAP Financial Measures
(Unaudited, dollars in millions, except per share amounts)
The Company reports its financial results in accordance with accounting principles generally accepted in the United States of America ("GAAP"). However, management
However,that
believes management
certain non-GAAP
believes that
financial
certain
measures,
non-GAAP usedfinancial
in managing
measures,
the business,
used in may
managing
provide
theusers
business,
of thismay
financial
provideinformation
users of thiswith
financial
additional meaningful comparisons
information
between current
withresults
additional
and results
meaningful
in prior
comparisons
periods. Non-GAAP
between current
financial
results
measures
and results
should
in prior
be viewed
periods.
in addition
Non-GAAP to, and
financial
not as an
measures
alternative
should
for,be
the Company's reported
viewedprepared
results in addition
in accordance
to, and not as
with
an GAAP.
alternative
The
for,
following
the Company's
table provides
reportedthe
results
calculation
preparedof the
in accordance
non-GAAPwith financial
GAAP. measures
The following
discussedtable
in the
provides
Company's earnings release
theFebruary
on calculation
4, of
2020:
the non-GAAP financial measures discussed in the Company's press release dated January 22, 2019:
Three Months Ended Fiscal Year Ended Fiscal Year Ended
December 31, 2019 December 31, 2019 December 31, 2018
Net income attributable to ATI $ 56.5 $ 257.6 $ 222.4
Adjust for special items:
Gain on sale of oil & gas rights, net of tax (a) $ - $ (87.8) $ -
Loss on sale of industrial forgings business, net of tax (b) - 7.6 -
Gain on sale of cast products business, net of tax (c) - (6.0) -
Restructuring, net of tax (d) 4.3 4.3 -
Debt extinguishment charge, net of tax (e) 20.5 20.5 -
Joint venture impairment reserve, net of tax (f) 10.8 10.8 -
Income tax valuation allowance (g) (41.9) (41.9) -
Gain on joint venture deconsolidation, net of tax (h) - - (14.7)
Net income attributable to ATI excluding special items $ 50.2 $ 165.1 $ 207.7
Per Diluted Share * Per Diluted Share * Per Diluted Share *
Net income attributable to ATI $ 0.41 $ 1.85 $ 1.61
Adjust for special items:
Gain on sale of oil & gas rights, net of tax $ - $ (0.60) $ -
Loss on sale of industrial forgings business, net of tax - 0.05 -
Gain on sale of cast products business, net of tax - (0.04) -
Restructuring, net of tax 0.03 0.03 -
Debt extinguishment charge, net of tax 0.14 0.14 -
Joint venture impairment reserve, net of tax 0.07 0.07 -
Income tax valuation allowance (0.29) (0.29) -
Gain on joint venture deconsolidation, net of tax - - (0.10)
Net income attributable to ATI excluding special items $ 0.36 $ 1.21 $ 1.51
14
© 2019 ATI. All rights reserved.
January 2019 14Non-GAAP Financial Measures
* Presentation of adjusted results per diluted share includes the effects of convertible debt, if dilutive.
(a) Full year 2019 results include a $91.7 million pre-taxgain on the sale of oil & gas rights in New Mexico.
(b) Full year 2019 results include an $8.1 million pre-tax loss on the sale of the industrial forgings business, including $10.4 million of allocated goodwill.
(c) Full year 2019 results include a $6.2 million pre-tax net gain on the sale of the cast products business, which includes a $10.2 million write-down of the carrying value of
long-lived assets of the retained Salem operations.
(d) Full year and Q4 2019 results include a $4.5 million pre-tax restructuring charge to streamline ATI’s salaried workforce primarily to improve the cost competitiveness of
the U.S.-based Flat-Rolled Products business.
(e) Full year and Q4 2019 results include a $21.6 million pre-tax debt extinguishment charge for the full redemption of the $500 million, 5.95% Senior Notes due 2021.
(f) Full year and Q4 2019 results include an $11.4 million pre-tax joint venture impairment charge for the Allegheny & Tsingshan Stainless joint venture, which included
ATI's 50% share of the JV's impairment charge on the carrying value of long-lived assets at the Midland, PA production facility.
(g) Full year and Q4 2019 results include a $41.9 million discrete tax benefit primarily related to the reversal of aportion of deferred tax valuation allowances due to exiting
the three-year cumulative loss condition for U.S. Federal and state jurisdictions at year-end 2019.
(h) Full year 2018 results include a gain on deconsolidation of Allegheny & Tsingshan Stainless joint venture following the sale of a 50% noncontrolling interest and
subsequent derecognition. The $15.9 pretax gain, including ATI's retained 50% share, was recorded at fair value.
15
© 2019 ATI. All rights reserved.
January 2019 15Non-GAAP Financial Measures
Fiscal Year Ended
First Quarter 2019 December 31, 2019
Per Diluted Share Per Diluted Share
Net income attributable to ATI $ 0.12 $ 1.85
Tax rate impact (i) (0.03) (0.62)
Adjusted net income attributable to ATI $ 0.09 1.23
Special items (j) (0.27)
Adjusted net income attributable to ATI excluding special items $ 0.96
(i) Tax rate impact for the first quarter 2019 adjusts 2019 reported earnings per share, which used a 4.7% effective tax rate applied to income before taxes, to a 24%
effective tax rate applied to income before taxes, which is the mid-point of the anticipated annual effective tax rate range for fiscal year 2020, including the impacts of
potentially dilutive securities.
Tax rate impact for the full year 2019 adjusts 2019 reported earnings per share, which used a 5.7% effective tax rate applied to income before taxes and included a $41.9
million discrete tax benefit primarily related to the reversal of a portion of deferred tax valuation allowances, to a 24% effective tax rate applied to income before taxes,
which is the mid-point of the anticipated annual effective tax rate range for fiscal year 2020, including the impacts of potentially dilutive securities.
(j) Amount includes the $52.3 million net pre-tax gain for special items discussed in (a)-(f) above and presents this amount net of tax, using a 24% effective tax rate which
is the mid-point of the anticipated annual effective tax rate range for fiscal year 2020.
16
© 2019 ATI. All rights reserved.
January 2019 16Non-GAAP Financial Measures
Free Cash Flow
For the Years Ended December 31,
($ in millions) 2015 2016 2017 2018 2019
Cash provided by (used in) operating activities $ 131.4 $ (43.7) $ 22.4 $ 392.8 $ 230.1
Cash (used in) provided by investing activities (145.1) (200.0) (119.6) (145.1) 81.7
Add back: cash contributions to ATI Pension Plan 0.3 115.0 135.0 40.4 145.0
Free Cash Flow as defined $ (13.4) $ (128.7) $ 37.8 $ 288.1 $ 456.8
Free cash flow as defined by ATI includes the total of cash provided by (used in) operating activities and investing activities as presented on the consolidated statements of
cash flows, adjusted to exclude cash contributions to the Company’s U.S. qualified defined benefit pension plans.
Adjusted Sales Information Industrial Forgings
($ in millions) and Cast Products
Reported Businesses Adjusted
Total ATI Sales- Q4 2019 $ 1,018.6 $ - $ 1,018.6
Total ATI Sales- Q4 2018 1,037.9 (48.0) 989.9
Percentage Change -1.9% 2.9%
Total ATI Sales- Full Year 2019 $ 4,122.5 $ (95.3) $ 4,027.2
Total ATI Sales- Full Year 2018 4,046.6 (182.8) 3,863.8
Percentage Change 1.9% 4.2%
HPMC Sales- Q4 2019 $ 602.8 $ - $ 602.8
HPMC Sales- Q4 2018 596.1 (48.0) 548.1
Percentage Change 1.1% 10.0%
HPMC Sales- Full Year 2019 $ 2,398.1 $ (95.3) $ 2,302.8
HPMC Sales- Full Year 2018 2,334.2 (182.8) 2,151.4
Percentage Change 2.7% 7.0%
HPMC Aerospace & Defense Markets Sales- Full Year 2019 $ 1,879.1 $ (68.0) $ 1,811.1
HPMC Aerospace & Defense Markets Sales- Full Year 2018 1,771.3 (108.1) 1,663.2
Percentage Change 6.1% 8.9%
17
© 2019 ATI. All rights reserved.
January 2019 17Non-GAAP Financial Measures
Adjusted Sales Information Industrial Forgings
($ in millions) and Cast Products
Reported Businesses Adjusted
HPMC All Other Sales (ex Aero & Defense)- Full Year 2019 $ 519.0 $ (27.3) $ 491.7
HPMC All Other Sales (ex Aero & Defense)- Full Year 2018 562.9 (74.7) 488.2
Percentage Change -7.8% 0.7%
HPMC Commercial Jet Engine Sales- Full Year 2019 $ 1,066.6 $ (44.5) $ 1,022.1
HPMC Commercial Jet Engine Sales- Full Year 2018 1,100.6 (71.4) 1,029.2
Percentage of Total HPMC Segment Sales 45% 45%
Percentage Change -3.1% -0.7%
HPMC Commercial Airframe Sales- Full Year 2019 $ 481.0 $ (16.1) $ 464.9
HPMC Commercial Airframe Sales- Full Year 2018 411.2 (25.4) 385.8
Percentage of Total HPMC Segment Sales 20% 20%
Percentage Change 17.0% 20.5%
HPMC Government & Defense Sales- Full Year 2019 $ 331.5 $ (7.4) $ 324.1
HPMC Government & Defense Sales- Full Year 2018 259.5 (11.3) 248.2
Percentage of Total HPMC Segment Sales 14% 14%
Percentage Change 27.7% 30.6%
Next Generation Jet Engine Product Sales- Full Year 2019 $ 602.3 $ (37.1) $ 565.2
HPMC Jet Engine Product Sales- Full Year 2019 1,154.0 (50.4) 1,103.6
Percentage of Total HPMC Segment Sales 52.2% 51.2%
HPMC Commercial Airframe Sales- Q4 2019 $ 110.5 $ - $ 110.5
HPMC Commercial Airframe Sales- Q4 2018 103.8 (6.5) 97.3
Percentage Change 6.5% 13.6%
Adjusted Sales metrics are non-GAAP measures that exclude the impacts of divestitures. These measures are utilized by management to evaluate underlying business trends
of the ongoing businesses.
18
© 2019 ATI. All rights reserved.
January 2019 18You can also read