Degradation of Commercial Li-ion Cells Beyond 80% Capacity
←
→
Page content transcription
If your browser does not render page correctly, please read the page content below
Degradation of Commercial Li-ion Cells
Beyond 80% Capacity

 PRESENTED BY

 Yu l i y a P re g e r

 Energy Storage Systems Safety & Reliability Forum                     Sandia National Laboratories is a multimission
                                                                       laboratory managed and operated by National
                                                                       Technology & Engineering Solutions of Sandia,
 April 20, 2021                                                         LLC, a wholly owned subsidiary of Honeywell
                                                                       International Inc., for the U.S. Department of
                                                                             Energy’s National Nuclear Security

                                                     SAND2021-4787 C
                                                                       Administration under contract DE-NA0003525.
2   Moving Beyond 80% Capacity for Grid Applications
    • 80% capacity is a common reference point in manufacturer spec sheets

         Examples:

    • 80% capacity is a holdover from the EV world
         o USABC 1996: “EV batteries should be removed from automotive use when current battery capacity is 80% of
           initial battery capacity and current battery power capability is 80% of initial battery power capability”
         o At this time, EVs were primarily powered by Ni-based batteries

    • Unrealistic criteria for Li-ion batteries with higher energy density and power capability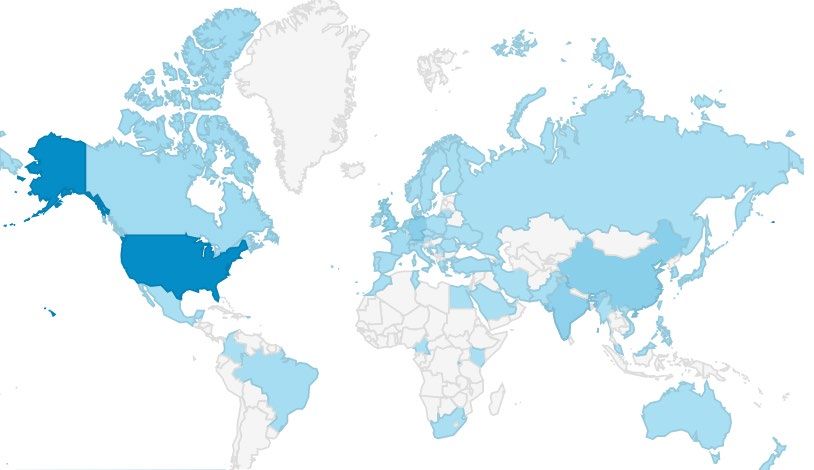
3   Overview

    1) Recent experimental work on battery degradation beyond 80% capacity

    2) Review of battery degradation tipping points

    3) Visualization tools for battery lifecycle analysis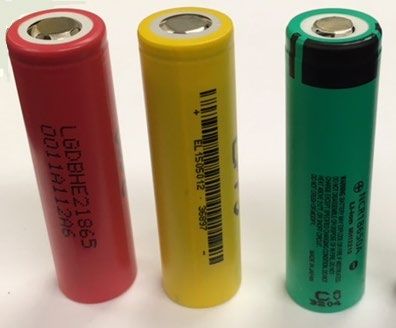
4    Scope of Current Study at SNL: Cells and Manufacturer Specifications

                  Positive Electrode      AKA    Vendor       Specific         Max       Acceptable
                      Chemistry                             Capacity (Ah)   Discharge   Temperature
                                                                             Current        (oC)
                       LiFePO4            LFP     A123           1.1           30         -30 to 60
                 LiNi0.81Co0.14Al0.05O2   NCA   Panasonic        3.2           6           0 to 45
                 LiNi0.84Mn0.06Co0.1O2    NMC   LG Chem          3.0           20          -5 to 50

    LFP    NCA          NMC

                                                                                        Variables:
                                                                                        •    Charge Rate: 0.5C
                                                                                        •    Discharge Rate: 0.5C, 1C, 2C, 3C
                                                                                        •    SOC Range: 40-60%, 20-80%, 0-100%
                                                                                        •    Temperature: 15oC, 25oC, 35oC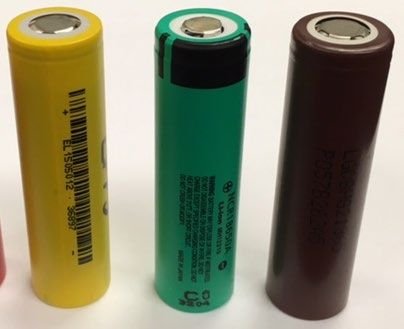
5   Cycling to 80%

          Data based on range of cycling conditions (within manufacturer’s spec)
6   Cycling Past 80%: Preliminary Insights

                                             Work led by Reed Wittman,
                                             Armando Fresquez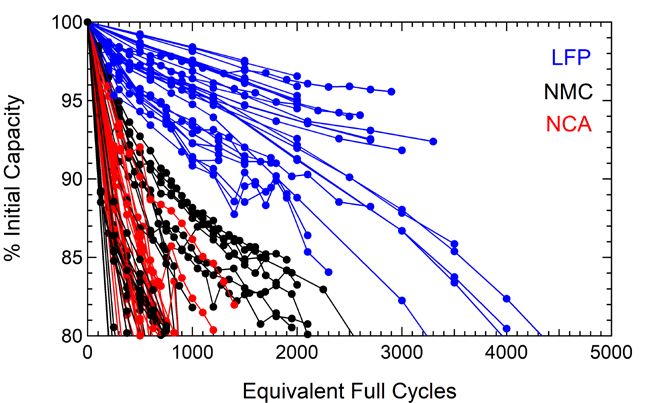
7   Long-Term Cycling: Temperature Dependence

                   Constant: 0.5C/1C, 0-100%,

                                                LFP and NMC exhibit         inverse
                                                dependence on temperature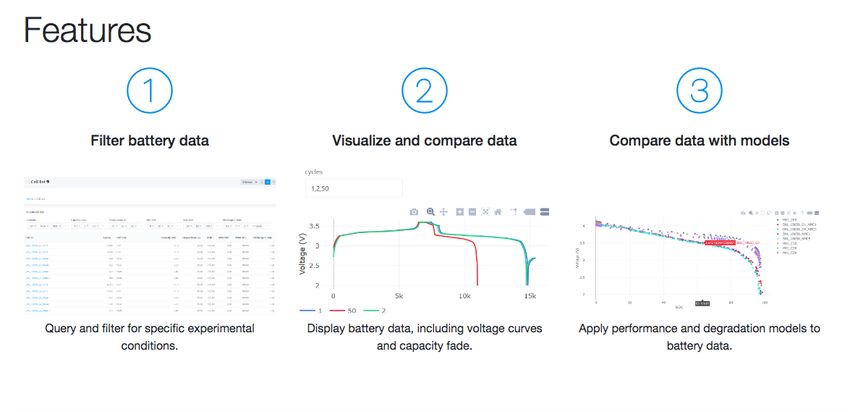
8   Long-Term Cycling: SOC Dependence

                     Constant: 0.5C/0.5C, 25°C

                                                 NCA and NMC more sensitive to full
                                                 discharge
9 Knees Beginning to Emerge
10   Overview

     1) Recent experimental work on battery degradation beyond 80% capacity

     2) Review of battery degradation tipping points

     3) Visualization tools for battery lifecycle analysis
11 How Far Beyond 80% Should We Go?
One possible criteria: until a battery undergoes rapid degradation
1
2
• Typical model of LiB degradation assumes a transition from linear
behavior 3
o Phase 1: SEI formation
o Phase 2: linear degradation
o Phase 3: rapid capacity fade
Spotnitz et al. J. Power Sources 2003, 113, 72.
• Transition to rapid capacity fade has many names
o Transition point, tipping point, knee, rollover12 How Far Beyond 80% Should We Go?
One possible criteria: until a battery undergoes rapid degradation
1
2
• Typical model of LiB degradation assumes a transition from linear
behavior 3
o Phase 1: SEI formation
o Phase 2: linear degradation
o Phase 3: rapid capacity fade
Spotnitz et al. J. Power Sources 2003, 113, 72.
• Transition to rapid capacity fade has many names
o Transition point, tipping point, knee, rollover
What causes the knee point?Multi-Institution Team Reviewing Empirical Causes and
13
Mechanisms of Knee Points
A*STAR (Edwin Khoo, Ouyang Liu) RWTH Aachen University (Philipp Dechent)
NREL (Paul Gasper) University of Warwick (Ferran Brosa Planella)
Carnegie Mellon University (Shashank Sripad, Alec Bills) University of Oxford (David Howey, Sam Greenbank)
University of Michigan (Anna Stefanopoulou, Valentin Sulzer) Peter Attia, Abhishek Soni14
“Perturbation” of Any Variable Can Induce Knees –
I. Cell Design
Variable Cell Description Range of Variable Knee Acceleration
Electrode loading Lab-made pouch NMC/Gr 14.4-21.2 mg/cm2 Higher positive electrode loading
Positive electrode coating Lab-made pouch NMC/Gr Ti-based coating Uncoated positive electrode
Graphite type Lab-made pouch NMC/Gr artificial, natural Natural graphite
Lab-made pouch LCO/Gr-Si NA FEC consumed
Additive package and Lab-made coin LFP/Gr-Si 0-20 wt.% FEC FEC consumed
concentration Lab-made pouch NMC/Gr 0-20% methyl acetate additive Higher methyl acetate concentration
Lab-made pouch NMC/Gr 0.2-1.2M LiPF6 Higher salt concentration
Lab-made pouch NMC/Gr 1.2-1.5M LiPF6 Lower salt concentration
Salt concentration Lab-made pouch LCO/Gr 0.5-2M LiPF6 Higher salt concentration“Perturbation” of Any Variable Can Induce Knees –
15
II. Testing Conditions
Variable Cell Description Range of Variable Knee Acceleration
OMT OMLIFE-8AH-HP LFP/Gr 1-8C Higher charging rate
Commercial 26650 LFP/Gr 0.5-1C Higher charging rate
Panasonic 18650 NCA/Gr 0.1-1C Higher charging rate
Charging rate
Cylindrical NCA/Gr 0.25-1C, single vs. multi-step CC, optional CV Higher charging rate, CV
E-One Moli Energy IHR18650A NMC/Gr 0.2-1C Higher charging rate
A123 APR18650M1A LFP/Gr 3.6-8C Higher charging rate
0.25-2C with AC pulse, current derating, Higher charging rate, no AC pulse or
Samsung ICR18560-26F NMC/Gr current interrupt current interrupt
Cylindrical NMC/Gr 0.7-1C Higher charging rate
a) Sanyo UR18650SA LMO+NMC/Gr a) 2.4-4C a) No difference
Discharging rate
b) Sony US18650VT1 LMO+LCO/Gr b) 2.7-4.5C b) No difference
c) A123 APR18650M1A LFP/Gr c) 2.7-4.5C c) Lower discharging rate
Cylindrical NMC/Gr 1-2C Lower discharging rate
Commercial 18650 NCA/Gr 1-4C Lower discharging rate
Commercial cylindrical LFP/Gr 1-15C Higher discharging rate
Pouch LCO/Gr 0.7-2C No difference at 10-45°C
Saft VLE NCA/Gr 50%-100% storage SOC Higher SOC
Lab-made pouch NMC/Gr 4.3-4.4V charge cutoff voltage Higher voltage
1) 0.5%-100% DOD, 50% SOC midpoint 1) Higher DOD
Voltage limits
Sanyo UR18650E NMC/Gr 2) 10% DOD and midpoint SOC of 10%-95% 2) Extreme midpoints
Commercial 26650 LFP/Gr 30-50% vs. 5-95% SOC Higher DOD
E-One Moli Energy IHR18650A NMC/Gr 0.56-1.2V DOD, 3.6V midpoint Higher DOD
1) Higher DOD
Commercial prismatic NMC+LMO/Gr 0-20%, 20-60%, 60-100%, 0-100% SOC 2) Higher midpoint SOC
Commercial 26650 LFP/Gr 0-80% vs. 0-100% SOC Higher DOD
Samsung INR 18650 25R NMC+NCA/Gr 20-60% DOD, 15-85% SOC midpoint Lower SOC“Perturbation” of Any Variable Can Induce Knees –
16
II. Testing Conditions
Variable Cell Description Range of Variable Knee Acceleration
Cylindrical NMC/Gr 10-900s at TOC and BOD Longer rest time
Rests
Lab-made pouch NMC/Gr 0-30min at TOC and BOD Longer rest time
Commercial prismatic NMC/Gr 0-every 100 cycles Shorter rest time
NMC/Gr 25-45°C Temperature above and below 25°C
Saft VLE NCA/Gr 20-60°C Higher temperature
Temperature
E-One Moli Energy IHR18650A NMC/Gr 25-50°C Temperature above and below 35°C
Commercial 26650 LFP/Gr 25-45°C Higher temperature
Commercial 18650 NMC+LMO/Gr -20-70°C Temperature above and below 25°C
Commercial 18650 NMC+LMO/Gr
Commercial 18650 NMC/Gr 0-25°C Lower temperature
Cylindrical NCA/Gr 0-60°C Temperature below 25°C
Commercial pouch NMC/Gr 4 bracing approaches More rigid bracing or zero bracing
Pressure
Pouch LCO/Gr 0-5 MPa Higher stack pressure or zero pressure
E-One Moli Energy IHR18650A NMC/Gr Heterogeneous compression
In summary: knee points are complex and occur under many conditions
Next step: link all experimental observations to broad mechanisms of failure (e.g. Li plating, loss of
active material, resistance growth)17 Overview
1) Recent experimental work on battery degradation beyond 80% capacity
2) Review of battery degradation tipping points
3) Visualization tools for battery lifecycle analysis18 What is the Battery Data Challenge?
Little raw data are publicly available
(difficult to extract info from figures)
Even when raw data are available,
they’re not standardized
This makes it difficult to compare results from different groups and do larger-scale analyses.19 First Multi-Institution Battery Cycling Database
Core site development: Valerio De Angelis
Front end: Sam Roberts-Baca20 First Multi-Institution Battery Cycling Database
Search by metadata related to cell + cycling conditions Efficiencies, capacity and energy decay, and voltage curves
automatically plotted for selected cellsOpen-Source Platform Underpinning Battery Archive Released to
21 Community
• Public site is based on the Battery Lifecycle Framework (BLC) - an open-source platform that provides tools to visualize, analyze,
and share battery data through the technology development cycle
• BLC has four components: (1) data importers, (2) one or more databases, (3) a front-end for querying the data and creating
visualizations, (4) an application programming interface to process the data
Preprint: https://ecsarxiv.org/h7c24
Github: https://github.com/battery-lcf/battery-archive-sandbox22 Current Impact
Over 2000 site users, many return visits, from over 40 countries,
academia and industry23 Current Impact
Sources of datasets & collaborators
Over 2000 site users, many return visits, from over 40 countries,
academia and industry Datasets online
Datasets in pipeline
Software interoperability
BEEP24 Summary
1) Recent experimental work on battery degradation beyond 80% capacity
• Some cells cycled to 40%
• Beginning to see knee points
2) Review of battery degradation tipping points
• Can be induced by perturbation of any variable (cell design, testing conditions)
3) Visualization tools for battery lifecycle analysis
• BatteryArchive.org public site developed to aid standardized battery data viewing
• Underlying framework released as open-source software25 Acknowledgments
•Funded by the U.S. Department of Energy, Office of Electricity, Energy Storage program. Dr. Imre Gyuk,
Program Director.
•Sandia National Laboratories is a multi-mission laboratory managed and operated by National Technology
and Engineering Solutions of Sandia, LLC., a wholly owned subsidiary of Honeywell International, Inc., for
the U.S. Department of Energy's National Nuclear Security Administration under contract DE-NA-0003525.
For questions about this presentation: ypreger@sandia.govYou can also read