Study of the Reality on Electric Vehicle in Indian Scenario
←
→
Page content transcription
If your browser does not render page correctly, please read the page content below

IOP Conference Series: Materials Science and Engineering

PAPER • OPEN ACCESS

Study of the Reality on Electric Vehicle in Indian Scenario
To cite this article: Bappaditya Kar et al 2021 IOP Conf. Ser.: Mater. Sci. Eng. 1080 012003

View the article online for updates and enhancements.

                               This content was downloaded from IP address 46.4.80.155 on 26/08/2021 at 13:00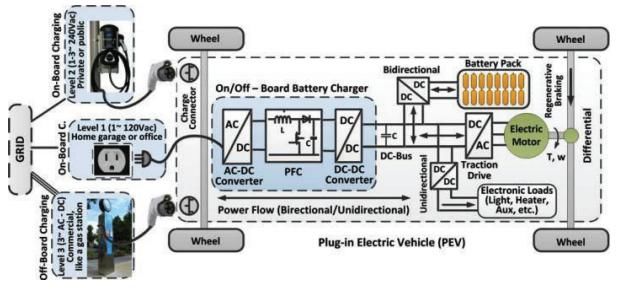
ICAMEI 2021                                                                                                              IOP Publishing
IOP Conf. Series: Materials Science and Engineering              1080 (2021) 012003           doi:10.1088/1757-899X/1080/1/012003

Study of the Reality on Electric Vehicle in Indian Scenario

                     Bappaditya Kar1, Tarun Kanti Pal1*, Suvanjan Bhattacharyya2,
                     1*
                        Department of Mechanical Engineering
                     College of Engineering and Management, Kolaghat - 721 171, India
                     2
                       Department of Mechanical Engineering
                     Birla Institute of Technology and Science (BITS)
                     Pilani - 333031, (Rajasthan), India
                     (1*Email: tarunkantipal@gmail.com)

                     Abstract: In this work, the estimation of the actual CO2 emission of a conventional IC
                     engine vehicle and an electric vehicle have been studied in different phases and those
                     vehicles are in same segmented also. How much time it would be taken in order to
                     convert an electric vehicle in to a Green Vehicle (GV) also been studied. In our work,
                     we compare two similar SUV’s in there same segment one is Electric Vehicle (EV)
                     and another is conventional IC Engine Vehicle (ICV). Both the cars have very similar
                     power output; torque and design in there segment. Although there are many options of
                     fast charging, long refuelling or recharging time is a major problem of the EV but this
                     is not our concern study. In science each and every innovation has one good and a bad
                     side, and there is no exception about the EVs also.

                     Keywords: CO2 emission, Lithium ion battery, Conventional IC engine vehicle,
                     Electric Vehicle, Green vehicle

 1. Introduction

 India emits around 3 Giga tonnes of CO2 and other greenhouse gases per year. Nearly 25% of this
emission occurs due to each and every types of road transport vehicles [1]. In order to reduce emitted
greenhouse gases slowly then it should be moved in to the Electric vehicles (EV). That’s why many
vehicle manufacturers are presently manufacturing different types of EVs. Many of peoples are
appreciated that every EV is a Green Vehicle (GV) that means all EV are environment friendly then
the conventional IC Engine Vehicles (ICV). But in reality there be a short of attention.

1.1. Introduction of both cars

In this work, we consider two similar SUV segmented cars; one is conventional IC engine vehicle
having 1.5 L turbo charged diesel engine which has the mileage of around 17 to 22 km pl, company
claims that. That car has a power of 108 bhp and maximum 260 Nm torque. Another is electric vehicle
is a fully electric suv car and it’s reach upto 312 km maximum range during a single charge. The

              Content from this work may be used under the terms of the Creative Commons Attribution 3.0 licence. Any further distribution
              of this work must maintain attribution to the author(s) and the title of the work, journal citation and DOI.
Published under licence by IOP Publishing Ltd                          1
ICAMEI 2021 IOP Publishing
IOP Conf. Series: Materials Science and Engineering 1080 (2021) 012003 doi:10.1088/1757-899X/1080/1/012003
battery pack used in this is a 30.2 kwh li-ion battery. The car has a power of 127 bhp and maximum
torque is around 245 Nm [2].
1.2. Dark side of Lithium- ion Battery production:
The Lithium Triangle is a region of the Andes rich in lithium reserves around the borders of
Argentina, Bolivia and chilli. The area is thought to hold around 54% of world’s lithium reserves. The
production of a battery cell requires sourcing of as much as 20 different materials from around the
worlds, which will pass through several refining stages, for those refining stages depending on the
different energy sources, and those energy sources all are not renewable. Another think is for several
material purification processes is not environment friendly [3].
The Car manufacturers are basically used lithium ion battery because li-ion batteries power density is
much high than any type of other conventional battery’s and li-ion batteries has another advantages
that li-ion batteries are weight/ power ratio is high and those are less dangerous than lithium polymer
batteries. Emission of high amount of CO2 during mining and production phase is the main dark side
of li-ion batteries. In li-ion batteries there is a small amount of lithium is used around 6% only, another
component of this batteries is Cobalt. Blasting and electricity consumption in Cobalt mining is
damaging the environment. Carbon dioxide and nitrogen dioxide emission are much larger during
cobalt mining. CO2 emission in battery production is depends upon the capacity of the battery.
The maximum charge density of this battery is around 240 wh per kg. The average value of CO2
emission is 177 kg CO2/kwh power, the lowest value is 121 kg CO2/kwh and highest value is 250 kg
CO2/kwh [4].
1.3. Power Electronics
Figure 1 shows power electronics employed in electric vehicles. In an EV power electronics plays the
various power conversion processes from the plug to wheel. The different power electronics
converters working in EVs like a) AC-DC converter b) DC-DC converter c) DC-AC converter d) AC-
AC converter [1].
Figure 1: Power Electronics employed in an EV [1]
2ICAMEI 2021 IOP Publishing
IOP Conf. Series: Materials Science and Engineering 1080 (2021) 012003 doi:10.1088/1757-899X/1080/1/012003
1.4. Different ways of Electricity produce in India
There are different ways of grid electricity production in India; most of the electricity is produced by
fossil fuels simply from coal. And the coal mining is also not environment friendly.
Figure 2: Resource for production of electricity in India
This is simply understandable from Fig.2 is that the maximum energy of grid is produced from
burning the coal and few from natural gas is around 57%. Now if the power station with an efficiency
of 34% burns coal, it emits 1.0 kg CO2 for generating of one kwh of electricity ( i.e 1kwh electricity
= 1 kg of CO2.). And approx 57%of electricity is generated by burning of fossil fuels. This data is
very vital for farther calculating the CO2 emission [5].
2. Comparison of both cars in different phases
This work does not compare the production or manufacturing phase, because the amount of CO2 emits
for both the cases is more or less same. The reasons behind this the CO2 emission due chassis
production is same for both cases and CO2 emission due to engine and transmission is equal to the
electric motor and inverter production. Mainly we compare three phases those are:
Fuel production for ICV.
Battery production for EV.
Performance and efficiency of ICV.
Performance and efficiency of EV.
CO2 emits per year of running those vehicles.
And finally it has been studied how many years it will take in order to convert an EV in to GV.
2.1. Fuel production for ICV:
1.06kwh power is required to purification or refining of 1 litre of gasoline. The approximate CO2
emission per litre of diesel fuel burning is 2.68kg, and for petrol it is around 2.31kg. LPG produces
around 1.51kg per litre.
3ICAMEI 2021 IOP Publishing
IOP Conf. Series: Materials Science and Engineering 1080 (2021) 012003 doi:10.1088/1757-899X/1080/1/012003
2.2. Battery production phase:
The average value of CO2 emission is 177 kg co2/kwh power. So for the 30.2kwh battery pack total
emission is around 5.3 metric tonne of CO2. More bigger battery means it will emits more CO2, for
60kwh battery emits more than 10 metric tonnes of CO2 and for 100kwh emits 17 metric tonnes of
CO2 [6] .
2.3. Performance and efficiency of ICV:
The average efficiency of an IC engine is more than 34%
15% of total energy is lost due Transmission system
The overall efficiency of an ICV is more of less 25%.
The overall efficiency of an ICV is around 25%. That means we have only 25 kwh of useful
power out of 100 kwh power. This is a huge power loss in the ICVs. This huge power loss occurs due
to a lot of mechanical parts sliding or moving inside the engine. The engines mechanical loss is around
20% of total energy [7].
2.4. Performance and efficiency of EV:
AC grid transmission efficiency is 90%
AC to DC conversion + battery charge efficiency is 85%
Power electronic motor is 90%efficient.
Overall efficiency is around 69%
So the overall efficiency of an electric car is mostly around 70%. That means if we have 100 kwh
power on the electricity then we can use 70 kwh on the wheels.
This efficiency is much higher than the conventional ICV but gasoline has much more energy density
than the batteries. Gasoline contains more than 12 kwh power per kg of fuel burning. And the batteries
have mostly 240 wh power per kg of lithium that is the battery packs are very large and weighty. For
bigger battery we add more weight on EV [8].
4ICAMEI 2021 IOP Publishing
IOP Conf. Series: Materials Science and Engineering 1080 (2021) 012003 doi:10.1088/1757-899X/1080/1/012003
2.5. CO2 emission per year for both the cars
For an Indian car annually runs average around 12000km, mostly runs around 15000km. Let’s
consider the 15000km and this value is really helpful for us during compare the both cars.
ICV: For running of 15000 km that car needs to burn 833.34 lit of diesel (mileage consider as 18
kmpl). Fuel Production phase for 833.34 lit diesel purification we need 883.34 kw power that
generates 503.5 kg CO2 (833.34*0.57*1.06). During running: for burning 833.34 lit diesel CO2 emits
around 2233.35 kg CO2 per year (833.34*2.68).
TOTAL CO2 EMISSION= [total CO2 emission per year is =fuel production +during running the car]
=503.5*y+2233.35*Y [y is the time constant, represent the number of year]
=2736.85*Y kg of CO2 emits per year running the car.
EV: For running of 15000 km that car needs to charge 48 times (considering 312 km range of this car
for a single charge) [15000/312=48].
Charging the battery is 30.2 kwh battery for 48 times recharging needs total power of around 1452
kwh. During charge the total amount of CO2 emission is around 1076 kg (1452*0.57*1.3).
During Battery production: For production 30.2kwh battery emits 5345.4 kg CO2 (30.2*177).
Total CO2 emission= [during charge per year + battery production]
=1076*Y+5345.4 kg CO2.
In order to compare the CO2 emission for a single year simply put Y =1 and we get that the CO2
emission for EV is much higher than ICV because the high CO2 emission of production of battery.
But when you put Y=more than 3 then we get the EV emits less CO2 then ICV that is notable point.
Above equations simply said that after 3 years of using, your EV emits less CO2 then ICV, because the
CO2 emission during battery production is very high.
Figure 3: CO2 emission for ICV and EV
5ICAMEI 2021 IOP Publishing
IOP Conf. Series: Materials Science and Engineering 1080 (2021) 012003 doi:10.1088/1757-899X/1080/1/012003
Form Fig.3 it has been observed that the total 4 years of using both the cars the EV is starts to move
on to the GV, for more larger battery it takes more than 6 to 7 years to make it eco-friendly. But
ultimately the life cars are not more than 8 years.
3. Conclusion
In this study it has been concludes that the actual CO2 emission of a conventional ICV and an EV
through its production of life time using, CO2 for an EV is depends upon not only the power sources
but also the battery production. Perceptibly the source of power generation played a big role. If we
move on to the renewable energy sources the CO2 emission is reduces and it will take lesser time to
make it eco-friendly.
References:
[1] Kumar, A. Rakesh, Padmanaban, S., (Apr-Jun 2019), “Electric Vehicles for India: Overview and
Chalanges”, IEEE India Info. vol. 14, no.2.
[2] Sustainability Report by Tata Motors, (sustainability-report-2016-17.pdf), Online:
“https://www.tatamotors.com”/wp-content/uploads/2015/10/06100728/tml.
[3] Sharma, R.; Manzie, C.; Bessede, M.; Crawford, R.H.; Brear, M.J., (2013), “Conventional, hybrid
and electric vehicles for Australian driving conditions. Part 2: Life cycle CO2 -e emissions”.
Transport. Res. C Emerg. Technol., vol.28, pp. 63–73.
[4] Peters, J.F.; Baumann, M.; Zimmermann, B.; Braun, J.; Weil, M., (2016), “The environmental
impact of Li-Ion batteries and the role of key parameters—A review”. Renew. Sustain. Energy Rev.
vol. 67, pp. 491–506.
[5] Samundeswari , R., Vanitha, S., (November 2019), “A STUDY ON INDIAN POWER SECTOR”,
Conference: Trends and Perspectives in Management Research.
[6] “Vehicle-Grid Integration A global overview of opportunities and issues” – NREL
[7] Alghatgi GT., (2014), “The outlook for fuels for internal combus-tion engines”. Int J Engine Res,
vol. 15, pp. 383–198
[8] Gulhane; Vidyadhar , Tarambale; M. R., Nerkar ;Y P., (2006), “A Scope for the Research and
Development Activities on Electric Vehicle Technology in Pune City”, IEEE Conference on Electric
and Hybrid Vehicles.
6You can also read