Factual Studies on Managed Futures Interaction with Stocks
←
→
Page content transcription
If your browser does not render page correctly, please read the page content below

Factual Studies on Managed
        Futures Interaction with Stocks

Trading futures and options involves substantial risk of loss and is not suitable for all investors. The use of the
phrase “Managed Futures” refers to the asset class, and not to any individual Commodity Trading Advisors
program. Be advised that an individual program could have better or worse performance results when compared
to the Stock Market. There are no guarantees of profit no matter who is managing your money. Past performance
is not necessarily indicative of future results. The studies presented in this brochure are based on actual
performance of managed futures and stocks for the periods shown, they are not based on academic theory. This
matter is intended as a solicitation.

                                                                                                               HRF1168
The Growth of the Managed Futures Industry

          In the last 20 years, assets under management
           for the managed futures industry have grown
               approximately an unprecedented 740%

According to the CME Group, “Managed futures have been used successfully by investment management
professionals for more than 30 years. Institutional investors looking to maximize portfolio exposure continue to
increase their use of managed futures as an integral component of a well diversified portfolio. With the ability to
go both long and short, managed futures are highly flexible financial instruments with the potential to profit from
rising and falling markets. Moreover, managed future funds have virtually no correlation to traditional asset
classes, enabling them to enhance returns as well as lower overall volatility.

Recent growth in managed futures has been substantial. In 2000, it was estimated that there was $37.90
billion was under management by managed futures trading advisors. By the end of the fourth quarter of 2019,
that number had grown to more than $318.4 billion.

Why are managed futures so popular with investors? According to Sol Waksman, founder and President of
BarclayHedge the current growth in managed futures assets has been more closely aligned with changing
sentiment among sophisticated investors, who are now seeking transparency, liquidity and lower downside
volatility within their portfolios all of which managed futures can potentially provide.

Please be advised that trading futures and options involves substantial risk of loss and is not suitable for all
investors. There are no guarantees of profit no matter who is managing your money. An investor must read and
understand the current disclosure document before investing. Past performance is not necessarily indicative of
future results.

                                                                                                                      1
StudY Showing How Managed Futures
  Performed When Stocks Performed
              Poorly

                                    2
CTA Return During Periods When the S&P 500 Lost
More Than 10% in a Quarter (from JAN. 1990 - MAR. 2020)

  The chart above demonstrates how the Autumn Gold CTA Index performed during periods when the S&P 500 TR Index
  experienced quarterly losses greater than 10%. The period covered is from January 1990 to March 2020. Note how in
  the twelve periods shown, Managed Futures was positive nine times while the S&P 500 was negative. In the three
  periods that Managed Futures was negative along with the S&P 500, losses were seven to ten times less. The
  Autumn Gold CTA Index reflects the average performance of Commodity Trading Advisors (CTAs) reporting to the Autumn
  Gold Database. The chart demonstrates that the Autumn Gold CTA index produced above average quarterly returns
  during periods when the S&P 500 TR Index incurred quarterly losses in excess of 10%. In every instance from 1990-
  March 2020, when the S&P 500 Price Index incurred these losses, the Autumn Gold CTA index produced positive return
  or minimal losses.

  Managed Futures are represented by the Autumn Gold CTA Index. The Autumn Gold CTA Index is comprised of the client
  performance of all CTA programs included in the AG database and does not represent the complete universe of CTAs.
  CTA programs with proprietary performance are not included. Monthly numbers are updated until 45 days after the end of
  the month.

  S&P 500 TR Index - The S&P 500 indices are designed to reflect all sectors of the U.S. equity markets. The S&P 500
  includes 500 blue chip, large cap stocks, which together represent about 75% of the total U.S. equities market.
  Companies eligible for addition to the S&P 500 have market capitalization of at least US$3.5 billion. The TR Index
  accounts for the reinvestment of dividends.

  Trading futures and options involves substantial risk of loss and is not suitable for all investors. An individual must read
  and understand the Commodity Trading Advisors current disclosure document before investing. Past performance is not
  necessarily indicative of future results.

  The addition of managed futures to a client’s portfolio does not mean that a portfolio will be profitable or that it will not
  experience substantial losses and that the studies conducted in the past may not be indicative of current time periods or
  of the performance of any individual CTA.

  An individual cannot invest in the index itself and performance of an individual program may differ and be more volatile
  than the index.

  Source: Autumn Gold
                                                                                                                                  3
StudY Showing How STOCKS, CTAS, AND A
 COMBINED PORTFOLIO OF STOCKS AND CTAS
PERFORMED DURING LOSING PERIODS FOR THE
         S&P OF MORE THAN 10%

                                          4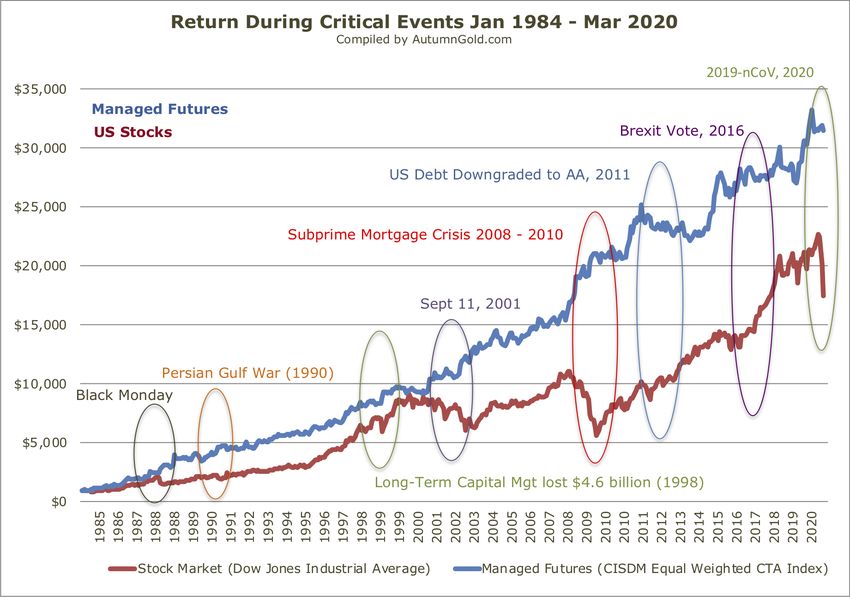
COMBINED RETURNS DURING PERIODS WHEN THE S&P LOST
MORE THAN 10% IN A QUARTER (from JAN. 1990 - MAR. 2020)

In all periods shown, the inclusion of allocating 30% of the portfolio to Managed Futures could have reduced
losses and increased performance in the combined portfolio of 70% stocks and 30% Managed Futures.

Managed Futures are represented by the Autumn Gold CTA Index. The Autumn Gold CTA Index is comprised
of the client performance of all CTA programs included in the AG database and does not represent the
complete universe of CTAs. CTA programs with proprietary performance are not included. Monthly numbers
are updated until 45 days after the end of the month.

S&P 500 TR Index - The S&P 500 indices are designed to reflect all sectors of the U.S. equity markets. The
S&P 500 includes 500 blue chip, large cap stocks, which together represent about 75% of the total U.S.
equities market. Companies eligible for addition to the S&P 500 have market capitalization of at least US$3.5
billion. The TR Index accounts for the reinvestment of dividends.

Trading futures and options involves substantial risk of loss and is not suitable for all investors. An individual
must read and understand the Commodity Trading Advisors current disclosure document before investing.
Past performance is not necessarily indicative of future results.

The addition of managed futures to a client’s portfolio does not mean that a portfolio will be profitable or that
it will not experience substantial losses and that the studies conducted in the past may not be indicative of
current time periods or of the performance of any individual CTA.

An individual cannot invest in the index itself and performance of an individual program may differ and be
more volatile than the index.

Source: Autumn Gold

                                                                                                                     5
How Did Managed Futures Perform
During Critical Events from January
     1984 through MARCH 2020?

                                      6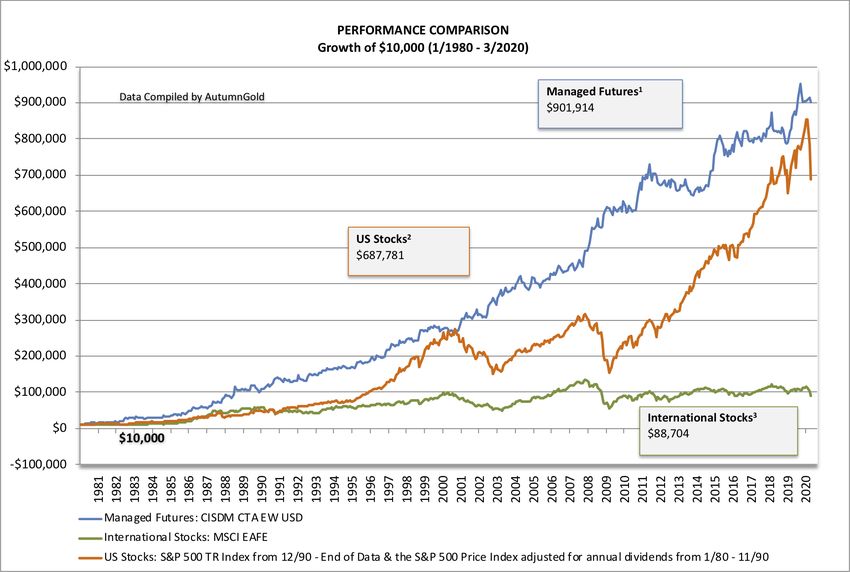
Return During Critical Events
                                January 1984 - MARCH 2020

The addition of managed futures to a client’s portfolio does not mean that a portfolio will be profitable or that it will not experience substantial
losses and that the studies conducted in the past may not be indicative of current time periods or of the performance of any individual CTA.

The Dow Jones Industrial Average is a price-weighted average of 30 blue-chip stocks that are generally the leaders in their industry. It has been
a widely followed indicator of the stock market since October 1, 1928.

The CISDM Equal Weighted CTA Index is an equal weighted index of CTAs maintained by The Center for International Securities and
Derivatives Markets at the University of Massachusetts Amherst. It reflects the average performance of Commodity Trading Advisors reporting
to the CISDM Hedge Fund/CTA Database. Each CTA must have at least $500,000 under management and at least a 12-month track record.
The CISDM CTA Index is a continuation of the earlier MAR Index which was sold to Zurich Capital Markets in 2001 and was gifted by Zurich to
the University of Massachusetts in 2002 and renamed the CISDM Indices.

PAST PERFORMANCE IS NOT NECESSARILY INDICATIVE OF FUTURE RESULTS.

THE RISK OF TRADING COMMODITY FUTURES, OPTIONS AND FOREIGN EXCHANGE (“FOREX”) IS SUBSTANTIAL. THE HIGH
DEGREE OF LEVERAGE ASSOCIATED WITH COMMODITY FUTURES, OPTIONS AND FOREX CAN WORK AGAINST YOU AS WELL
AS FOR YOU. THIS HIGH DEGREE OF LEVERAGE CAN RESULT IN SUBSTANTIAL LOSSES, AS WELL AS GAINS. YOU SHOULD
CAREFULLY CONSIDER WHETHER COMMODITY FUTURES, OPTIONS AND FOREX IS SUITABLE FOR YOU IN LIGHT OF YOUR
FINANCIAL CONDITION. IF YOU ARE UNSURE YOU SHOULD SEEK PROFESSIONAL ADVICE. PAST PERFORMANCE DOES NOT
GUARANTEE FUTURE SUCCESS. IN SOME CASES MANAGED ACCOUNTS ARE CHARGED SUBSTANTIAL COMMISSIONS AND
ADVISORY FEES. THOSE ACCOUNTS SUBJECT TO THESE CHARGES MAY NEED TO MAKE SUBSTANTIAL TRADING PROFITS JUST
TO AVOID DEPLETION OF THEIR ASSETS. EACH COMMODITY TRADING ADVISOR (“CTA”) IS REQUIRED BY THE COMMODITY
FUTURES TRADING COMMISSION (“CFTC”) TO ISSUE TO PROSPECTIVE CLIENTS A RISK DISCLOSURE DOCUMENT OUTLINING
THESE FEES, CONFLICTS OF INTEREST AND OTHER ASSOCIATED RISKS. THE FULL RISK OF COMMODITY FUTURES, OPTIONS
AND FOREX TRADING CANNOT BE ADDRESSED IN THIS RISK DISCLOSURE STATEMENT. NO CONSIDERATION TO INVEST SHOULD
BE MADE WITHOUT THOROUGHLY READING THE DISCLOSURE DOCUMENT OF EACH OF THE CTAS IN WHICH YOU MAY HAVE AN
INTEREST. REQUESTING A DISCLOSURE DOCUMENT PLACES YOU UNDER NO OBLIGATION AND EACH DOCUMENT IS PROVIDED
AT NO COST. THE CFTC HAS NOT PASSED UPON THE MERITS OF PARTICIPATING IN ANY OF THE FOLLOWING PROGRAMS NOR ON
THE ADEQUACY OR ACCURACY OF THE DISCLOSURE DOCUMENTS. OTHER DISCLOSURE STATEMENTS ARE REQUIRED TO BE
PROVIDED TO YOU BEFORE AN ACCOUNT MAY BE OPENED FOR YOU.

THIS MATERIAL MENTIONS SERVICES WHICH RANK THE PERFORMANCE OF COMMODITY TRADING ADVISORS. PLEASE NOTE
THAT THE RANKINGS APPLY ONLY TO THOSE CTAs WHO SUBMIT THEIR TRADING RESULTS. THE RANKINGS IN NO WAY PURPORT
TO BE REPRESENTATIVE OF THE ENTIRE UNIVERSE OF COMMODITY TRADING ADVISORS. THE MATERIAL IN NO WAY IMPLIES
THAT THESE RESULTS ARE OFFICIALLY SANCTIONED RESULTS OF THE COMMODITY INDUSTRY. BE ADVISED THAT AN INDIVIDUAL
CANNOT INVEST IN THE INDEX ITSELF AND THE ACTUAL RATES OF RETURN FOR AN INDIVIDUAL PROGRAM MAY SIGNIFICANTLY
DIFFER AND BE MORE VOLATILE THAN THE INDEX.
                                                                                                                                                       7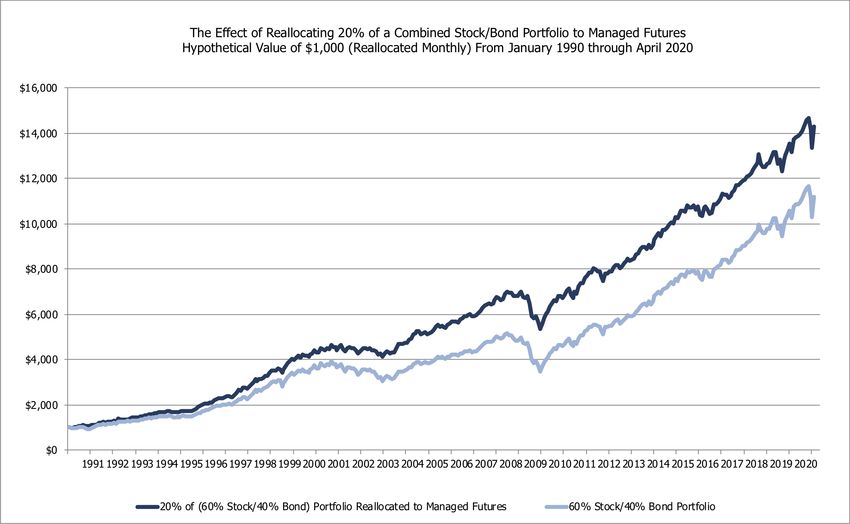
StudY Showing EFFECT OF ALLOCATING 20%
TO MANAGED FUTURES IN A STOCK AND BOND
             PORTFOLIO

                                         8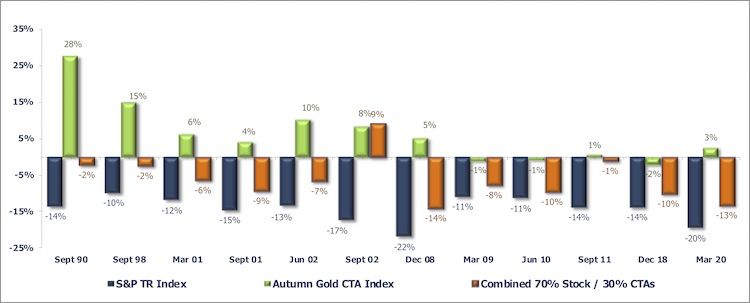
THE EFFECT OF REALLOCATING 20% OF A TRADITIONAL
      STOCK/BOND PORTFOLIO TO MANAGED FUTURES
                                    (from JAN. 1990 - APR. 2020)

Managed Futures are represented by the Autumn Gold CTA Index. The Autumn Gold CTA Index is comprised of the client performance of
all CTA programs included in the AG database and does not represent the complete universe of CTAs. CTA programs with proprietary
performance are not included. Monthly numbers are updated until 45 days after the end of the month.

Note how the portfolio including 20% Managed Futures could have increased performance by 28.2% ($14,300 vs. $11,100).

S&P 500 TR Index - The S&P 500 indices are designed to reflect all sectors of the U.S. equity markets. The S&P 500 includes 500 blue
chip, large cap stocks, which together represent about 75% of the total U.S. equities market. Companies eligible for addition to the S&P
500 have market capitalization of at least US$3.5 billion. The TR Index accounts for the reinvestment of dividends.

Trading futures and options involves substantial risk of loss and is not suitable for all investors. An individual must read and understand
the Commodity Trading Advisors current disclosure document before investing. Past performance is not necessarily indicative of future
results.

The addition of managed futures to a client’s portfolio does not mean that a portfolio will be profitable or that it will not experience
substantial losses and that the studies conducted in the past may not be indicative of current time periods or of the performance of any
individual CTA.

An individual cannot invest in the index itself and performance of an individual program may differ and be more volatile than the index.

Bonds are represented by the Barclay's US Aggregate Bond Index (formerly known as the Lehman US Aggregate Bond Index). The U.S.
Aggregate Bond Index is a broad-based benchmark that measures the investment grade, U.S. dollar-denominated, fixed-rate taxable
bond market, including Treasuries, government-related and corporate securities, MBS (agency fixed-rate and hybrid ARM pass-
throughs), ABS, and CMBS. The U.S. Aggregate rolls up into other Barclays Capital flagship indices such as the multi-currency Global
Aggregate Index and the U.S. Universal Index, which includes high yield and emerging markets debt. The U.S. Aggregate Index was
created in 1986, with index history backfilled to January 1, 1976.
                                                                                                                                              9
Source: Autumn Gold
Studies Showing How Managed Futures
Performed Compared to Stocks Over
the Past 40 Years
10Performance Results of a 40 Year STudy
Comparing Managed Futures*, U.S. Stocks and
International Stocks (FROM JAN. 1980 - MAR. 2020)
Comparison of Performance (1/1980 - 3/2020)
Past performance is not necessarily indicative of future results.
Over the past 40 years, managed futures have substantially outperformed U.S. Stocks by 30.4% and International Stocks by
818%.
1- Managed Futures: The CISDM Equal Weighted CTA Index is an equal weighted index of CTAs maintained by The Center for
International Securities and Derivatives Markets at the University of Massachusetts Amherst. It reflects the average performance of
Commodity Trading Advisors reporting to the CISDM Hedge Fund/CTA Database. Each CTA must have at least $500,000 under
management and at least a 12-month track record. The CISDM CTA Index is a continuation of the earlier MAR Index which was sold to
Zurich Capital Markets in 2001 and was gifted by Zurich to the University of Massachusetts in 2002 and renamed the CISDM Indices.
2- US Stocks: The S&P 500 Total Return Index from December 1990 to the end of Data and the S&P 500 Price Index is adjusted for
dividends from January 1990 through November 1990. The S&P 500 indices are designed to reflect all sectors of the U.S. equity
markets. The S&P 500 includes 500 blue chip, large cap stocks, which together represent about 75% of the total U.S. equities market.
Companies eligible for addition to the S&P 500 have market capitalization of at least US$3.5 billion. The TR Index accounts for the
reinvestment of dividends.
3- International Stocks: The MSCI EAFE Index is a stock market index that is designed to measure the equity market performance of
22 major developed markets excluding the US & Canada.
Source: Autumn Gold
*THIS MATERIAL MENTIONS SERVICES WHICH RANK THE PERFORMANCE OF COMMODITY TRADING ADVISORS. PLEASE NOTE THAT THE
RANKINGS APPLY ONLY TO THOSE CTAS WHO SUBMIT THEIR TRADING RESULTS. THE RANKINGS IN NO WAY PURPORT TO BE
REPRESENTATIVE OF THE ENTIRE UNIVERSE OF COMMODITY TRADING ADVISORS. THE MATERIAL IN NO WAY IMPLIES THAT THESE
RESULTS ARE OFFICIALLY SANCTIONED RESULTS OF THE COMMODITY INDUSTRY. BE ADVISED THAT AN INDIVIDUAL CANNOT INVEST IN
THE INDEX ITSELF AND THE ACTUAL RATES OF RETURN FOR AN INDIVIDUAL PROGRAM MAY SIGNIFICANTLY DIFFER AND BE MORE
VOLATILE THAN THE INDEX.
Trading futures and options involves substantial risk of loss no matter who is managing your money. Such and investment is not suitable for all
investors. Past performance is not necessarily indicative of future results.
11
The addition of managed futures to a client’s portfolio does not mean that a portfolio will be profitable or that it will not experience substantial losses
and that the studies conducted in the past may not be indicative of current time periods or of the performance of any individual CTA.You can also read