Can Economic Factors Improve Momentum Trading Strategies? The Case of Managed Futures during the COVID-19 Pandemic - MDPI
←
→
Page content transcription
If your browser does not render page correctly, please read the page content below
economies
Article
Can Economic Factors Improve Momentum Trading Strategies?
The Case of Managed Futures during the COVID-19 Pandemic
Renata Guobužaitė                and Deimantė Teresienė *

                                          Finance Department, Faculty of Economics and Business Administration, Vilnius University, LT-10223 Vilnius,
                                          Lithuania; renata.guobuzaite@evaf.stud.vu.lt
                                          * Correspondence: deimante.teresiene@evaf.vu.lt

                                          Abstract: Systematic momentum trading is a prevalent risk premium strategy in different portfolios.
                                          This paper focuses on the performance of the managed futures strategy based on the momentum
                                          signal across different economic regimes, focusing on the COVID-19 pandemic period. COVID-
                                          19 had a solid but short-lived impact on financial markets, and therefore gives a unique insight
                                          into momentum strategies’ performance during such critical moments of market stress. We offer a
                                          new approach to implementing momentum strategies by adding macroeconomic variables to the
                                          model. We test a managed futures strategy’s performance with a well-diversified futures portfolio
                                          across different asset classes. The research concludes that constructing a portfolio based on academi-
                                          cally/economically sound momentum signals with its allocation timing based on broader economic
                                          factors significantly improves managed futures strategies and adds significant diversification benefits
                                          to the investors’ portfolios.


                                          Keywords: backwardation; economic regimes; momentum strategy; systematic trading
Citation: Guobužaitė, Renata, and
Deimantė Teresienė. 2021. Can
Economic Factors Improve
Momentum Trading Strategies? The          1. Introduction
Case of Managed Futures during the
COVID-19 Pandemic. Economies 9:
                                                From difficult lessons learned in 2008, the traditional “suspects” in institutional in-
86. https://doi.org/10.3390/
                                          vestors’ portfolios (i.e., equity, fixed income) face a significant problem. In a period of
economies9020086
                                          crisis, their prices tend to move together. Therefore, opportunities to diversify the portfolio
                                          become very limited. As investors seek to diversify into other asset classes, many turn
Academic Editor: Wing-Keung Wong          to alternative assets as a solution, with managed futures strategies firmly in focus. In
                                          this study, we test the performance of managed futures strategies based on a theoretically
Received: 6 March 2021                    proven momentum effect across different asset classes. This research aims to identify if
Accepted: 26 May 2021                     the construction of a portfolio, based on academically/economically sound momentum
Published: 28 May 2021                    signals, and its allocation timing based on broader economic factors, can significantly
                                          improve the performance of managed futures strategies and add significant diversification
Publisher’s Note: MDPI stays neutral      to investors’ portfolios. The particular focus is placed on the recent COVID-19 period as a
with regard to jurisdictional claims in   natural experiment of increased market uncertainty.
published maps and institutional affil-         The managed futures are a sub-class of alternative investment strategies that take
iations.                                  long/short positions across various futures markets (commodity, equity indices, foreign
                                          currency, bonds) globally. Some studies showed that tactical trading in futures markets had
                                          generated abnormal returns in the past (Gorton and Rouwenhorst 2006; Erb and Harvey
                                          2006; Shen et al. 2007; Fuertes et al. 2010; Szymanowska et al. 2014). However, considering
Copyright: © 2021 by the authors.         that managed futures strategies only trade in financial instruments listed on the exchanges,
Licensee MDPI, Basel, Switzerland.        their positions are transparent, highly liquid (exchange trading, no asymmetry between
This article is an open access article    short/long positions), with the minimum counterparty or credit risk. Thus, such strategies
distributed under the terms and           offer access to leverage, high liquidity, low transaction costs, and complete transparency.
conditions of the Creative Commons        The studies also suggest that managed futures have performed exceptionally well during
Attribution (CC BY) license (https://     down markets and still delivered positive results during the up periods in equity markets.
creativecommons.org/licenses/by/
4.0/).

Economies 2021, 9, 86. https://doi.org/10.3390/economies9020086                                          https://www.mdpi.com/journal/economies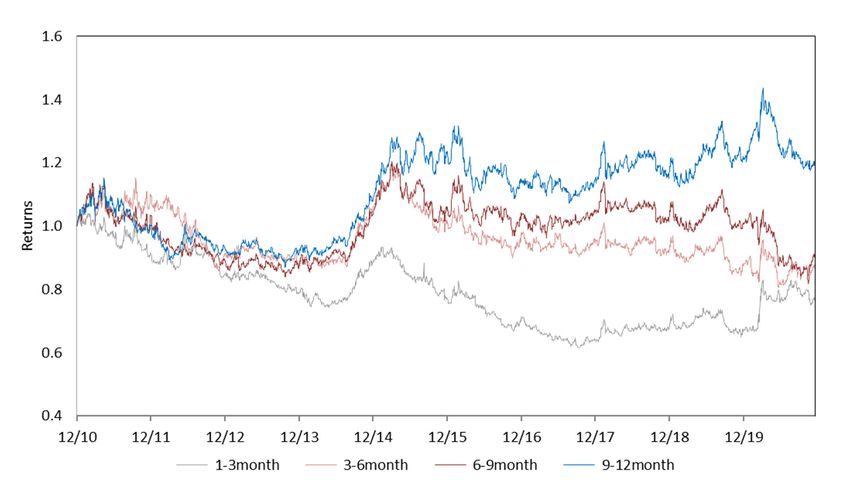
Economies 2021, 9, 86                                                                                          2 of 16

                              Systematic momentum trading is a very popular risk premium strategy in different
                        portfolios, where, according to a BarclayHedge report (2020), more than 70% of managed
                        futures funds are estimated to follow momentum signals.
                              In this study, we selected to test the performance of managed futures strategies based
                        on a theoretically proven momentum effect across various (i.e., equity index, foreign
                        exchange, bonds, and commodity futures) markets. Our contribution to the current stream
                        of literature on momentum strategies is twofold: (1) we estimate, compare, and analyze
                        strategies based on long- and short-term momentum signals, respectively; (2) we offer a
                        new approach to implementing momentum strategies by adding macroeconomic variables
                        to the analysis. Our theoretical model for estimating a momentum strategy’s returns is
                        based on Elaut and Erdős’s (2019) proposed asset-based factor that aggregates time-series
                        momentum signals over different time horizons. Due to this model flexibility, it is possible
                        to construct a momentum portfolio strategy with the selected lookback period length.
                        Therefore, we can separate the momentum signal into “short-term” and “long-term” effects
                        and separately assess their impact on portfolio performance. Furthermore, considering that
                        the momentum strategy is highly dynamic and depends on the broader market, we also add
                        some macroeconomic indicators to the model. To distinguish between different economic
                        states, we use the Markov regime-switching model and test for the existence of one, two,
                        and three different market states. Furthermore, we use an economic sentiment indicator
                        (ESI) series available from Eurostat to confirm periods of economic recession and add the
                        VIX index series to measure the increased uncertainty in the market. In addition, we assess
                        the benefits of adding a managed futures’ exposure to institutional investors’ portfolios. A
                        “traditional” institutional portfolio, in this case, is approximated by a 60% investment in
                        equity and 40% in fixed income; then, considering this portfolio as a benchmark, we test
                        what effect an increasing managed futures’ position has on the overall performance of the
                        portfolio.
                              We thoroughly compare the results across the portfolios and find that separating
                        “short-term” and “long-term” momentum effects as two distinct factors in portfolio con-
                        struction adds value by increasing returns and reducing the standard deviation of returns.
                        We agree with Barroso and Santa-Clara (2012) that momentum strategies can increase the
                        profitability and Sharpe ratio of a portfolio. Given their performance, the “long-term”
                        momentum seems to capture a general trend in the market, and “short-term” momen-
                        tum refers to the reversal effect due to market overreaction, liquidity, or trading issues.
                        The results also show that the performance of each factor largely depends on the general
                        economic conditions. Therefore, market timing is an essential component of a successful
                        momentum strategy and can positively affect both risks and return on the portfolio. As
                        expected, portfolios with combined long exposure to both “long-term” and “short-term”
                        momentum factors performed exceptionally well during the COVID-19 financial crisis and
                        can be considered a hedging instrument for improving the overall portfolio’s performance
                        during periods of financial distress.
                              In summary, our paper focuses on the performance of the managed futures strategy
                        based on two “long-term” and “short-term” momentum signals across different economic
                        regimes, with a particular focus on the COVID-19 pandemic period. The performance
                        of each of the momentum series largely depends on the general economic conditions of
                        the market. We offer a new approach to momentum strategies because we found that the
                        momentum strategy’s performance could be improved if broader macroeconomic variables
                        were added to the analysis. We also address the critical characteristics of momentum
                        strategies that can benefit institutional investors and highlight the potential advantages of
                        including managed futures in a diversified portfolio. In particular, managed futures can be
                        helpful as a hedging tool during a financial crisis.
                              The rest of the paper is organized as follows. Firstly, we discuss the main theoretical
                        issues and academic literature related to managed futures portfolio management strategies.
                        Secondly, we present the methodologies used and give our insights on each topic. We
                        also add Markov regime-switching model to identify different types of decisions required,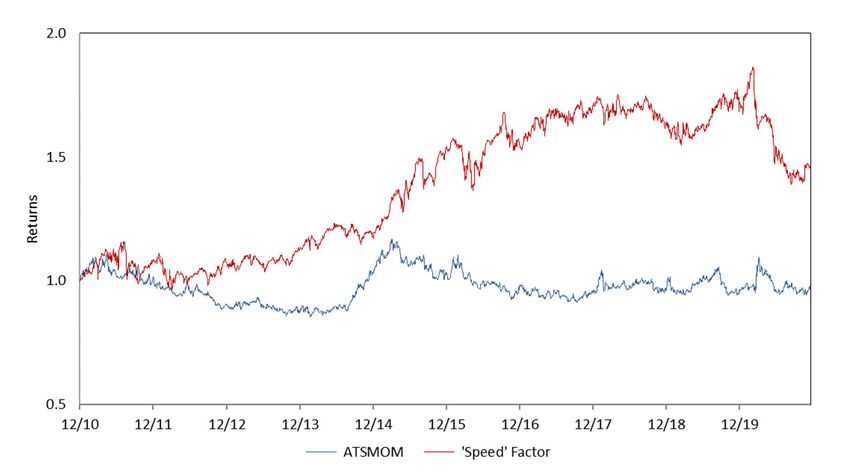
Economies 2021, 9, 86                                                                                             3 of 16

                        depending on the economic cycle. Finally, we present our results, discuss the main findings,
                        and conclude.

                        2. Literature Review
                              The presence of profound economic reasons is a comforting indicator of the robustness
                        of the expected managed futures’ returns. Keynes (1930) explained two types of partici-
                        pants in futures markets: hedgers and speculators. The hedgers (producers and issuers)
                        buy insurance for a price risk and pay a premium to the market. Speculators (traders
                        and investors) assume price risk, provide liquidity, and are rewarded by collecting this
                        insurance premium.
                              In more recent studies, the risk premium can be modeled via different observable
                        factors in futures markets. Two major factors discussed in academic literature include
                        momentum (Erb and Harvey 2006; Miffre and Rallis 2007; Shen et al. 2007; Szakmary
                        et al. 2010; Moskowitz et al. 2012) and the slope of a futures’ term-structure (Erb and
                        Harvey 2006; Gorton and Rouwenhorst 2006; Fuertes et al. 2010). The momentum strategy
                        attempts to capture significant directional moves across a diversified portfolio of assets.
                        The model that generates buy or sell signals can be as straightforward as a price-moving
                        average or exiting the price channel. The term structure strategy exploits the signals from a
                        managed futures’ price curve—it buys most backwardated contracts (with a downward
                        sloping term structure) and shorts most contangoed ones (with an upward-sloping term
                        structure). Some alternative strategies can also be based on other factors such as value
                        (Asness et al. 2013), market volatility (Frazzini and Pedersen 2014), liquidity/open interest
                        (Szymanowska et al. 2014), inflation (Erb and Harvey 2006), skewness (Fernández-Pérez
                        et al. 2015), and idiosyncratic risk (Miffre et al. 2015).
                              Another part of the research tries to combine different strategies, including momentum.
                        Baz et al. (2015) made an analysis using three different strategies: carry, momentum, and
                        value using different ways of implementation (directional and cross-asset). Bender et al.
                        (2013) focused on factor investing, stressing that value, low size, and momentum strategies
                        traditionally offered excess long-term returns. Those authors expanded the group of
                        systematic factors and conducted research with MSCI indices. Momentum strategies
                        were analyzed by Chabot et al. (2008); Chabot et al. (2014); Campbell (2004); Vogel
                        and Gray (2015); Elias et al. (2014); Foltice and Langer (2015); Hong and Stein (1998);
                        Hurst et al. (2014); Yu and Chen (2012); Krauss et al. (2015); Martin (2021); Martins
                        et al. (2016); Menkhoff et al. (2012); Roncalli (2017); (Shen et al. 2007); and Tauseef and
                        Nishat (2018). Some authors even focused on modern machine learning ranking algorithms
                        for cross-sectional momentum strategies (Poh et al. 2020). Fong et al. (2005) analyzed
                        international momentum strategies using a stochastic dominance approach and identified
                        that momentum could be found globally. However, models considering investors’ mood
                        are non-satiated, and that risk-averse models could not explain momentum.
                              Our study focuses on the time-series momentum factor that was first introduced by
                        Moskowitz et al. (2012). Their paper offers one of the most comprehensive time-series
                        momentum studies across various futures markets (equity index, commodity, foreign
                        exchange, and fixed income). Baltas and Kosowski (2012) contribute by suggesting several
                        alternative estimates for a time series momentum: return sign, moving average, trend ex-
                        traction, time-series t-statistics, and statistically meaningful trend, with the last alternative
                        being referred to as the most efficient. We use the model proposed by Elaut and Erdős
                        (2019), which is based on Moskowitz et al. (2012), and allow for estimating and comparing
                        time-series momentum signals over selected lookback periods.
                              Because of significant returns and a low correlation with traditional asset classes,
                        managed futures can also be successfully used for strategic asset allocation (Jensen et al.
                        2000; Erb and Harvey 2006). In her paper, Kaminski (2016) notes that managed futures
                        seem to be an excellent instrument for risk hedging during a financial crisis. For example,
                        in the 2018 financial crisis, managed futures benefited from the distressed market and were
                        recorded as the most profitable investment category. We also test this property by assessing
Economies 2021, 9, 86 4 of 16
the impact of adding a managed futures momentum exposure to the broader portfolio
performance.
3. Methodology
For an investment strategy to be sustainable over a more extended period, there
must be an underlying structural property in the market for a risk premium to exist and
conditions for the trading strategy to capture it. Till (2016) suggests that there are some
solid, economically grounded reasons for consistent returns in futures’ markets to exist
due to:
• Momentum;
• Term-structure; and
• Portfolio rebalancing.
Momentum is simply a “bet” that the past performance contains valuable informa-
tion for estimating expected returns in the future. Indeed, securities with high average
returns in the past can outperform equities with the worst performance up to 12 months
ahead. Erb and Harvey (2006), Gorton and Rouwenhorst (2006), and Miffre and Ral-
lis (2007) confirm that the momentum strategy works well in the futures markets. A
momentum portfolio systematically longs futures with the best performance and shorts
futures with the worst performance in these studies. This momentum estimate is typically
referred to as a cross-sectional momentum, as it picks the best- and worst-performing
contracts out of a cross-section of selected futures. An alternative method is a time-series
momentum (Szakmary et al. 2010; Moskowitz et al. 2012). It focuses on each futures’ past
returns—buys if its past performance is positive and sells if the performance is negative.
An aggregated time-series momentum strategy is, then, a weighted portfolio of these
individual positions. This method allows for easy comparison and use of various asset
classes with very different return distributions.
The term-structure of individual futures’ contracts can also be considered a structural
source of returns, especially over a more extended period. It is specific to the futures market,
as a futures contract price today is paid for delivering an underlying asset at a pre-specified
date in the future. When a futures’ contract trades at a discount to a spot price, we call this
futures’ price curve slope a backwardation, and when a deferred futures’ contract trades at
a premium to a spot price, we refer to it as a contango. As maturity approaches, the futures’
price of a backwardated (contangoed) contract is expected to increase (decrease) towards
the expected spot price, enabling long (short) speculators to earn positive returns (Erb and
Harvey 2006; Gorton and Rouwenhorst 2006; Gorton et al. 2013). Feldman and Till (2006)
show that the deeper the futures market is in backwardation (or contango), the stronger
the performance. When the futures’ contract is in backwardation, an investor faces two
potential return sources: an increase in the futures’ price and a positive “roll-yield”. Even
if the spot price starts declining, an investor can still profit from a so-called “roll-yield”.
As the futures’ contact maturity approaches, an investor needs to roll his/her near-term
expiring futures’ contracts into contracts with expiration dates further in the future to
keep his/her positions open. In backwardation, the “roll-yield” (i.e., a price difference
between the nearby contract that is closed and a more distant contract that is rolled into) is
expected to be positive. However, if the market is in contango, rolling the long positions
can negatively affect “roll-yields” and have a very damaging effect on total returns.
Portfolio rebalancing is the third structural source of return (Till 2016; Bakshi et al.
2019). The studies show meaningful returns from rebalancing portfolios of low-correlated,
mean-reverting, high volatility investments, such as futures contracts. A rebalancing return
can be accrued from periodically resetting the portfolio to its initial (often, equal) weights
that cause an investor to frequently sell assets that have gone up and sell assets that have
declined in value. Erb and Harvey (2006) and Sanders and Irwin (2012) have empirically
confirmed that portfolio rebalancing represents a robust source of returns from owning
and rolling a portfolio of futures.Economies 2021, 9, 86 5 of 16
In this study, we test the performance of the managed futures strategy that is based on
momentum effects across various (i.e., equity index, FX, bonds, and commodity) futures
markets. We construct a long/short futures portfolio based on the momentum factor. The
momentum returns are estimated with the Elaut and Erdős (2019) asset-based momentum
factor that aggregates time-series momentum signals over different time horizons. The
strategy is called “adaptive time-series momentum” (ATSMOM), in which the momentum
signal for any given security in the portfolio is averaged over several lookback horizons:
260 I √0.4
1 L ∑ t=10 sgn r T −t,T −1
ATSMOM
r T +1 = ∑ sgn [ I 261 ]r TI +1 (1)
L I =1 251 σT −60,T −1
where sgn is the sign of the two-day lagged return, L is the number of assets in the strategy,
and σ is the two-day lagged, exponentially weighted moving average (EWMA) estimator
of volatility with a 60-day rolling window that can be estimated as follows:
59
σT2 −60,T −1 = (1 − λ) ∑ λt (r T −t−1 − r )2 (2)
t=o
with λ as a decay factor. Similarly to Elaut and Erdős (2019), we use a decay factor of 0.4 as
a way to achieve an ex ante volatility of 40% per security, which can be expected to result
risk factors with an ex post volatility of approximately 12% per year (which represents a
typical CTA target volatility of around 12%).
This model is based on the earlier works of Moskowitz et al. (2012) and Baltas and
Kosowski (2012). The term “time-series momentum” was first introduced by Moskowitz
et al. (2012) who documented a presence of persistent “trend” factors across a broad
range of futures markets. Baltas and Kosowski (2012) later proposed improved volatility
and momentum estimates for this model. In the Moskowitz et al. (2012) paper, the
momentum strategy is called the “time-series momentum” (TSMOM), where the return of
the momentum futures portfolio is calculated as follows:
L √0.4
1 h i
r TTSMOM
+1 =
L ∑ sgn r TI −261,T −1 [ 261
σTI −60,T −1
]r TI +1 (3)
I =1
If we compare the models, Moskowitz et al. (2012) estimate the momentum only as a
binary signal that can be equal to only 1 (“up”) or –1 (“down”). Considering that Elaut and
Erdős (2019) aggregate the time-series momentum signals over several lookback periods,
the momentum can result in any value within the range [−1,1], also referred to as the
strength of this signal. In practice, if the TSMOM is only a sign or direction of a 251-day
trend, the ATSMOM averages a range of TSMOM signals looking backward from 10 to 251
trading days. This new development introduces an opportunity to use Elaut and Erdős’s
(2019) model for quickly estimating and comparing momentum signals based on different
lookback periods.
This study takes a closer look at a time-series strategy’s performance based on two key
separate long- and short- momentum signals. Due to the flexibility of the Elaut and Erdős
(2019) model, it is possible to construct a momentum portfolio strategy with a selected
lookback period length. For this purpose, we define a 1–3 month lookback period as a short-
term momentum and a 9–12 month period as a long-term momentum. Thus, we contribute
to “time-series momentum” research by estimating momentum signals separately for long
and short horizons and further documenting that both signals respond differently to market
conditions changes.
Indeed, each structural source of return’s performance largely depends on a general
situation in the market (Routledge et al. 2000; Koijen et al. 2018; Bakshi et al. 2019). This pa-
per examines the relationship between a selected managed futures strategy’s performance
and the general economic conditions across time and markets. Given the current, rapidlyEconomies 2021, 9, 86 6 of 16
changing market conditions, the market timing is an essential component of each successful
managed futures’ strategy. Hong and Yogo (2012) suggest that managed futures’ returns
vary with time and are predictable from macroeconomic and other specific variables. In
particular, Sakkas and Tessaromatis (2020) relate that market volatility is a key factor for
predicting returns in managed futures portfolios.
We use the Markov regime-switching model based on the S&P 500 time series for the
sample period to distinguish between different economic states. Its performance is closely
related to the general economic conditions. To allow for asymmetric exposure, we test for
the existence of one, two, and three different states. Since the objective is to get an economic
interpretation for managed futures’ strategies, we start testing a three-state system. The test
data is arranged so that state 1 represents an “up” state, state 2 a “down” state, and state 3
is an “intermediate” state in the Markov regime-switching model. To estimate the Markov
regime-switching, we use the MATLAB package provided by Perlin (2015). In addition, we
include an economic sentiment indicator (ESI) series available from Eurostat to confirm
periods of economic recession. We also add the VIX index series as a proxy for future
market uncertainty and conditions (low during expansions and high during recessions). Of
particular interest is the period of the COVID-19 crisis. Contrary to traditional investments,
the managed futures strategies are expected to perform exceptionally well during this
clearly defined period of financial distress.
This paper also analyzes the benefits of adding a managed futures’ exposure to insti-
tutional investors’ portfolios. Considering that a long-term recorded correlation between
futures’ returns and a traditional (i.e., equity and bond) investment portfolio returns are
surprisingly low or even negative, the institutional investors can potentially benefit from
increased risk-adjusted returns and better portfolio resilience by including managed futures
to their portfolio (Lintner 1996). We use our estimated portfolio (based on two short-term
and long-term momentum factors) to represent managed futures investments. A “tradi-
tional” institutional portfolio is approximated by a 60% long position in the S&P 500 Index
and a 40% long position Bloomberg Barclays US Aggregate Bond Index. We construct
several portfolios with different (increasing) allocations to a managed futures’ exposure
for this analysis. Considering the pure 60:40 equity/bond portfolio as a benchmark, we
will estimate how an increasing managed futures’ position affects the overall portfolio’s
performance. Given the modern portfolio theory, a managed futures exposure should
contribute to an absolute return and add valuable diversification to a “traditional portfolio”
of stocks and bonds.
The daily data across futures markets is available from Tick Data LLC (www.tickdata.
com, accessed as of 3 December 2020) that offers historical tick-by-tick prices on the futures
and index markets. Our dataset consists of futures prices for 54 futures contracts in four
asset classes (25 commodities, 9 equity index, 10 foreign exchange, 10 bond futures). We
report the list of futures contracts in Table A1 (Appendix A). Both the daily S&P 500 and
Bloomberg Barclays US Aggregate Bond indices’ levels are available from Bloomberg. The
sample period ranges from January 2010 to December 2020. The futures investment will be
represented by a long/short position in front-month futures fully collateralized by holding
a corresponding value of the contract in US government bills or a bank deposit paying
EURIBOR interest rates. At the end of the day, all positions are rebalanced by marking them
to market and adjusting the collateral position to reflect the corresponding cash inflow or
outflow. The futures’ positions are rolled into the next month’s contract at the close on the
day before expiration. Following Moskowitz et al. (2012), the most liquid contracts in each
market will be considered.
4. Results and Discussion
In this section, we test and compare the performance of the managed futures’ portfolios
constructed based on two “short-term” and “long-term” momentum factors with the data
set ranging from January 2010 to December 2020 and check whether the results are robust
within a more extended period. In addition, we analyze the benefits of adding managedIn this section, we test and compare the performance of the managed futures’
portfolios constructed based on two “short-term” and “long-term” momentum factors
with the data set ranging from January 2010 to December 2020 and check whether the
Economies 2021, 9, 86 7 of 16
results are robust within a more extended period. In addition, we analyze the benefits of
adding managed futures’ exposure to the “traditional” equity/bond portfolio and confirm
the substantial advantages over the sample period.
futures’ exposure to the “traditional” equity/bond portfolio and confirm the substantial
4.1. Momentum
advantages Factors
over the sample period.
To evaluate the managed futures strategy that is based on momentum effect, we
4.1. Momentum Factors
construct the time series that is based on the ATSMOM (“adaptive time-series
To evaluate
momentum”) theasmanaged
factor describedfutures
in Elautstrategy that (2019)
and Erdős’s is based on momentum
paper. effect,
To get an intial we
sense
ofconstruct
the seriesthe time series that
performance, we is based
plot on thethe
it against ATSMOM
benchmark(“adaptive
SG Trend time-series momentum”)
Index. The SG Trend
factor as described in Elaut and Erdős’s (2019) paper. To get an
Sub-Index is a subset of the SG CTA Index designed to track the 10 largest (by intial sense of theAUM)
series
trend-following CTAs and represent the momentum followers’ performance in theis
performance, we plot it against the benchmark SG Trend Index. The SG Trend Sub-Index
a subset of
managed the SG
futures CTA Index designed to track the 10 largest (by AUM) trend-following
market.
CTAs Figure 1 shows the
and represent the momentum followers’
ATSMOM factor’s performance
time-series in the managed
compared to the SGfutures
Trend market.
Index,
based on daily returns data ranging from January 2010 to December 2020. For Trend
Figure 1 shows the ATSMOM factor’s time-series compared to the SG Index,
comparison
based on daily returns data ranging from January 2010 to December 2020. For
purposes, an initial level for each series is set at one (as, for example, we invested USD 1 comparison
atpurposes, an initial
the beginning level
of the for each
period) andseries
then is set at one
adjusted (as, on
based for their
example, we invested
corresponding USD 1
returns.
at the beginning of the period) and then adjusted based on their corresponding returns.
We found a substantial correlation of 0.7397 between two series for the sample period that
We found a substantial correlation of 0.7397 between two series for the sample period that
confirms, in essence, that the ATSMOM factor performs as it was expected to, i.e., it
confirms, in essence, that the ATSMOM factor performs as it was expected to, i.e., it follows
follows a general, average momentum strategy in the market. The performance of the
a general, average momentum strategy in the market. The performance of the ATSMOM
ATSMOM factor is slightly worse than the benchmark index. However, this is mostly due
factor is slightly worse than the benchmark index. However, this is mostly due to the
to the transaction costs, as we added the average transaction costs per trade in our analysis
transaction costs, as we added the average transaction costs per trade in our analysis to
to account for practical implementation issues of the ATSMOM strategy.
account for practical implementation issues of the ATSMOM strategy.
Theperformance
Figure1.1.The
Figure performanceofofSG
SGTrend
TrendIndex
Indexand
andATSMOM
ATSMOMfactor
factordaily
dailytime-series.
time-series.
Duetotothe
Due theflexibility
flexibilityofofthe
theElaut
Elautand
andErdős
Erdős(2019)
(2019)model,
model,estimating
estimatingand
andcomparing
comparing
momentum factors is possible based on different lookback periods. To take a closer
momentum factors is possible based on different lookback periods. To take a closer look look
at the momentum factor performance, we estimate an ATSMOM series with four distinct
at the momentum factor performance, we estimate an ATSMOM series with four distinct
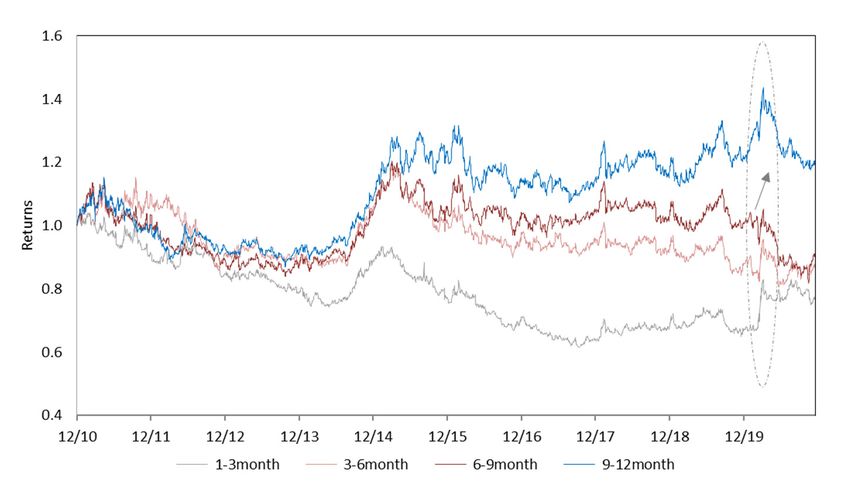
lookback periods: 1–3 months, 3–6 months, 6–9 months, and 9–12 months (see Figure 2).
lookback periods: 1–3 months, 3–6 months, 6–9 months, and 9–12 months (see Figure 2).
The results indicate that “short-term” (e.g., 1–3 months) and “long-term” (e.g., 9–12 moth)
The results indicate that “short-term” (e.g., 1–3 months) and “long-term” (e.g., 9–12 moth)
series are often minor or even negatively correlated. For example, we found a negative
series are often minor or even negatively correlated. For example, we found a negative
correlation of −0.414 between the “short-term” and the “long-term” momentum series
correlation of −0.414 between the “short-term” and the “long-term” momentum series
during the sample period from January 2010 to December 2020. The economic reasoning for
during the sample period from January 2010 to December 2020. The economic reasoning
this might be that the “long-term” series is more sensitive to the overall market’s general
for this might be that the “long-term” series is more sensitive to the overall market’s
trend. In contrast, the “short-term” series represents a correcting reversal to the mean effect.
general trend. In contrast, the “short-term” series represents a correcting reversal to the
This phenomenon is already documented in other financial markets. For example, Zaremba
et al. (2019) confirm that, contrary to the general trend, the stocks with a high (low) return
in the previous month underperform (overperform) in the following month. It is a short-
term reversal effect due to investors’ overreaction, liquidity issues, institutional behavior,
trading frictions, and/or transaction costs. We found this effect present in the futuresmean effect. This phenomenon is already documented in other financial markets. For
example, Zaremba et al. (2019) confirm that, contrary to the general trend, the stocks with
Economies 2021, 9, 86 a high (low) return in the previous month underperform (overperform) in the following 8 of 16
month. It is a short-term reversal effect due to investors’ overreaction, liquidity issues,
institutional behavior, trading frictions, and/or transaction costs. We found this effect
present in the futures market, too; contrary to a long-term momentum, short-term
market, too;is contrary
momentum tocorrelated
negatively a long-term momentum,
with the overall short-term momentum is negatively
market trend.
correlated with the overall market trend.
Theperformance
Figure2.2.The
Figure performanceofofATSMOM
ATSMOMfactor
factorwith
with1–3
1–3month,
month,3–6
3–6month,
month,6–9
6–9month,
month,9–12
9–12month
month
lookbackperiods.
lookback periods.
Toevaluate
To evaluatethe
thesignificance
significancethis
thiseffect
effecthas
hason
onthe
themomentum
momentumstrategy’s
strategy’sperformance,
performance,
Economies 2021, 9, x FOR PEER REVIEWwe construct an alternative portfolio where the positions with “long-term” momentum
9 of 18
we construct an alternative portfolio where the positions with “long-term” momentum
are bought (long position), and the ones with “short-term” momentum are sold (short
are bought (long position), and the ones with “short-term” momentum are sold (short
position). Elaut and Erdős (2019) refer to this position as the “speed” factor. As illustrated
position). Elaut and Erdős (2019) refer to this position as the “speed” factor. As illustrated
in Figure 3, the momentum portfolio with the “speed” factor presents a better investment
in Figure 3, the momentum portfolio with the “speed” factor presents a better investment
opportunity as it outperforms the ATSMOM portfolio during the sample period.
opportunity as it outperforms the ATSMOM portfolio during the sample period.
Figure
Figure 3. 3.
TheThe performance
performance ofof portfolios
portfolios with
with ATSMOMand
ATSMOM and“speed”
“speed”factors.
factors.
ToTocompare
compareperformances
performancesofofthe theportfolios,
portfolios,the
themain
maincharacteristics
characteristicsare arepresented
presentedinin
Table 1. Although the volatilities of both portfolios for the sample period
Table 1. Although the volatilities of both portfolios for the sample period are relatively are relatively
similar (10.3% p.a. for the ATSMOM portfolio, 11.7% for the portfolio
similar (10.3% p.a. for the ATSMOM portfolio, 11.7% for the portfolio with the “speed” with the “speed”
factor), the returns are improved in the case of the portfolio with the “speed”
factor), the returns are improved in the case of the portfolio with the “speed” factor (i.e., factor (i.e.,
4.3% p.a. as compared to a 0.3% p.a. return of ATSMOM portfolio).
4.3% p.a. as compared to a 0.3% p.a. return of ATSMOM portfolio). This significantly This significantly
increases
increases the
the Sharpe
Sharpe ratio
ratio from0.027
from 0.027 for
for theATSMOM
the ATSMOMportfolio
portfoliototo0.363
0.363for
forthe
theportfolio
portfolio
with the “speed” factor. The results also indicate that both portfolios’
with the “speed” factor. The results also indicate that both portfolios’ returns are returns are negatively
skewed (−0.432 for the ATSMOM portfolio, −0.285 for the portfolio with the “speed”
negatively skewed (−0.432 for the ATSMOM portfolio, −0.285 for the portfolio with the
factor), however, including the “speed” factor positively affects the portfolio skewness.
“speed” factor), however, including the “speed” factor positively affects the portfolio
skewness. However, it also increased the portfolio kurtosis, which refers to a higher
probability of obtaining extreme return values in the future.
Table 1. Summary statistics for portfolios with momentum factors.Economies 2021, 9, 86 9 of 16
However, it also increased the portfolio kurtosis, which refers to a higher probability of
obtaining extreme return values in the future.
Table 1. Summary statistics for portfolios with momentum factors.
Ratio SG Trend Index ATSMOM “Speed” Factor
Annualized Return 1.4% 0.3% 4.3%
Annualized Std Deviation 10.5% 10.3% 11.7%
Sharpe Ratio 0.129 0.027 0.363
Skewness −0.674 −0.432 −0.285
Kurtosis 3.130 3.661 4.783
Maximum Drawdown −23.0% −22.9% −25.4%
Our main results favor the portfolio with the “speed” factor, as it is expected to
increase the expected returns on a risk-adjusted basis. However, it should be noted that
it also outperforms SG Trend Index (a benchmark for the industry) by offering increased
returns and the reduced standard deviation of returns.
4.2. Market Regimes
We extend the analysis by comparing the performance of both “short-term” and “long-
Economies 2021, 9, x FOR PEER REVIEW
term”momentum series across economic regimes. Several studies (Routledge et al. 10 2000;
of 18
Hong and Yogo 2012; Bakshi et al. 2019) indicate that the performance of the momentum
factor series largely depends on the general economic conditions. Therefore, market timing
is anWe
essential
found component of each between
that the correlation systematic themomentum
“short-term”strategy.
and “long-term” momentum
We found that the correlation between the “short-term”
series increases during periods of financial distress, as “short-term” and “long-term”
momentummomentum
also starts
series increases during periods of financial distress, as “short-term”
capturing a robust and prominent trend in the market. During the COVID-19 momentumcrisis,
also starts
both
capturing a robust and prominent trend in the market. During the COVID-19
series exhibit a coordinated upward movement (see Figure 4). The COVID-19 pandemic crisis, both
had a powerful impact on financial markets, but looking back, we can observe that had
series exhibit a coordinated upward movement (see Figure 4). The COVID-19 pandemic the
a powerful impact on financial markets, but looking back, we can observe
negative effect was concise. It gives valuable insight into momentum strategies’ that the negative
effect was concise.
performance duringIt such
givescritical
valuable insight into
moments momentum
of market strategies’
distress. performance
Our estimated during
correlation
such critical moments of market distress. Our estimated correlation between the “short-
between the “short-term” and “long-term” momentum series increased up to 0.9811
term” and “long-term” momentum series increased up to 0.9811 during the COVID-19
during the COVID-19 crisis compared to a negative correlation of −0.414 between the two
crisis compared to a negative correlation of −0.414 between the two series during the
series during the sample period of January 2010 to December 2020.
sample period of January 2010 to December 2020.
Theperformance
Figure4.4.The
Figure performanceofofATSMOM
ATSMOMfactor
factorwith
with1–3
1–3month,
month,3–6
3–6month,
month,6–9
6–9month,
month,9–12
9–12month
month
lookbackperiods
lookback periodsduring
duringthe
theCOVID-19
COVID-19crisis.
crisis.
We used
We used aa Markov
Markov regime-switching
regime-switching model
model toto distinguish
distinguish between
between the
the periods
periods of
of
high and low volatility in the equity market (Perlin 2015). Using daily S&P 500 Index data,
high and low volatility in the equity market (Perlin 2015). Using daily S&P 500 Index data,
we define the periods of the “up”, “intermediate”, and “down” states of economic
regimes. The evolving probability of the “down” economic state is presented in Figure 5.
In addition, we use the economic sentiment indicator (ESI) series available from Eurostat
as a control variable to confirm periods of economic recession. Considering that volatilityEconomies 2021, 9, 86 10 of 16
we define the periods of the “up”, “intermediate”, and “down” states of economic regimes.
The evolving probability of the “down” economic state is presented in Figure 5. In addition,
we use the economic sentiment indicator (ESI) series available from Eurostat as a control
variable to confirm periods of economic recession. Considering that volatility is singled
out as one of the most critical factors in the market (Sakkas and Tessaromatis 2020), we
also consider the VIX Index as a proxy for the market’s uncertainty. By definition, the VIX
index measures an expected stock market volatility over the next 30 days as implied by the
S&P 500 index options. Therefore, it must be strongly correlated with market sentiment
and its current economic state. In general, VIX values greater than 30 are already linked to
increased uncertainty and risk; therefore, we set a critical value of 30 to define the periods
of significant financial distress. It seems that all indicators jointly capture critical moments
Economies 2021, 9, x FOR PEER REVIEW
in financial markets that occurred during the sample period from January 2010 to December 11 of 18
2020: the Black Monday in 2011 (when US sovereign debt was downgraded for the first
time), the 2015 Chinese stock market turbulence, and the recent COVID-19 financial crisis.
Figure 5.
Figure Time evolution
5. Time evolution of
of market
market regime
regime indicators
indicators and
and recession
recession periods.
periods.
To incorporate
To incorporate the
the economic
economic regime’s
regime’s effects
effects into
into our
our momentum
momentum strategy,
strategy, we
we use
use
our portfolio with the “speed” factor, as constructed in the previous section.
our portfolio with the “speed” factor, as constructed in the previous section. However, we However,
we allow
allow for for
thethe long
long position
position in in both“long-term”
both “long-term”andand“short-term”
“short-term” momentum
momentum factors
factors
Economies 2021, 9, x FOR PEER REVIEWduring “down” state economic regimes. As illustrated in Figure 6, the resulting time series
12 series
of 18
during “down” state economic regimes. As illustrated in Figure 6, the resulting time
refers that the momentum portfolio, adjusted for the economic regimes, outperforms an
refers that the momentum portfolio, adjusted for the economic regimes, outperforms an
initial “speed” factor portfolio. Both portfolios perform relatively similarly during periods
initial “speed” factor portfolio. Both portfolios perform relatively similarly during periods
of low volatility, and the volatility-adjusted momentum portfolio always outperforms the
of low volatility, and the volatility-adjusted momentum portfolio always outperforms the
“speed-factor” portfolio during high volatility periods.
“speed-factor” portfolio during high volatility periods.
Theperformance
Figure6.6.The
Figure performanceofofthe
theportfolio
portfoliowith
with“speed”
“speed”factor
factoradjusted
adjustedfor
foreconomic
economicregimes.
regimes.
A more detailed analysis of the results is presented in Table 2. The results are clearly
in favor of the momentum portfolio, adjusted for corresponding market regimes.
Adjusting the portfolio exposure to incorporate a broader set of economic factors
positively affects both risk and return of the portfolio, resulting in a significant increase inEconomies 2021, 9, 86 11 of 16
A more detailed analysis of the results is presented in Table 2. The results are clearly in
favor of the momentum portfolio, adjusted for corresponding market regimes. Adjusting
the portfolio exposure to incorporate a broader set of economic factors positively affects
both risk and return of the portfolio, resulting in a significant increase in its Sharpe ratio
(0.805 compared to 0.363 of the portfolio with the “speed” factor and 0.129 of the SG Trend
Index). For example, the portfolio with the “speed” factor earns a 4.3% p.a. return with
an 11.7% p.a. volatility for the sample period, and the portfolio adjusted for the market
regimes has a somewhat similar 13.8% p.a. volatility but results in an impressive 11.1% p.a.
return over the same period. Interestingly, both the portfolio skewness and kurtosis are
also improved in the momentum portfolio adjusted for market regimes.
Table 2. Summary statistics for momentum factor portfolios adjusted for economic regimes.
Ratio SG Trend Index “Speed” Factor Market Regime
Annualized Return 1.4% 4.3% 11.1%
Annualized Std Deviation 10.5% 11.7% 13.8%
Sharpe Ratio 0.129 0.363 0.805
Skewness −0.674 −0.285 −0.072
Kurtosis 3.130 4.783 2.807
Maximum Drawdown −23.0% −25.4% −24.4%
Overall, the results provide strong evidence of the benefits of adding the market
outlook and its volatility to the portfolio construction. Furthermore, it indicates that
adjusting the momentum portfolio exposure based on economic regimes increases its
return performance and improves its key risk characteristics (e.g., standard deviation,
skewness, kurtosis).
Unfortunately, the current sample period (from January 2010 to December 2020) is
relatively short. Performing an out-of-sample test would be difficult as part of the data
would still have to be withheld for validation purposes. Instead, in order to check if the
momentum portfolio performance is robust over time, we constructed a smaller futures
portfolio including only 28 futures contracts for which a complete data period is available
for a more extended sample period ranging from July 2003 to December 2020. The results
are presented in Table A2 (Appendix B) and confirm that the performances of all estimated
portfolios’ are consistent over this greater extended period and its corresponding market
conditions.
We conclude that managed futures strategy’s (based on two momentum signals)
performance is highly correlated with the economy’s state. Therefore, adjusting the strategy
based on economic factors and/or volatility can significantly improve managed futures’
portfolio performance.
4.3. Portfolio Diversification
Finally, we analyze the benefits of adding a managed futures’ exposure to institutional
investors’ portfolios. Several studies indicate that a long-term correlation between managed
futures returns and traditional (i.e., equity and/or bond) investment portfolio returns is low
or even negative. Therefore, institutional investors can potentially benefit from increased
diversification benefits. This section wants to assess whether those benefits can be found
by including our proposed managed futures momentum strategy in their portfolio. We
use our estimated portfolio constructed on two “short-term” and “long-term” momentum
factors (and adjusted for the economic regimes) as a proxy for an efficient momentum
strategy. A “traditional” institutional portfolio is approximated by a 60% long position in
the S&P 500 Index and a 40% short position in the Bloomberg Barclays US Aggregate Bond
Index.
For the purpose of this analysis, we constructed some investment portfolios with 10%
increasing allocations to a managed futures’ momentum exposure estimated based on the
sample period ranging from January 2010 to December 2020. The analysis starts with thein their portfolio. We use our estimated portfolio constructed on two “short-term” and
“long-term” momentum factors (and adjusted for the economic regimes) as a proxy for an
efficient momentum strategy. A “traditional” institutional portfolio is approximated by a
60% long position in the S&P 500 Index and a 40% short position in the Bloomberg
Barclays US Aggregate Bond Index.
Economies 2021, 9, 86 12 of 16
For the purpose of this analysis, we constructed some investment portfolios with 10%
increasing allocations to a managed futures’ momentum exposure estimated based on the
sample period ranging from January 2010 to December 2020. The analysis starts with the
“traditional”
“traditional”portfolio
portfolioasasaabenchmark
benchmarkcase caseand
andadds
adds10%
10%increments
incrementsand anda along-managed
long-managed
futures’
futures’momentum
momentumexposure
exposure to the portfolio.
portfolio. The
Theresults
resultsfor
forthe
theconstructed
constructed portfolios
portfolios are
are presented
presented in in Figure
Figure 7 in7 in
anan efficient
efficient frontier
frontier format.
format. It shows
It shows that
that gradually
gradually increasing
increasing the
the allocations
allocations to momentum
to momentum exposure
exposure has a positive
has a positive effect on
effect on overall overall
portfolio portfolio
performance
performance
initially—it initially—it
both increasesboth increases
total total
portfolio portfolio
returns and returns
decreasesanditsdecreases
standard its standardof
deviations
deviations
returns. of returns.
Figure 7. Impact of adding managed futures’ momentum strategy exposure to an equity/bond
Figure 7. Impact of adding managed futures’ momentum strategy exposure to an equity/bond
portfolio in 10% increments.
portfolio in 10% increments.
In our sample, the maximum Sharpe ratio (1.101) is achieved for the portfolio with
In our sample, the maximum Sharpe ratio (1.101) is achieved for the portfolio with
an approximately 40% allocation to the managed futures’ momentum strategy and 60%
an approximately 40% allocation to the managed futures’ momentum strategy and 60%
allocation to the traditional equity/bond portfolio. Then, more allocation to managed
futures’ exposure starts increasing the overall portfolio volatility after this point. However,
a pure “traditional” portfolio is still inferior to other investment opportunities, considering
the existence of a diversified portfolio on the efficient frontier that has the same standard
deviation as a “traditional” portfolio but offers significantly higher returns. The portfolios’
summary statistics with different allocation levels to the managed futures’ exposure are
presented in Table A3 (Appendix C) for further comparison.
Overall, we found the results strongly favoring the diversified portfolio with a man-
aged futures’ exposure. We also confirm that managed futures may hedge for extreme
events by improving overall portfolio performance during those difficult times.
5. Conclusions
In this paper, we analyze the performance of the managed futures strategy based
on momentum signal across different economic regimes, with a particular focus on the
COVID-19 pandemic period as a natural experiment of increased uncertainty in the market.
We offer a new approach to the momentum strategies because we confirm that using
the momentum signals based on different lookback periods can help manage portfolio
returns. Moreover, the managed futures momentum strategy is highly dynamic and could
be primarily improved if broader macroeconomic variables were added to the analysis. We
think that macroeconomic indicators can improve the strategic decision-making process
and achieve a higher level of diversification.
Firstly, we used the time-series based on the ATSMOM (“adaptive time-series mo-
mentum”) factor for managed futures strategy with momentum effect. We compared the
created strategy with the benchmark SG Trend Index and found a substantial correlation.
Because of the transaction costs, the performance of the ATSMOM factor was slightly worse.
Then, we tried to identify different lookback periods: 1–3 months, 3–6 months, 6–9 months,Economies 2021, 9, 86 13 of 16
and 9–12 months. The results indicated that the 1–3 month and 9–12 month series were
often little or even negatively correlated. Ther economic reasoning for this might be that
the “long-term” series is more sensitive to the overall market’s general trend.
In contrast, the “short-term” series represented a correcting reversal to mean effect. In
scientific literature, it is described as a short-term reversal effect due to investors’ overreac-
tion, liquidity issues, institutional behavior, trading frictions, and/or transaction costs. We
found this effect present in the futures market was contrary to a long-term momentum;
a short-term momentum was negatively correlated with the overall market trend. To
evaluate the significance this effect had on the momentum strategy’s performance, we
constructed an alternative portfolio where the positions with “long-term” momentum
were bought (long position). The ones with “short-term” momentum were sold (short
position). We revealed that the momentum portfolio with the “speed” factor presents a
better investment opportunity as it outperforms the ATSMOM portfolio during the sample
period. It should be noted that the “speed” factor also outperformed the SG Trend Index
by offering increased returns and the reduced standard deviation of returns.
Secondly, we extended the analysis by comparing the performance of both the “short-
term” and “long-term” momentum series across the economic regimes. We found that
the correlation between “short-term” and “long term” momentum series increased during
periods of financial distress, as “short-term” momentum also started capturing a robust and
prominent trend in the market. Despite the fact that the COVID-19 pandemic had a strong
impact on financial markets, looking back, we could point out that the negative effects were
concise. It gave a valuable insight into momentum strategies’ performance during such
critical moments as the COVID-19 pandemic. We used a Markov regime-switching model
to distinguish between the periods of high and low volatility in the equity market. We used
our portfolio with the “speed” factor to incorporate the economic regime’s effects into our
momentum strategy. We revealed that the momentum portfolio, adjusted for the economic
regimes, outperformed an initial “speed” factor portfolio. Both portfolios performed
relatively similarly during periods of low volatility, and the “volume-adjusted” momentum
portfolio always outperformed the “speed” factor portfolio during high volatility periods.
The results provided strong evidence of the benefits of adding the market outlook and its
volatility to the portfolio construction. It indicates that adjusting the momentum portfolio
exposure based on economic regimes increased its return performance and improved its
key risk characteristics. We conclude that managed futures strategy’s performance is highly
correlated with the economy’s state. Therefore, adjusting the strategy based on economic
factors and/or volatility can significantly improve managed futures’ portfolio performance.
Finally, we analyzed the benefits of adding a managed futures’ exposure to institu-
tional investors’ portfolios. We used our estimated portfolios constructed on two “short-
term” and “long-term” momentum factors and adjusted for the economic regimes to proxy
for an efficient momentum strategy. The results showed that gradually increasing the
allocations to momentum exposure had a positive effect on overall portfolio performance
initially—it both increases total portfolio returns and decreases its standard deviations of
returns. Overall, we found the results strongly favored the diversified portfolio with a
managed futures’ exposure. We also confirm that managed futures may hedge for extreme
events by improving overall portfolio performance during those difficult times.
In summary, we confirm that the construction of a portfolio based on academi-
cally/economically sound momentum signals and its allocation timing based on broader
economic factors and market volatility can significantly improve managed futures strate-
gies and add significant diversification benefits to the investors’ portfolios. Some suggested
avenues for future research might include using alternative momentum estimates, portfolio
construction methods, economic regime factors, or using a more extended sample period
to see if this model can still be further developed.
Author Contributions: Conceptualization, R.G. and D.T.; methodology, R.G.; software, R.G.; vali-
dation, R.G. and D.T.; formal analysis, R.G. and D.T.; investigation, R.G. and D.T.; resources, R.G.
and D.T.; data curation, R.G.; writing—original draft preparation, R.G. and D.T.; writing—reviewYou can also read