Ares Investor Presentation - December 2019 - Ares :: Investor Resources

Page created by Seth Morales
 
CONTINUE READING
Ares Investor Presentation - December 2019 - Ares :: Investor Resources
Ares Investor Presentation
December 2019

                             1
Disclaimer
The information contained in this presentation is summary information that is intended to be considered in the context of Ares Management Corporation (NYSE: ARES) (“Ares”) SEC filings and other
public announcements that Ares may make, by press release or otherwise, from time to time. Ares undertakes no duty or obligation to publicly update or revise the forward-looking statements or
other information contained in this presentation. These materials contain information about Ares, its affiliated funds and certain of their respective personnel and affiliates, information about their
respective historical performance and general information about the market. You should not view information related to the past performance of Ares and its affiliated funds or information about
the market, as indicative of future results, the achievement of which cannot be assured. Certain Ares Fund securities may be offered through our affiliate, Ares Investor Services LLC (“AIS”), a broker-
dealer registered with the SEC, and a member of FINRA and SIPC.

Nothing in these materials should be construed as a recommendation to invest in any securities that may be issued by Ares or as legal, accounting or tax advice. None of Ares, its affiliated funds or
any affiliate of Ares or its affiliated funds makes any representation or warranty, express or implied, as to the accuracy or completeness of the information contained herein and nothing contained
herein shall be relied upon as a promise or representation whether as to the past or future performance. Certain information set forth herein includes estimates, projections and targets and involves
significant elements of subjective judgment and analysis. Further, such information, unless otherwise stated, is before giving effect to management and incentive fees and deductions for taxes. No
representations are made as to the accuracy of such estimates, projections or targets or that all assumptions relating to such estimates, projections or targets have been considered or stated or that
such estimates, projections or targets will be realized.

These materials are not intended as an offer to sell, or the solicitation of an offer to purchase, any security, the offer and/or sale of which can only be made by definitive offering documentation. Any
offer or solicitation with respect to any securities that may be issued by Ares will be made only by means of definitive offering memoranda or prospectus, which will be provided to prospective
investors and will contain material information that is not set forth herein, including risk factors relating to any such investment.

Statements included herein may constitute "forward-looking statements" within the meaning of the Private Securities Litigation Reform Act of 1995, which relate to future events or Ares’ future
performance or financial condition. These statements are based on certain assumptions about future events or conditions and involve a number of risks and uncertainties. These statements are not
guarantees of future performance, condition or results. Actual results may differ materially from those in the forward-looking statements as a result of a number of factors, including those described
from time to time in our filings with the SEC. Ares undertakes no duty to update any forward-looking statements made herein.

An investment in Ares will be discrete from an investment in any funds or other investment programs managed by Ares and the results or performance of such other investment programs is not
indicative of the results or performance that will be achieved by Ares or such investment programs. Moreover, neither the realized returns nor the unrealized values attributable to one Ares fund are
directly applicable to an investment in any other Ares fund.

An investment in Ares may be volatile and can suffer from adverse or unexpected market moves or other adverse events. Investors may suffer the loss of their entire investment. The information set
forth herein is as of the date of this presentation unless otherwise indicated and Ares undertakes no duty to update any of the information set forth herein.

Management uses certain non-GAAP financial performance measures to evaluate Ares’ performance and that of its business segments. Management believes that these measures provide investors
with a greater understanding of Ares’ business and that investors should review the same supplemental non-GAAP financial measures that management uses to analyze Ares’ performance. The
measures described herein represent those non-GAAP measures used by management, in each case before giving effect to the consolidation of certain funds that Ares consolidates with its results in
accordance with GAAP. These measures should be considered in addition to, and not in lieu of Ares’ financial statements prepared in accordance with GAAP. Please refer to the Appendix for
definitions and explanations of these non-GAAP measures and reconciliations to the most directly comparable GAAP measures. Amounts and percentages may reflect rounding adjustments and
consequently totals may not appear to sum.

Some funds managed by Ares or its affiliates may be unregistered private investment partnerships, funds or pools that may invest and trade in many different markets, strategies and instruments and
are not subject to the same regulatory requirements as mutual funds, including mutual fund requirements to provide certain periodic and standardized pricing and valuation information to investors.
Fees vary and may potentially be high. In addition, in light of the various investment strategies of such other investment partnerships, funds and/or pools, it is noted that such other investment
programs may have portfolio investments inconsistent with those of the strategy or investment vehicle proposed herein. For the definitions of certain terms used in this presentation, please refer to
the “Glossary” slide in the appendix.

This may contain information from BofA Merrill Lynch, used with permission. BOFA MERRILL LYNCH IS LICENSING THE ICE BOFAML INDICES AND RELATED DATA “AS IS,” MAKES NO WARRANTIES
REGARDING SAME, DOES NOT GUARANTEE THE SUITABILITY, QUALITY, ACCURACY, TIMELINESS, AND/OR COMPLETENESS OF THE ICE BOFAML INDICES OR ANY DATA INCLUDED IN, RELATED TO, OR
DERIVED THEREFROM, ASSUMES NO LIABILITY IN CONNECTION WITH THEIR USE, AND DOES NOT SPONSOR, ENDORSE, OR RECOMMEND ARES MANAGEMENT, OR ANY OF ITS PRODUCTS OR SERVICES.
REF: AM-00358
                                                                                                        2
Overview of Ares Management
With Approximately $144 Billion in Assets Under Management, Ares Management Corporation is a
Leading Global Alternative Asset Manager With Three Distinct but Complementary Investment Groups

    Profile                                                                                  Global Footprint
    Founded:                                                            1997
    AUM:                                                            $144bn
    Employees:                                                       1,200+
    Investment Professionals:                                           ~465
    Global Offices:                                                      20+
    Direct Institutional Relationships:                                 935+
    Listing: NYSE – Market Capitalization:(1)                       ~$7.3bn

    The Ares Edge                                                                                               Credit                 Private Equity            Real Estate

      Founded with consistent               Deep management team
      credit based approach to              with integrated and                            AUM               $106.3bn                      $25.5bn                $12.5bn
      investments                           collaborative approach
                                                                                                              Direct Lending          Corporate Private Equity   Real Estate Equity
                                                                                            Strategies

                                                                                                               Liquid Credit            Special Opportunities    Real Estate Debt
      20+ year track record of              Pioneer and a leader in
      compelling risk adjusted              leveraged finance and
                                                                                                             Alternative Credit         Energy Opportunities
      returns through market                private credit
      cycles
                                                                                                                                      Infrastructure and Power

Note: As of September 30, 2019. AUM amounts include funds managed by Ivy Hill Asset Management, L.P., a wholly owned portfolio company of Ares Capital
Corporation and registered investment adviser. Past performance is not indicative of future results.
1. As of November 1, 2019.
                                                                                                         3
Ares Investment Thesis
   High Growth Financial Services Company Well-positioned to Deliver Attractive Shareholder Returns by
   Executing on a Straightforward Business Model

                       Leading Platform                     Stable and Diversified Model             Compelling Growth Story

       ✓      Global and scaled investing               ✓   High-quality and diverse           ✓   Attractive industry
              presence with unique origination              revenues primarily compromised         fundamentals
              capability                                    of management fees
                                                                                               ✓   New product offerings and
       ✓      Three complementary businesses            ✓   Dividend supported by stable and       expansion of distribution
              drive synergies                               growing fee related earnings           channels
       ✓      Long track record of                      ✓   Consistent management fee          ✓   Strong fundraising
              demonstrated investment                       growth through cycles
              performance                                                                      ✓   Strategic growth through
                                                                                                   opportunistic M&A
                                                        ✓   Long-lived, locked-up capital
       ✓      Continuity of management and
              investment professionals                  ✓   Scalable model facilitates         ✓   Path to shareholder value
                                                            operating margin expansion             creation through FRE growth and
       ✓      Broad, supportive and growing                                                        retention of PRE
              investor base

Past performance is not indicative of future results.                        4
Creating “Ecosystems”
 We Believe the Breadth and Scale of Our Activities Drives Value and Investment Performance

                                                                     Corporate Assets                 Real Assets

             Liquid Securities /
             Secondary Markets

             Self Originated Credit /
             Asset Financing

             Equity /
             Asset Ownership

           Sourcing Benefits                                 Evaluation Benefits                              Execution Benefits
 Complete capital structure solutions drive        Information and research advantages              Disciplined structuring and pricing
 originations                                         • Differentiated information enhances            • Active investment role improves control
   • Broad offering to help meet client needs           investment decisions                             over outcomes
 Deep domain experience and networks                  • Shared research across the platform         Capital structure arbitrage
   • Highly experienced teams and large            Better relative value lens                          • Bring flexible capital to most attractive
     market presence facilitate transaction flow      • Identify attractive risk adjusted returns        tranche of the capital structure
 Power of incumbency                                    across capital structures and markets       Liquid / Illiquid market arbitrage
   • Large portfolio and strong relationships                                                          • Exploit inefficiencies in primary AND
     provide attractive future opportunities                                                             secondary markets

                                                                            5
History of Growth
 Growth Every Year in Number of Funds and Investors, AUM and Management Fee Revenues

             # of Funds and Investors(1)                                                           AUM(2)                                               Management Fee Revenue(3)
                                                                          ($ in billions)                                                         ($ in millions)
                                                                                                                              $144
       # Funds                                         242
                                                                                                                                                                                             $963
       # Investors
                                                                                                                  $106
                                           202

                                                                                                                                                                                      $745

                                                                                                       $82
                               150                                                                                                                                             $598
                                                       937

                                           783

                               624                                                          $49
                   84
                                                                                                                                                                $324

                                                                                $25
        38                                                                                                                                          $170
       166         182

      2008        2011        2014        2017       Q3-19                     2008         2011      2014        2017       Q3-19                  2008        2011           2014   2017    LTM
                                                                                                                                                                                             Q3-19

  Note: There can be no guarantee that Ares can or will sustain such growth.
  1. Represents direct institutional investors.
  2. AUM amounts include funds managed by Ivy Hill Asset Management, L.P., a wholly owned portfolio company of Ares Capital Corporation and a registered investment adviser.
  3. Includes quarterly performance income on the investment income of Ares Capital Corporation ("ARCC Part I Fees").
                                                                                                            6
Diversified & Growing Investor Base
 We Believe Our Deep and Expanding Investor Relationships Can Be Attributed to Our Performance

                            AUM Mix by Investor(1)                                                                        Direct AUM Mix by Geography(1)
    ($ in billions)                                                                                    ($ in billions)
                                        $144.3                                                                                                 $99.9
                                                                                                                             Middle East,
                                                                                                                              $7.3, 7% Other, $0.4,
                                                                                                                                           1%

                                                                    Institutional
                              Institutional                                Direct
                             Intermediarie                                 $99.9
                             s, $17.8, 12%                                 ~69%                                             Asia &
                                                            Pension,
                                                                                                                           Australia,
                                                           $39.7, 28%
                    Public                                                                                                $14.1, 14%
                   Entities
                 and Related,
                  $26.6, 19%                                                                                                                                        North
                                                                                                                                                                   America,
                                                                                                                                                                  $55.8, 56%
 Other,                                                      Insurance,                                                   Europe,
$6.2, 4%                                                     $16.5, 11%                                                  $22.3, 22%

                                         Bank/Private Bank,
Endowment,                       Sovereign $16.1, 11%
  $1.7, 1%                        Wealth,
                                 $12.3, 9%
   Investment
    Manager,
     $7.4, 5%

  Note:
  1. As of September 30, 2019. Includes funds managed or co-managed by Ares. Also includes funds managed by Ivy Hill Asset Management, L.P. Percentages may not
     add to 100% due to rounding.
                                                                                                  7
Investors Are Deepening Relationships with Ares
    Increasing Growth and Cross-Selling Across Platform with New and Existing Investors

                                 Institutional Direct Investors                                                                        Additional Investors Investing Across Funds
                      In addition to institutional direct investors, Ares has                                                      Ares has cross marketed its existing investors into new funds…
                         225,000+ retail investors across public funds(1)                                                                                                           360
                                                                                                   CAGR                                                                              39

                                                                                937                 18%
                                                                                                    21%

                                                                                                    12%                                                                             321

                                                                                                    24%                                         76
                                                                                                                                                5
                                                                                                    30%                                         71

                                                                                                                                                2012                               Q3-19
                                                                                                    25%                                                2-5 Funds       > 5 Funds

                                                                                                    12%
                                                                                                                              Experienced in Cross-Selling Across Investment Groups
                                                                                                                          AUM ($ in billions)
                                                                                                                                                 …and into multiple strategies across platform
                                                                                                    29%
                                                                                                                                                                                   $52.3

                                                                                                                                                                                   $14.8
                               211

                                                                                                    26%
                                                                                                                                                                                   $37.5

                                                                                                                                                $9.6

                               2012                                            Q3-19                                                            2012                               Q3-19
                    Pension                                 High Net Worth                                                                             2 Groups        3 Groups
                    Bank/Private Bank                       Insurance
                    Investment Manager                      Endowment/Foundation
                    Sovereign Wealth Fund                   Sub-Advisory / Other
                    Ares

Note: Past performance is not indicative of future results. There can be no guarantee that Ares can or will sustain such growth.
1. As of April 8, 2019 for ARCC, February 26, 2019 for ACRE and April 15, 2019 for ARDC.                                8
Diversified and Stable Business & Revenue Model
 Revenue Model Supports Stability and Growth of Earnings

                                                   9
Stable and Diversified Management Fee Driven Business Model
 Consistent 85%+ Fee Revenue from Stable, Cross-Platform Management Fees

                                                                  Total Unconsolidated Fee Revenue Composition(1)
                                                                                                                                                             $1,070mm

                                                                                                                                    $967mm                         8%
                                                                                                                                                                  2%

                                                                                                         $843mm                        11%                        8%
                                                                                                                                        3%                                                 Realized Net Performance Income
                                                                             $767mm                         9%
                                                                                                                                        8%
                                                                                                            3%                                                                             Other Fees
                                                 $712mm                                                                                                           20%
                       $670mm                                                  12%
                                                    8%                                                      8%                                                                             Mgmt. Fees: Real
                         10%                        1%                          2%
                                                                                                                                       21%                                                 Estate
                          1%                        9%                          9%
                                                                                                                                                                                           Mgmt. Fees: Private
                         13%                                                                                24%                                                                            Equity
                                                    21%                        19%                                                                                                         Mgmt. Fees:
                         14%                                                                                                                                                               Credit
                                                                                                                                                                  62%
                                                                                                                                       57%
                                                                                                            56%
                                                    61%                        58%
                         62%

                         2014                       2015                       2016                        2017                       2018                    LTM Q3-19

                 89% in Mgmt. Fees          91% in Mgmt. Fees           86% in Mgmt. Fees          88% in Mgmt. Fees           87% in Mgmt. Fees          90% in Mgmt. Fees

  1. Total fee revenue is calculated as management fees plus realized net performance income and other fees. Percentage of management fees includes the following amounts
     attributable to ARCC Part I Fees: 20% in 2014, 19% in 2015, 18% in 2016, 14% in 2017, 15% for 2018 and 16% in LTM Q3 2019; Management fees have been adjusted for the
     movement of our special situations strategy from our Credit Group into our Private Equity Group that became effective July 1, 2016. All other periods have been adjusted to conform
     with the current presentation.
                                                                                                              10
Stable Management Fee Revenue Growth Through Cycles
 Ares has Experienced Consistent Management Fee Growth Regardless of Market Volatility

  (Indexed at 100)1                                                                                                                                        ($ in millions)

  700                                                                                                                                                               $1,000
                               ’07-’09 Management Fee
                                      CAGR: 28%
  600
                                                                                                                                                                    $800

  500

                                                                                                                                                                    $600
  400

  300
                                                                                                                                                                    $400

  200

                                                                                                                                                                    $200
  100

    0                                                                                                                                                               $0
              '06           '07          '08           '09           '10          '11           '12     '13        '14        '15       '16   '17   '18    LTM
                                                                                                                                                          Q3-19
                                   Management Fees                          MSCI World Index                  High Yield(2)         VIX(3)

  Note:
  1. Benchmarks initial data point at 100 with changes compared to initial data point.
  2. Represents the ICE BofAML U.S. High Yield Master II Index (“HOAO”) yield to worst per Yieldbook.
  3. Represents CBOE Volatility Index.
                                                                                                        11
Stable, Long Duration AUM
 AUM and Management Fees Supported by Long-Dated Assets

                               AUM Mix by Duration(1)                                                                               Management Fee Mix by Duration(1)

   •    The initial duration was greater than 7 years for approximately 74%                                       •    Management fees supported by long duration AUM, which also
        of AUM                                                                                                         benefit from mark-to-market insulation
                                                                                                                  •    82% of management fees with a duration of > 3 years
   •    70% of AUM has a duration of > 3 years                                                                         o 36% of management fees from permanent capital vehicles

                                                 4%                                 70% > 3 years                                                             1%                             82% > 3 years
                                  17%                       13%                                                                                   11%

                                                                                                                                       6%
                                                                         10%                                                                                                    36%

                           9%
                                                                           13%
                                                                                                                                        22%

                                                34%                                                                                                                            4%
                                                                                                                                                              20%

       Permanent Capital             10 or more years              7 to 9 years            3 to 6 years           Fewer than 3 years              Differentiated Managed                  Managed Accounts
                                                                                                                                                  Accounts(2)

  Note: AUM amounts include funds managed by Ivy Hill Asset Management, L.P.
  1. As of September 30, 2019.
  2. Differentiated managed accounts have been managed by the firm for longer than three years, are investing in illiquid strategies or are co-investments structured to pay management
     fees.
                                                                                                            12
Significant Capacity for Investment and Growth in Incentive Eligible AUM
 Well Positioned for Growth Across Market Cycles

                                                                                                                     $28.2
                                                                                                                                      $26.4
                                                                                                                      $1.7
                                                                                                                      $1.7             $2.6
                                                                                                                                       $2.1
                                                                                    $18.0                                                                   As of September 30, 2019,
            AUM Not Yet                                             $15.5            $0.9            $14.5                                                  $26.4 billion of our total AUM
            Earning Fees                                             $0.9                             $0.9
                                                                                     $9.3             $2.2            $24.8
                                                                                                                                                            was Not Yet Earning
                $bn                                 $9.2             $7.2                                                             $21.7                 Management Fees
                                                    $1.9                                             $11.4
                                                    $5.8             $7.3            $7.7

                                                    2014            2015             2016            2017             2018            Q3-19

                                                                                                                                      $86.2
                                                                                                                     $78.4             $7.8
                                                                                                                      $7.5
                                                                                                     $60.4                            $21.4
                                                                                                                      $18.9
                                                                                    $50.7             $7.1
                                                                    $45.8                                                                                   As of September 30, 2019, Our
     Incentive Eligible AUM                                                          $6.6                                                                   Incentive Eligible AUM totaled
                                                   $37.4             $6.8                            $19.6
              $bn                                                                   $19.5                                                                   $86.2 billion
                                                                    $16.7                                                             $57.0
                                                    $11.0                                                             $52.0
                                                                                                     $33.7
                                                   $20.0            $22.2           $24.7

                                                    2014            2015             2016            2017             2018            Q3-19

                                                              Credit                 Private Equity               Real Estate

  Note: As of July 1, 2016, the special opportunities strategy moved out of our Credit Group and into our Private Equity Group. Historical results have been adjusted to
  conform with the current presentation. No assurance can be made that such results will be achieved.

                                                                                                       13
AUM Not Yet Earning Fees
As of September 30, 2019, AUM Not Yet Earning Fees of $26.4 billion could generate approximately $253.2 million in potential incremental annual
management fees, of which $235.6 million relates to the $24.2 billion of AUM available for future deployment(1)
      •      The $24.2 billion of AUM Not Yet Earning Fees available for future deployment includes approximately $18.5 billion relating to U.S. and European
             direct lending funds, $2.5 billion in alternative credit funds and $2.0 billion in our Real Estate Group funds

                                                                                                                               AUM Not Yet Earning Fees Available for Future
                AUM Not Yet Earning Fees: $26.4 billion
                                                                                                                                        Deployment: $24.2 billion

                                                                                        $24.2 billion of AUM Not Yet Earning Fees
                                                                                          was available for future deployment

                                                   ($ in millions)                                                                                                   ($ in millions)
       Capital Available for Future Deployment
       Capital Available for Deployment for Follow-on Investments (2)
       Funds in or Expected to Be in Wind-down                                                                                                      Credit           Private Equity      Real Estate

1. No assurance can be made that such results will be achieved. Assumes the AUM Not Yet Earning Fees as of September 30, 2019 is invested and such fees are paid on an annual basis. Does not reflect any associated reductions
in management fees from certain existing funds, some of which may be material. There is no assurance such capital will be invested. Reference to $253.2 million includes approximately $32.4 million in potential incremental
management fees from deploying undrawn/available credit facilities at ARCC (in excess of its current leverage up to its target leverage of 1.25x debt to equity). Effective June 21, 2019, ARCC has increased its target leverage to a
range of 0.9x to 1.25x debt to equity, as provided for in the 2018 Small Business Credit Availability Act. No assurance can be made that such capital will be invested. Note that no potential ARCC Part I Fees are reflected in any of
the amounts above.

2. Capital available for deployment for follow-on investments represents capital committed to funds that are past their investment periods but have capital available to be called for follow-on investments in existing portfolio
companies. As of September 30, 2019, capital available for deployment for follow-on investments could generate approximately $17.6 million in potential management fees. There is no assurance such capital will be invested.
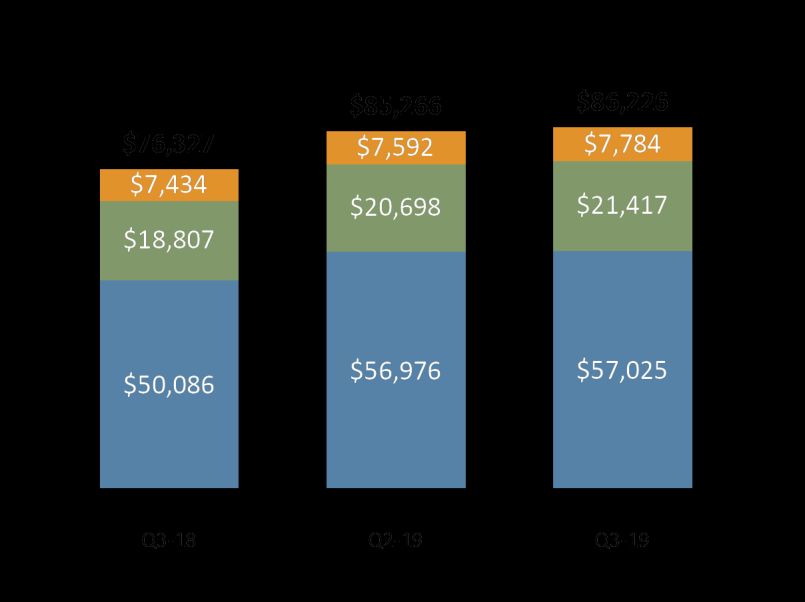
                                                                                                                     14
Incentive Eligible AUM and Incentive Generating AUM
Incentive Eligible AUM as of September 30, 2019 was $86.2 billion, an increase of 13.0% from prior year
    •     The increase of $10 billion was primarily driven by capital raising across U.S. and European direct lending funds in our Credit Group
Incentive Generating AUM(1) as of September 30, 2019 was $38.7 billion, an increase of 4.1% from prior year
    •     The increase was primarily driven by ACOF V exceeding its hurdle rate in our Private Equity Group, as well as deployment of capital within funds
          exceeding hurdle rates as of September 30, 2019
Of the $59.0 billion of Incentive Eligible AUM that is currently invested, 65.6% is Incentive Generating
    •     Excluding the ARCC Part II fees(2) that are based on capital gains from the largely debt oriented ARCC portfolio, 86.1% of Incentive Eligible AUM that
          is currently invested is Incentive Generating

                                                                                                                             Q3-19 Incentive Generating to Incentive Eligible
                             Incentive Eligible AUM
                                                                                                                                          AUM Reconciliation

                                                                                                                         ($ in millions)
        ($ in millions)                                                                                                                                                      Private          Real
                                                                                                                                                           Credit                                      Total
                                                                                                                                                                             Equity          Estate

                                                                                                                         Incentive
                                                                                                                         Generating AUM                     $20,438            $15,127        $3,116   $38,681

                                                                                                                         + Uninvested
                                                                                                                         IEAUM                               19,052               4,905        3,273   27,230

                                                                                                                         + IEAUM below
                                                                                                                         hurdle                                3,477              1,385        1,395     6,257

                                                                                                                         +ARCC Part II Fees
                                                                                                                         below Hurdle(2)                     14,058                      —        —    14,058

                                                                                                                         Incentive Eligible
                                                                                                                         AUM                                $57,025            $21,417        $7,784   $86,226
                            Credit             Private Equity    Real Estate

   1. Incentive Generating AUM includes $9.9 billion of AUM from funds generating unrealized incentive income that is not recognized as revenue by Ares until such fees are
   crystallized or no longer subject to reversal.

   2. ARCC Part II Fees are paid in arrears as of the end of each calendar year when the cumulative aggregate realized capital gains exceed the cumulative aggregate realized capital
   losses and aggregate unrealized capital depreciation, less the aggregate amount of Part II Fees paid in all prior years since inception. As of September 30, 2019, this calculation
   resulted in ARCC being below the required hurdle for payment to Ares of any ARCC Part II Fees by
Multiple Growth Opportunities in Attractive Industry
  Leveraging the Ares Platform to Capitalize on Industry Tailwinds for Further Growth

                                                                                                                                                            Growth Accelerators

                                                                                                                             Levers to Drive
                                                                                                                             Organic Growth             •   Future acquisitions
                                                                                                                                                            facilitated by more liquid
                                                                                                                                                            stock currency
                                                                           Industry Trends                           •    Fundraising growth and
                                                                                                                          increased cross-selling       •   Opportunistically expand
                      Platform Attributes                          •    Rotation from liquid to                                                             during market dislocations
                                                                        illiquid assets                              •    New product offerings and
                 •    Global, scaled investment                                                                           investment solutions          •   Strategic acquisitions and
                      platform                                     •    Banks leaving void for                                                              portfolio purchases
                                                                        private capital to fill                      •    New distribution channels
                 •    Diverse product offerings                                                                                                         •   Team lift-outs and strategic
                      and unique investment                        •    Retailization of alternatives
                                                                                                                     •    Geographic expansion              joint ventures and
                      sourcing capabilities                                                                                                                 partnerships
                                                                   •    Growing pension liability
                 •    Demonstrated track record                         gap and insurance yield                      •    Deployment of dry powder
                      of investment performance                         demand
                                                                                                                     •    Realization of returns from
                 •    Experienced and cohesive                     •    Consolidation of LP                               incentive eligible AUM
                      team                                              relationships

Note: Past performance is not indicative of future results and there can be no assurance that any historical trends will continue.
                                                                                                                     16
Growing Global Demand for Alternatives
                       Investors Look To Alternative Investing as an Attractive and Needed Complement to Traditional Portfolio Allocations

                     The Secular Shift Toward a Low Interest Environment Limits Ability For                       Consequently, The Increasing Asset Liability Gap for Pension Funds
                           Traditional Portfolio Allocations to Reach Target Returns(1)                         Highlights Urgent Need for Higher Returning Investment Alternatives(2)

                                                                                                                                      Pension Assets as a Percentage of Liabilities
                                                                                                                       102%
                     10.0
                                                                                                                100%
                                                                                                                          95%
                                                  Highest U.S. Public Pension Expected Return (8.00%)(3)
                      8.0
                                                                                                                                89%
                                                                                                                90%                   87%
Yield / Return (%)

                                                                                                                                                      86%
                                                                                                                                            85% 85%
                      6.0                                                                                                                                   84%
                                                  Lowest U.S. Public Pension Expected Return (5.25%) (3)

                                                                                                                80%                                               78%
                      4.0                                                                                                                                               76%
                                                                                                                                                                              74%
                                                                                                                                                                                    72%72% 73%73% 72%72% 72%

                      2.0                                                                                       70%

                      0.0                                                                                       60%

                                                          10yr Treasury Rate

                                               We believe the increasing gap between pension assets and liabilities driven by a low
                                            interest rate environment demonstrates the need for higher yielding investments that are
                                                                        less correlated to traded markets

                     1. Source: Macrotrends. Data as of 10/22/2019.
                     2. Center for Retirement Research at Boston College. March 2019.
                     3. National Association of State Retirement Administrators.
                                                                                                           17
Market Shift Toward Private Capital
  Private Equity Markets Continue to Take Share Vs. Public Equity Markets and the Opportunity for Further Growth Exists

                                                                                                        Private Companies Far Outweigh Public Companies Which is
       U.S. & European Public Vs Private Dollar Volume(1)
                                                                                                               Exaggerated in The Middle Market Segments(2)

                                                                                                 20,000
                 2018 was the first year when private dollar volume                                                             Number of U.S. Public and Private
$800                                                                                                        17,941
                                                                                                                                 Companies by Annual Revenue
               exceeded that of public IPO and follow on capital raises

$700
                                                                                                 15,000
$600

$500
                                                                                                                                10,170
                                                                                                 10,000
$400

$300

                                                                                                   5,000
$200
                                                                                                                                                3,035

$100                                                                                                                                                             1,565         1,370 1,309
                                                                                                                     517                  589           480              482

 $0                                                                                                     0
                                                                                                              $50mm –           $100mm –        $250mm –         $500mm –        $1+bn
           2014             2015             2016             2017             2018                           $100mm                             $500mm
                                                                                                                                 $250mm                            $1bn

             IPO & Follow On $ Volume                  Private Equity $ Volume                                                   Private Companies         Public Companies

  1.   Source: North American and European public market follow on and IPO data per Refinitv and PE transaction volume data per Preqin.
  2.   Source: World Economic Forum as of April 2018.

                                                                                                   18
Growth of Alternative Assets
 Investors are Continuing t0 Move into Alternative Asset Classes in Search for Higher Returning Assets

Private Equity, Private Debt and Infrastructure are Expected to                                                          Projected Growth of Private Capital by Selected Segment(2)
  Draw the Most Interest from Investors Over the Long Term

      Investors intending to increase allocation over the long term(1)

                                                                                                                                     2018                          2023
                                                                                                                                Natural Resources/
         50%                                                                                                                      Infrastructure
                              48%
                                                  46%                                                                                $0.7tn          +157% →       $1.8tn

                                                                                                                                   Private Debt
                                                                       36%
                                                                                                                                     $0.8tn          +75% →        $1.4tn
                                                                                            29%
                                                                                                                                  Private Equity

                                                                                                                                     $3.6tn          +36% →        $4.9tn

                                                                                                                                   Real Estate

                                                                                                                                     $0.9tn          +33% →        $1.2tn

                                                                                                                                  Hedge Funds

                                                                                                                                     $3.6tn          +31% →        $4.7tn
   Infrastructure        Private Debt        Private Equity        Real Estate           Natural
                                                                                        Resources

 Note: There can be no guarantee that Ares can or will sustain such growth, or that any estimates will be realized.
 1. Preqin Investor Outlook Alternative Assets H1-19.
 2. Source: Preqin as of 2019.                                                                                      19
Ares’ AUM Growing in Excess of Alternative and Traditional Markets
 Ares’ AUM Growth Has Been 2x the Growth Rate of Alternatives

                                                                            Global, Alternative and Ares AUM(1)
                                                                                                                                                                    +9%
                                                                                                                                                                   CAGR
                                                                                                      Ares AUM
                                                                                                     +24% CAGR                        +23%                          +6%
 ($ in trillions)                                                                                                                                                  CAGR
                                                                                                                                      CAGR                  +7%
                                                                                                                                                                           ($ in billions)
                                                                                                   Alternative AUM                                         CAGR
                                                                                                      +12% CAGR                                                     $21
  $150                                                                                                                                                      +4%             $150
                                                                                                                                                           CAGR
                                                                                                     Global AUM
  $125                                                                                                +8% CAGR                                                              $125
                                                                                                                                                            $14

  $100                                                                                             $11                                                                      $100

    $75                                                                                                                                $144                        $145     $75
                                                                       $6
                                            $5                                                               $106
                                                                                                   $98                                                     $111
    $50                                                                                                                                                                     $50
                     $3
                                           $59                        $64          $60
    $25                                                                                                                                                                     $25
                    $37
                                                         $18
      $0                       $7                                                                                                                                           $0
                    20042004              20072007                   20122012                  20172017                               Q3-19                2020E   2025E

                                                     Global AUM                Alternative AUM                 Ares AUM
                                                         (Global/Alternative AUM $ in trillions)          (Ares AUM $ in billions)

 Note: There can be no guarantee that Ares can or will sustain such growth, or that any estimates will be realized.
 1. PWC Report October, 2018 - Asset & Wealth Management Revolution: Pressure on Profitability. Data excludes High Net Worth and Mass Affluent segments.
                                                                                                                    20
Strong Growth in Fund Families
 Performance has Driven Strong Investor Demand for Larger Subsequent Funds and New Strategies

                    Private Equity: Ares Corporate Opportunities Funds                                                                      Credit: Ares Capital Europe Funds(1)
  ($ in millions)                                                                                               ($ in millions)
                                                                                                                                                                                                $7,584

                                                                                  $7,850

                                                                                                                                                                            $4,840

                                                  $3,510

                                                                                                                                                        $1,750
                        $751                                                                                                      $481

                                                                                                                                                                                  (2)
  Fund:                ACOF I                     ACOF III                        ACOF V                       Fund:               ACE I                 ACE II             ACE III             ACE IV
  Vintage:             Aug '02                    Feb '08                         Dec '15                      Vintage:           Jun '07               Aug '12             Jul '15             Jan '18

          Real Estate: Ares US Real Estate Funds                                                Credit: ARCC AUM                                        Credit: Ares Private Credit Solutions Fund
  ($ in millions)                                         $1,040         ($ in millions)      Permanent Capital Vehicle                          ($ in millions)
                                                                                                                      $16,977                               Raised $3.4Bn for Inaugural Fund, ~$1Bn in
                                               $824                                                                                                           Excess of Target, with 60% new clients
                                   $756
                                                                                                                                                                                          $3,365

                        $450

             $256

                                                                                             $183                                                                  $0

Fund:    Fund I        Fund III   Fund VII   Fund VIII   Fund IX         As of:             Dec '04                     Sep '19              Fund:                 -                        PCS
Vintage: Sep '93       Mar '98    Aug '07     Sep '13    May '17                                                                             Vintage:              -                      Jan '17

   Note: As of September 30, 2019, AUM amounts include funds managed by Ivy Hill Asset Management, L.P. Past performance is not indicative of future results. There can be no
   guarantee that Ares can or will sustain such growth. Funds shown represent final fund close amounts.
   1. Reflects equity commitments converted to USD at 1.1669 EUR/USD.
   2. Reflects both debt and equity commitments.
                                                                                                          21
Multiple Avenues for Growth
 Ares is Making Substantial Investments in Strategies to Offer More Client Solutions and is Expanding Into New Channels
 to Reach New Investors

                                                          • Larger subsequent funds
                                                          • Cross-market our strategies to existing clients
                                                          • Growth of business development and investor
                                                            relations groups
                       Organic
            1                                             • Enter adjacent asset classes
                                                          • Continue to develop differentiated solutions
                       New Products
            2                                             •   Insurance
                                                          •   Sub-advisory partners
                                                          •   Traded and non-traded retail
            3          New Channels                       •   Intermediary relationships
                                                          •   Family offices and high-net-worth

            4          New Geographies                    • Continued expansion in Europe and Asia
                                                          • Potential new international markets

            5
                       New Partnerships
                                                          • Strategic partnerships
                                                          • Joint ventures
            6
                       Strategic Mergers and
                       Acquisitions                       •       • Strategic
                                                              Acquisitions     acquisitions
                                                                           of scale
                                                          •   Tuck-in opportunities
                                                                  • Portfolio purchases
                                                          •   Management team lift-outs
                                                          •   Opportunistic portfolio purchases

                                                               22
Growth in Key Financial Metrics
 Well Positioned for Future Opportunities
                        History of Increased Performance                                                                              Strong Balance Sheet Enables Growth
                                                                                                                    ($ in millions)
                             2014                                         Q3-19 LTM

  Management Fees1                                                                                                                                         Balance Sheet Investments
                                                                             $963
  ($ in millions)                                                                                                                                                 by Strategy
                                                                                                                      Assets                     9/30/19

                                                                                                                      Cash                          $152                $49

                            $598                                                                                                                              $137
                                                                                                                                                                              $247
                                                                                                                      Investments                    726

                                                                                                                      Net Performance                                 $293
                                                                                                                                                     344
  Fee Related Earnings                                                                                                Income Receivable
                                                                             $303
  ($ in millions)

                                                                                                                                                             Credit            Real Estate

                            $147                                                                                                                             Private Equity    Other

                                                                                                                      Debt Capitalization                  Maturity             9/30/19

                                                                                                                      Credit Facility ($1,065)                 2024                     $0
  Realized Income                                                            $421
  ($ in millions)                                                                                                     Senior Notes                             2024                    246
                            $273
                                                                                                                      Total Debt Obligations                                         $246

  Note: Past performance is not indicative of future results. There can be no guarantee that Ares can or will sustain such growth.
  1. Management fees include ARCC Part I Fees.                                                                    23
Path to Shareholder Value Creation
 Shareholder Value Driven by Diversity and Composition of our AUM and Growth in our Fee Related Earnings Plus
 Reinvestment of our Realized Performance Related Earnings

                               Fee Related Earnings                                                                                             Realized Performance Related Earnings

                       16% CAGR since end of 2014                                                                             $118 million avg. annual Realized Performance Related Earnings(1)

   • Diversity and composition of AUM drive stable earnings
                                                                                                                                   • Realize accrued net performance fees

   • Record level of deployable AUM not yet earning fees
                                                                                                                                   • Realize income from balance sheet investments(2)

   • Increased fee opportunities from ARCC
                                                                                                                                   • Increase new performance fees by deploying record
                                                                                                                                     level of un-invested incentive eligible AUM
   • Increased sizes of successor funds drive earnings growth

                                                                                                                                   • Convert incentive eligible AUM into incentive
   • Increased core and adjacent fund strategies raising new                                                                         generating AUM through deployment
     AUM

                                                                                                                                   • New fundraising of incentive eligible AUM
   • Scale efficiencies to drive margin expansion

                    Steady, annual qualified dividend pegged to after-tax Fee Related Earnings(3) with retained
                                          earnings invested in organic & inorganic growth

  Note: Past performance is not indicative of future results. There can be no guarantee that Ares can or will sustain such growth.
  1. Represents three year average for the period from 10/1/2016 through 9/30/2019.
  2. Ares balance sheet investments have generated gross IRRs since inception (annualized) of approximately 10.7%.
  3. The declaration, payment, and determination of the amount of future dividends, if any, is at the sole discretion of our Board of Directors, which may change our
     dividend policy at any time.
                                                                                                                  24
Our Approach to Current Market Conditions
 We are Taking a Defensive Posture in our Investing Strategies, and our Approach is Supported by our
 Successful Playbook During Past Cycles

                 Disciplined Approach to Achieving Targeted Returns in Current Market

✓ Maintaining significant dry                                 ✓ Use conservative matched
  powder                                                        leverage

✓ Taking defensive investment                                 ✓ Focusing on strongly performing
  approach                                                      incumbent borrowers

✓ Heightened focus on selectivity                             ✓ Capitalizing on scale advantages

✓ Using flexible investing strategies                         ✓ Leveraging industry
                                                                specialization
✓ Staying senior in capital structure
  as appropriate                                              ✓ Performing enhanced due
                                                                diligence techniques

   We leverage our credit and management fee centric business model, our long-term, locked up capital,
         flexible strategies and asset light balance sheet to navigate well through business cycles

                                                      25
Appendix

Confidential – Not for Publication or Distribution   26
Ares Credit Group
    Integrated Scaled Global Platform Combines Direct Origination, Deep Fundamental Credit
    Research and Broad Perspective of Relative Value

                          $106.3 billion AUM(1)                                                                                       Advantages

            32 Partners averaging 25 years of experience
                                                                                                                            Access to Differentiated
                                                                                         Deep Investment                                                                 Ability to Express
               ~275 dedicated investment professionals                                                                       Information to Inform
                                                                                         Opportunity Set                                                                  Relative Value
                                                                                                                                Credit Decisions

         Origination, Research & Investment Management                              Leading Platform of Liquid Credit, Alternative Credit & Direct Lending Strategies

                         16 portfolio managers                                                                                                      Middle
                                                                                    Syndicated                       Alternative                  Market Cash                     Private Mezz/
        60+ industry research and alternative credit professionals                    Loans                             Credit                                                    Opportunistic
                                                                                                                                                  Flow Loans
                  ~130 direct origination professionals
               15 distressed and restructuring specialists
                                                                                                                                    Asset Based                        Project
                                                                                                       High Yield                     Lending                          Finance
                    Syndication, Trading & Servicing

              5 trading professionals in the U.S. and Europe                        Liquid Credit                                                                           Illiquid Credit
                7 dedicated capital markets professionals
  33 direct lending professionals focused solely on asset management
                                                                                                                                      Accolades(2)

              Investor Relations & Business Operations

  Established investor relations and client service across the Americas,                                                                                                    Global Fundraising, BDC
                                                                                       ARCC Received Most Honored
               Europe, Asia, Australia and the Middle East                                Designation & Highest          Top Quartile Rankings    Lender of the Year           (Americas), Lender
                                                                                                                           for Several Funds          (Europe)              (Europe), & Fundraising
                                                                                        Rankings for Best Investor                                                            (Europe) of the Year
                                                                                           Relations Program                     2Q’19                  2018
                                                                                                                                                                                     2018

                   We have experienced teams across the platform that are positioned for excellence in investing and client service
Note: As of September 30, 2019, unless otherwise noted.
1. AUM amounts include funds managed by Ivy Hill Asset Management, L.P., a wholly owned portfolio company of Ares Capital Corporation and a registered investment adviser.
2. The performance, awards/ratings noted herein relate only to selected funds/strategies and may not be representative of any given client’s experience and should not be viewed as indicative
     of Ares’ past performance or its funds’ future performance. All investments involve risk, including loss of principal.
Please see the Notes at the end of this presentation.

 Confidential – Not for Publication or Distribution                                               27
Ares Private Equity Group
     We Seek to Deliver Consistent Investment Performance in our Differentiated Private Equity Fund Families
     Across Various Market Environments

                       $25.5 billion AUM(1)                                               Multi-Asset Class Expertise / Flexible Capital
        28 Partners – Average 25 Years of Experience                                                  Structured
                                                               Stressed /                               Recap                     Growth
          ~115 dedicated investment professionals              Distressed                              Solutions                  Equity

               Several Dedicated Coverage Pods:
                                                                                        Rescue                       Structured
                                                                                       Financing                       Equity                Buyouts
       Consumer / Retail                          Energy

            Healthcare                         Industrials                            Credit                                       Equity

             Services /                       Special
            Technology                      Opportunities           Los Angeles Headquartered with Well-Established Local Market Presence

                China                            Europe                                              Boston
                                                                                                                   London
                                                                                                    New York
                                                                San Francisco             Chicago
                                                                                                                                                        Shanghai
                                                                   Los Angeles                                                              Chengdu
                          Infrastructure &
                                                                                                                                                      Hong Kong
                               Power

                 Robust                                       Differentiated                                                Systematic Approach
             Sourcing Model                                  Market Intelligence                                              to Value Creation

1. As of September 30, 2019.

 Confidential – Not for Publication or Distribution                              28
Ares Real Estate Group
 Global Real Estate Equity and Debt Platform That Combines Local Relationships, Differentiated Market Intelligence
 and Deep Property Level Experience Having Invested ~$20 Billion of Capital in 700+ Deals Since 1993

                            $12.5 billion AUM                                                                                  Leading Platform of Real Estate Strategies
    13 Partners – Average 23 Years of Experience                                                          US Senior Debt                                       US & Europe Value-Add
                   75 Investment Professionals
     Specialized Expertise Across Property Types                                                                                                                                                        US & Europe
                                                                                                                                  US Mezzanine Debt                                                     Opportunistic
    Multifamily                     Industrial                       Office
                                                                                                                                Debt                                                                  Equity
                       Retail                   Hospitality
                                                                                                                             Global Real Estate Platform with Local Reach
                                   Accolades(1)
                                                                                                                                                                                                        Legend
                                                                                                                                        New York               London        Amsterdam(4)
                                                                                                      San Francisco                                                                                       Ares Real Estate Office(2)
                                                                                                                             Chicago                                        Frankfurt
                                                                                                                                        Washington, D.C.                                                  Ares Real Estate Market
          Top 15 Real Estate                         Rated Special
                                                   Servicing Platform                                                                                          Paris                                      Coverage Location(3)
          Manager Based on                                                                            Los Angeles                                                          Luxembourg
         2014-19 Equity Raised                        2016 - 2019                                                                      Atlanta                                                            Additional Business
                                                                                                                                                               Madrid
                                                                                                                                                                                                          Infrastructure/Support
                                                                                                                                                                                                          Office

                                                                                      Access to Real-Time Property                                                      Disciplined Approach to Value
      Cycle-Tested Team & Results
                                                                                       Market & Corporate Trends                                                         Creation and Risk Mitigation

 As of September 30, 2019. Please see the Notes at the end of this presentation.
 1. The performance, awards/ratings noted herein relate only to selected funds/strategies and may not be representative of any given client’s experience and should not be viewed as indicative of Ares’ past performance or its funds’
    future performance. All investments involve risk, including loss of principal.
 2. Includes Ares Management Corporation (“ARES”) principal and originating offices where real estate activities take place.
 3. In Spain and Germany, Ares Real Estate Group does not maintain a physical office, but has an investment professional dedicated to this market.
 4. Non-Ares location providing administrative and support functions to the Ares Real Estate Group
     Confidential – Not for Publication or Distribution                                                                29
Significant Fund Performance Metrics
The following table presents the performance data for the significant fund in the Credit Group that is not a drawdown fund:
                                                                                        As of September 30, 2019
                                                                                                                                 Returns (%)(1)
                                                                                                Current Quarter                  Year-To-Date                Since Inception(2)
                                      Year of Inception AUM (in millions)                       Gross            Net           Gross           Net            Gross           Net         Investment Strategy
 ARCC(3)                                       2004                             $16,977          N/A             2.4%           N/A           8.4%             N/A          11.8%        U.S. Direct Lending

Note: Past performance is not indicative of future results. AUM and Net Returns are as of September 30, 2019 unless otherwise noted. The above table includes fund performance metrics for significant funds
which includes those that contributed at least 1% of total management fees for the nine months ended September 30, 2019 or comprised 1% or more of Ares' total FPAUM as of September 30, 2019, and for which
we have sole discretion for investment decisions within the fund. Please see significant fund performance endnotes on slides 37-38 for additional information. Return information presented may not reflect actual
returns earned by investors in the applicable fund. ARCC is a publicly traded vehicle.

                                                                                                            30
Confidential – Not for Publication or Distribution
Significant Fund Performance Metrics (cont’d)
  The following table presents the performance data for all our significant drawdown funds:
                                                                                                            As of September 30, 2019
 Credit
                                                                                       Cumulative                                                                   MOIC                          IRR
                                 Year of                        Original Capital        Invested          Realized          Unrealized
          ($ in millions)       Inception         AUM           Commitments              Capital         Proceeds(4)         Value(5)      Total Value     Gross(6)        Net(7)      Gross(8)         Net(9)    Primary Investment Strategy
     CSF III                       2010              $1,152                 $1,135            $1,209              $617           $1,128          $1,745      1.5x          1.4x         9.1%            7.8%     European & U.S. Direct Lending
     ACE III(10)                   2015              4,859                  2,822             2,428                535           2,501           3,036       1.3x          1.2x        13.7%            10.1%    European Direct Lending
     PCS                           2017              3,592                  3,365             1,678                130           1,776           1,906       1.2x          1.1x        13.6%            9.5%     U.S Direct Lending
     ACE IV Unlevered(11)                                                   2,851             1,190                 20           1,234           1,254       1.1x          1.1x        13.3%            9.7%
                                   2018              8,745                                                                                                                                                       European Direct Lending
     ACE IV Levered(11)                                                     4,819             2,007                 50           2,127           2,177       1.1x          1.1x        20.3%            15.1%
     SDL Unlevered(12)                                                        922               170                    3           175             178       1.1x          1.0x         N/A              N/A
                                   2018              4,202                                                                                                                                                       U.S Direct Lending
     SDL Levered(12)                                                        2,045               377                    7           398             405       1.1x          1.1x         N/A              N/A
 Private Equity
                                                                                       Cumulative                                                                   MOIC                          IRR
                                 Year of                        Original Capital        Invested          Realized          Unrealized
          ($ in millions)       Inception         AUM           Commitments              Capital         Proceeds(1)         Value(2)      Total Value     Gross(3)        Net(4)      Gross(5)         Net(6)    Primary Investment Strategy
     ACOF III                      2008              $3,155                 $3,510            $3,908            $7,659           $2,893        $10,552       2.7x          2.3x        29.1%            20.9%    Corporate Private Equity
     USPF IV                       2010              1,618                  1,688             2,120              1,227           1,581           2,808       1.3x          1.2x         8.4%            5.0%     Infrastructure and Power
     ACOF IV                       2012              5,625                  4,700             4,180              2,709           4,882           7,591       1.8x          1.6x        18.3%            11.8%    Corporate Private Equity
     EIF V                         2015                855                    801               794                275             690             965       1.2x          1.1x        14.3%            8.0%     Infrastructure and Power
     SSF IV(7)                     2015              1,545                  1,515             3,050              1,676           1,341           3,017       1.0x          0.9x        (1.0)%           (2.9)%   Special Opportunities
     ACOF V                        2017              8,420                  7,850             5,669                186           6,481           6,667       1.2x          1.1x        15.8%            8.0%     Corporate Private Equity
     First flagship energy
     opportunities fund*           2018              1,125                  1,000               733                    6           902             908       1.2x          1.1x         N/A              N/A     Energy Opportunities
 Real Estate
                                                                                       Cumulative                                                                   MOIC                          IRR
                                 Year of                        Original Capital        Invested          Realized          Unrealized
          ($ in millions)       Inception         AUM           Commitments              Capital         Proceeds(1)         Value(2)      Total Value     Gross(3)        Net(4)      Gross(5)         Net(6)    Primary Investment Strategy
     EF   IV(7)                    2014              $1,029                 $1,302            $1,087              $821             $881          1,702       1.6x          1.3x        19.2%            13.5%    European Real Estate Equity
     US IX*                        2017              1,035                  1,040               687                 26             680             706       1.1x          1.0x         N/A              N/A     U.S. Real Estate Equity
     EF V(8)*                      2018              1,921                  1,968               339                 41             336             377       1.1x          1.0x         N/A              N/A     European Real Estate Equity
Note: Past performance is not indicative of future results. AUM and Net Returns are as of September 30, 2019 unless otherwise noted. The above table includes fund performance metrics for
significant funds which includes those that contributed at least 1% of total management fees for the nine months ended September 30, 2019 or comprised 1% or more of Ares' total FPAUM as
of September 30, 2019, and for which we have sole discretion for investment decisions within the fund. Please see significant fund performance endnotes on slides 37-38 for additional
information. Return information presented may not reflect actual returns earned by investors in the applicable fund.
* We do not present fund performance metrics for significant funds with less than two years of investment performance, which begins on the date of the fund's first investment, except for
those significant funds which pay management fees on invested capital, in which case performance is shown at the earlier of (i) the one year anniversary of the fund's first investment or (ii) the
date on which the fund has invested at least 50% of its capital.
                                                                                                                       31
      Confidential – Not for Publication or Distribution
GAAP Statements of Operations
$ in thousands, except share data                                                             For the Nine Months Ended                                        Year Ended December 31,
                                                                                               9.30.19         9.30.18           2018           2017            2016           2015            2014
Revenues
Management fees                                                                                  $714,096           $588,071      $802,502       $722,419        $642,068        $634,399       $486,477
Carried interest allocation                                                                        503,808            72,587        42,410         620,454         494,580        146,038         63,884
Incentive fees                                                                                      28,747            13,683        63,380          16,220          23,272          4,577         27,528
Principal investment income (loss)                                                                  45,992             (684)        (1,455)         64,444          55,168         11,290          6,527
Administrative, transaction and other fees                                                          35,866            37,372        51,624          56,406          39,285         29,428         26,000
Total revenues                                                                                   1,328,509           711,029       958,461       1,479,943       1,254,373        825,732        610,416
Expenses
Compensation and benefits                                                                          485,232           419,225       570,380         514,109         447,725        414,454        456,372
Performance related compensation                                                                   388,424            30,479        30,254         479,722         387,846        111,683        170,028
General, administrative and other expenses                                                         195,988           155,523       215,964         196,730         159,776        224,798        166,839
Transaction support expense                                                                             —                 —             —          275,177              —              —              —
Expenses of Consolidated Funds                                                                      30,865            49,261        53,764          39,020          21,073         18,105         66,800
Total expenses                                                                                   1,100,509           654,488       870,362       1,504,758       1,016,420        769,040        860,039
Other income (expense)
Net realized and unrealized gains (losses) on investments                                             5,519              7,970       (1,884)         8,262         (7,629)          12,913         26,206
Interest and dividend income                                                                          5,526              6,511         7,028         7,043           4,493           6,851           6,639
Interest expense                                                                                  (16,073)           (17,088)      (21,448)       (21,219)        (17,981)        (18,949)         (8,617)
Debt extinguishment expense                                                                              —                  —             —             —               —         (11,641)              —
Other income (expense), net                                                                         (1,570)            (1,487)         (851)        19,470          35,650          21,680         (2,422)
Net realized and unrealized gains (losses) on investments of Consolidated Funds                       3,256            26,839        (1,583)       100,124         (2,057)        (24,616)        513,270
Interest and other income of Consolidated Funds                                                    303,312            250,117       337,875        187,721        138,943         117,373         937,835
Interest expense of Consolidated Funds                                                           (204,051)          (163,942)     (222,895)      (126,727)        (91,452)        (78,819)      (666,373)
Total other income                                                                                  95,919            108,920        96,242        174,674          59,967          24,792        806,538
Income (loss) before taxes                                                                         323,919            165,461       184,341        149,859        297,920           81,484        556,915
Income tax expense (benefit)                                                                        35,590             29,659        32,202       (23,052)          11,019          19,064         11,253
Net income                                                                                         288,329            135,802       152,139        172,911        286,901           62,420        545,662
Less: Net income (loss) attributable to non-controlling interests in Consolidated Funds
                                                                                                   41,878             23,418        20,512         60,818            3,386         (5,686)       417,793
Less: Net income attributable to redeemable interests in Consolidated Funds                            —                  —             —              —                —               —          2,565
Less: Net income attributable to redeemable interests in Ares Operating Group entities
                                                                                                        —                  —               —              —            456               338           731
Less: Net income attributable to non-controlling interests in Ares Operating Group entities       136,032             67,301        74,607         35,915          171,251         48,390         89,585
Net income attributable to Ares Management Corporation                                            110,419             45,083        57,020         76,178          111,808         19,378         34,988
Less: Series A Preferred Stock dividends paid                                                      16,275             16,275        21,700         21,700           12,176             —              —
Net income attributable to Ares Management Corporation Class A common stockholders                $94,144            $28,808       $35,320        $54,478          $99,632        $19,378        $34,988
Net income attributable to Ares Management Corporation per share of Class A common stock:
Basic                                                                                                $0.84              $0.25           $0.30          $0.62         $1.22           $0.23            $0.43
Diluted                                                                                              $0.81              $0.25           $0.30          $0.62         $1.20           $0.23            $0.43
Weighted-average shares of class A common stock:
Basic                                                                                         105,546,219          94,168,582    96,023,147     81,838,007      80,749,671      80,673,360     80,358,036
Diluted                                                                                       116,418,136          94,168,582    96,023,147     81,838,007      82,937,030      80,673,360     80,358,036
Dividend declared and paid per share of Class A common stock                                        $0.96               $1.05         $1.33          $1.13           $0.83           $0.88          $0.42

                                                                                                              32
RI and Other Measures Financial Summary
  $ in thousands, except share data (unless otherwise noted)                                           For the Nine Months Ended                                             Year Ended December 31,
                                                                                                        9.30.2019        9.30.2018            2018             2017             2016             2015            2014
                  (1)
Management fees                                                                                            $739,269         $612,792           $836,744         $744,825         $659,451         $650,918        $598,046
Other fees                                                                                                    13,029           17,166             24,288           22,431          12,351            4,599            6,300
Compensation and benefits expenses(2)                                                                      (391,247)        (333,487)          (456,255)        (413,735)        (384,715)       (360,622)        (354,362)
General, administrative and other expenses(3)                                                              (126,083)        (109,559)          (149,465)        (136,531)        (114,737)       (117,903)        (102,720)
Fee Related Earnings                                                                                       $234,968         $186,912           $255,315         $216,990         $172,350         $176,992        $147,264
Realized net performance income                                                                              $35,393          $54,510          $105,610          $75,457          $94,734          $56,757          $65,895
Realized net investment income                                                                                26,989           30,123             34,474           32,993          33,244           24,836           59,660
Realized Income                                                                                            $297,350         $271,545           $395,396         $325,440         $300,328         $258,585        $272,819
After-tax Realized Income, net of Series A Preferred Stock dividends (4)                                   $256,582         $239,584           $345,926         $273,624         $248,686         $224,417        $242,849
After-tax Realized Income per share of Class A common stock, net of Series A Preferred Stock
                                                                                                               $1.01            $1.01              $1.42            $1.08            $0.98           $0.83            $0.93
Dividend(5)

Other Data
Total fee revenue(6)                                                                                       $774,662         $667,302           $942,354         $820,282         $754,185         $707,675        $662,941
Effective management fee rate(7)                                                                               1.09%            1.06%             1.07%            1.06%            1.09%            1.15%            1.17%

 Note: All historical filings can be found on the SEC’s website.
 1.   Includes ARCC Part I Fees of $116.3 million and $91.7 million for YTD 2019 and YTD 2018, respectively.
 2.   Includes compensation and benefits expenses attributable to the Operations Management Group of $100.7 million and $92.8 million for YTD 2019 and YTD 2018, respectively, which are not allocated to
      an operating segment.
 3.   Includes G&A expenses attributable to Operations Management Group of $61.9 million and $55.7 million for YTD 2019 and YTD 2018, respectively, which are not allocated to an operating segment.
 4.   For the nine months ended September 30, 2019 and 2018, after-tax Realized Income includes current income tax related to: (i) realized performance income of $7.0 million and $8.4 million, respectively
      and (ii) FRE of $17.4 million and $7.2 million, respectively. Of the current tax related to FRE, this includes (a) entity level taxes of $4.7 million and $6.2 million, respectively, and (iv) corporate level tax
      expense of $12.7 million, and $1.0 million, respectively.
 5.   Calculation of after-tax Realized Income per share of Class A common stock uses total average shares of Class A common stock outstanding and proportional dilutive effects of the Ares' equity-based
      awards.
 6.   Total fee revenue is calculated as management fees plus realized net performance income.
 7.   Effective management fee rate represents the quotient of management fees and the aggregate fee bases for the periods presented. The effective rate shown excludes the effect of one-time catch-up
      fees.

                                                                                                               33
GAAP to Non-GAAP Reconciliation – Unconsolidated Reporting Basis
$ in thousands                                                                                    For the Nine Months Ended                                          Year Ended December 31,
                                                                                                   9.30.19         9.30.18              2018            2017            2016         2015              2014
Realized Income and Fee Related Earnings:
Income (loss) before taxes                                                                            $323,919        $165,461           $184,341        $149,859       $297,920        $81,484         $556,915
Adjustments:
 Depreciation and amortization expense                                                                  35,609           20,234             25,087         30,481         34,853         53,169           34,956
 Equity compensation expenses(1)                                                                        73,974           67,534             89,724         69,711          39,065        32,244           83,230
 Acquisition and merger-related expenses                                                                10,757              (19)             2,936        259,899        (16,902)        34,864           11,043
 Placement fees and underwriting costs                                                                  17,319            9,710             20,343         19,765           6,424         8,825           14,753
 Offering costs                                                                                             —                  3                 3             688             —             —                —
 Other (income) expense, net(2)                                                                          (460)           13,561             13,486         (1,730)        (1,728)           110            3,384
 Net expense of non-controlling interests in consolidated subsidiaries                                   2,608            2,178              3,343           1,739             —             —                —
 (Income) loss before taxes of non-controlling interests in Consolidated Funds, net of
                                                                                                       (41,178)        (23,500)           (20,643)        (62,705)        (2,649)         5,682         (415,075)
 eliminations
Unconsolidated performance (income) loss – unrealized                                                (426,411)          127,224            247,212      (325,915)       (228,472)      (31,647)          (94,883)
Unconsolidated performance related compensation – unrealized                                           311,936        (132,294)          (221,343)        237,392         189,582        46,492            89,429
Unconsolidated net investment (income) loss – unrealized                                              (10,723)           21,453             50,907       (53,744)        (17,765)        27,362          (10,933)
Realized Income                                                                                      $297,350         $271,545           $395,396       $325,440        $300,328      $258,585          $272,819
Unconsolidated performance income - realized                                                        $(111,881)       $(217,283)         $(357,207)     $(317,787)      $(292,998)    $(121,948)        $(146,494)
Unconsolidated performance related compensation - realized                                              76,488          162,773            251,597        242,330         198,264        65,191            80,599
Unconsolidated net investment income - realized                                                       (26,989)         (30,123)           (34,474)       (32,993)        (33,244)      (24,836)          (59,660)
Fee Related Earnings                                                                                 $234,968         $186,912           $255,312       $216,990        $172,350      $176,992          $147,264

  Note: This table is a reconciliation of income before provision for income taxes on a GAAP basis to RI and FRE on an unconsolidated basis, which shows the results of the reportable segments on a
  combined basis together with the Operations Management Group. Management believes that this presentation is more meaningful than a reconciliation to the reportable segments on a segment
  basis because such reconciliation would exclude the Operations Management Group. Differences may arise due to rounding.

  1.   For the nine months ended September 30, 2019 and 2018, equity compensation expense was attributable to the following: (i) IPO awards and other non-recurring awards of $31.0 million and
       $40.0 million, respectively; (ii) annual bonus awards of $20.9 million and $14.6 million, respectively; and (iii) discretionary awards of $22.1 million and $12.9 million, respectively.
  2.   2018 period includes $11.8 million payment to ARCC for rent and utilities for the years ended 2017, 2016, 2015 and 2014, and the first quarter of 2018.

                                                                                                           34
GAAP to Non-GAAP Reconciliation – Unconsolidated Reporting Basis (cont.)

$ in thousands                                                                                  For the Nine Months Ended                                       Year Ended December 31,
                                                                                                 9.30.19         9.30.18          2018           2017            2016           2015          2014
 Performance income and net investment income reconciliation:
 Carried interest allocation                                                                       $503,808         $72,587         $42,410       $620,454        $494,580        $146,038      $63,884
 Incentive fees                                                                                       28,747         13,683          63,380          16,220          23,272           4,577       27,528
 Carried interest allocation and incentive fees                                                    $532,555         $86,270        $105,790       $636,674        $517,852        $150,615      $91,412
 Performance income - realized earned from Consolidated Funds                                         $5,184         $4,000           4,000           8,089              —            1,769       95,308
 Performance income (loss) - reclass (1)                                                                 533          (211)             205           1,936          $2,479           7,398       14,587
 Unconsolidated performance (income) loss - unrealized                                             (426,411)        127,224         247,212       (325,915)       (228,472)        (31,647)     (94,883)
 Performance (income) loss - unrealized earned from Consolidated Funds                                    —              —               —          (2,997)           1,139         (6,187)       40,070
 Performance income - realized                                                                     $111,881        $217,283        $357,207       $317,787        $292,998        $121,948     $146,494

 Total consolidated other income (expense)                                                          $95,919        $108,920         $96,242       $174,674         $59,967         $24,792     $806,538
 Net investment income from Consolidated Funds                                                     (102,499)       (111,710)       (115,151)      (153,810)        (37,484)        (16,455)    (780,490)
 Performance (income) loss - reclass (1)                                                               (553)             211           (205)         (1,936)        (2,479)         (7,398)     (14,587)
 Principal investment income                                                                          45,336           9,544           1,047         89,031          50,408           2,043       55,748
 Change in value of contingent consideration                                                               —               —               —       (20,156)        (17,675)        (21,064)           —
 Other (income) expense, net                                                                           (460)           1,725           1,650         (1,730)        (1,728)             110        3,384
 Merger-related expenses                                                                                   —               —               —               —             —           15,446           —
 Offering costs                                                                                            —                3               3            688             —               —            —
 Other income of non-controlling interests in consolidated subsidiaries                                  (31)            (23)            (19)            (24)            —               —            —
 Investment (income) loss - unrealized                                                              (13,415)          21,046          50,809       (55,487)        (14,456)          27,362     (10,935)
 Interest and other investment (income) loss - unrealized                                              2,692             407               98          1,743        (3,309)              —            —
 Total realized net investment income                                                               $26,989         $30,123         $34,474         $32,993        $33,244         $24,836       $59,658

Note: These tables reconcile consolidated carried interest allocation and incentive fees reported in accordance with GAAP to unconsolidated realized performance income and consolidated GAAP other
income to unconsolidated realized net investment income. These reconciliations show the results of the reportable segments on a combined basis together with the Operations Management Group.
Management believes that this presentation is more meaningful than a reconciliation to the reportable segments on a segment basis because such reconciliation would exclude the Operations Management
Group. Differences may arise due to rounding.

1.   Related to performance income for AREA Sponsor Holdings LLC. Changes in value of this investment are reflected within net realized and unrealized gains on investments in Ares' Consolidated
     Statements of Operations.

                                                                                                       35
AUM and FPAUM Fee Basis Analysis

                                                                                        Components of AUM
      $ in millions
                          Q3-19                                                                   Q4-18                                                                    Q3-18
                           $1,828                                                                $1,871                                                                   $1,762
                 $22,783                                                                  $18,742                                                                  $18,119

            $26,370                                                                  $28,180                                                                  $25,834

                                       $93,317                                                                  $81,870                                                                   $79,364

                       AUM: $144,298                                                         AUM: $130,663                                                            AUM: $125,079
                                                                                                                                        (1)
                                Fee Paying AUM                       AUM Not Yet Earnings Fees                       Non-Fee Paying                      General Partner and Affiliates

                                                                                         FPAUM by Fee Basis
       $ in millions
                          Q3-19                                                                   Q4-18                                                                    Q3-18

                      $17,421   $12,532                                                                    $13,250                                                                    $12,024
                                                                                          $15,618                                                                  $15,373

                                      $33,069                                                                                                                                            $24,935
                                                                                                              $26,474
               $30,295                                                                  $26,528
                                                                                                                                                                 $27,032

                  FPAUM: $93,317                                                            FPAUM: $81,870                                                              FPAUM: $79,364
                                    Capital Commitments                     Invested Capital                     Market Value/Other                  Collateral Balances (at par)
1. Includes $7.6 billion, $6.7 billion and $6.7 billion of AUM of funds from which we indirectly earn management fees as of September 30, 2019, December 31, 2018 and September 30,
   2018, respectively.                                                                                        36
Significant Fund Performance Metrics Endnotes
Credit
1.    Returns are time-weighted rates of return and include the reinvestment of income and other earnings from securities or other investments and reflect the deduction of all trading expenses.
2.    Since inception returns are annualized.
3.    Net returns are calculated using the fund's NAV and assume dividends are reinvested at the closest quarter-end NAV to the relevant quarterly ex-dividend dates. Additional information related to ARCC can be
      found in its financial statements filed with the SEC, which are not part of this presentation.
4.    Realized proceeds represent the sum of all cash distributions to all partners and if applicable, exclude tax and incentive distributions made to the general partner.
5.    Unrealized value represents the fund's NAV reduced by the accrued incentive allocation, if applicable. There can be no assurance that unrealized values will be realized at the valuations indicated.
6.    The gross multiple of invested capital (“MoIC”) is calculated at the fund-level and is based on the interests of the fee-paying limited partners and if applicable, excludes interests attributable to the non-fee paying
      limited partners and/or the general partner which does not pay management fees or carried interest. The gross MoIC is before giving effect to management fees, carried interest, other expenses and taxes, as
      applicable.
7.    The net MoIC is calculated at the fund-level and is based on the interests of the fee-paying limited partners and if applicable, excludes those interests attributable to the non-fee paying limited partners and/or the
      general partner which does not pay management fees or carried interest. The net MoIC is after giving effect to management fees, carried interest, as applicable, and other expenses. The funds may utilize a credit
      facility during the investment period and for general cash management purposes. The net MoIC would have been lower had such fund called capital from its limited partners instead of utilizing the credit facility.
8.    The gross IRR is an annualized since inception gross internal rate of return of cash flows to and from the fund and the fund’s residual value at the end of the measurement period. Gross IRR reflects returns to the
      fee-paying limited partners and, if applicable, excludes interests attributable to the non-fee paying limited partners and/or the general partner which does not pay management fees or carried interest. The cash
      flow dates used in the gross IRR calculation are based on the actual dates of the cash flows. The gross IRRs are calculated before giving effect to management fees, carried interest, other expenses and taxes, as
      applicable.
9.    The net IRR is an annualized since inception net internal rate of return of cash flows to and from the fund and the fund’s residual value at the end of the measurement period. Net IRRs reflect returns to the fee-
      paying limited partners and, if applicable, exclude interests attributable to the non-fee paying limited partners and/or the general partner which does not pay management fees or carried interest. The cash flow
      dates used in the net IRR calculations are based on the actual dates of the cash flows. The net IRRs are calculated after giving effect to management fees, carried interest, as applicable, and other expenses. The
      funds may utilize a credit facility during the investment period and for general cash management purposes. Net fund-level IRRs would likely have been lower had such fund called capital from its limited partners
      instead of utilizing the credit facility.
10.   ACE III is made up of two feeder funds, one denominated in U.S. dollars and one denominated in Euros. The gross and net IRR and MoIC presented in the chart are for the Euro denominated feeder fund. The
      gross and net IRR for the U.S. dollar denominated feeder fund are 15.1% and 11.4%, respectively. The gross and net MoIC for the U.S. dollar denominated feeder fund are 1.4x and 1.3x, respectively. Original
      capital commitments are converted to U.S. dollars at the prevailing exchange rate at the time of the fund's closing. All other values for ACE III are for the combined fund and are converted to U.S. dollars at the
      prevailing quarter-end exchange rate.
11.   ACE IV is made up of four parallel funds, two denominated in Euros and two denominated in pound sterling: ACE IV (E) Unlevered, ACE IV (G) Unlevered, ACE IV (E) Levered, and ACE IV (G) Levered. The gross and
      net IRR and MoIC presented in the chart are for ACE IV (E) Unlevered and ACE IV (E) Levered. Metrics for ACE IV (E) Levered are inclusive of a U.S. dollar denominated feeder fund, which has not been presented
      separately. The gross and net IRR for ACE IV (G) Unlevered are 16.6% and 11.0%, respectively. The gross and net MoIC for ACE IV (G) Unlevered are 1.1x and 1.1.x, respectively. The gross and net IRR for ACE IV
      (G) Levered are 22.0% and 15.7%, respectively. The gross and net MoIC for ACE IV (G) Levered are 1.1x and 1.1.x, respectively. Original capital commitments are converted to U.S. dollars at the prevailing
      exchange rate at the time of the fund's closing. All other values for ACE IV Unlevered and ACE IV Levered are for the combined levered and unlevered parallel funds and are converted to U.S. dollars at the
      prevailing quarter-end exchange rate.
12.   Given the limited amount of time that has elapsed from the date of the first capital call, gross and net fund-level IRRs for SDL Unlevered and SDL Levered have been omitted as such information would not
      currently be meaningful for investors.

Private Equity
1.    Realized proceeds represent the sum of all cash dividends, interest income, other fees and cash proceeds from realizations of interests in portfolio investments. Realized proceeds excludes any proceeds related
      to bridge financings.
2.    Unrealized value represents the fair market value of remaining investments. Unrealized value does not take into account any bridge financings. There can be no assurance that unrealized investments will be
      realized at the valuations indicated.
3.    The gross MoIC is calculated at the investment-level and is based on the interests of all partners. The gross MoIC is before giving effect to management fees, carried interest, other expenses and taxes, as
      applicable. The gross MoIC for the corporate private equity funds is also calculated before giving effect to any bridge financings. Inclusive of bridge financings, gross MoIC would be 1.7x for ACOF IV and 1.2x for
      ACOF V.
4.    The net MoIC for the infrastructure and power and SSF IV is calculated at the fund-level. The net MoIC for the corporate private equity funds is calculated at the investment level. For all funds, the net MoIC is
      based on the interests of the fee-paying limited partners and if applicable, excludes interests attributable to the non-fee paying limited partners and/or the general partner which does not pay management fees
      or performance fees. The net MoIC is after giving effect to management fees, carried interest, as applicable, and other expenses. The funds may utilize a credit facility during the investment period and for
      general cash management purposes. The net MoIC would have been lower had such fund called capital from its limited partners instead of utilizing the credit facility.

                                                                                                                      37
You can also read