Investment Report 2018 - Savills World Research Ireland Investment
←
→
Page content transcription
If your browser does not render page correctly, please read the page content below
Investment
Report 2018

              Savills World Research
              Ireland Investment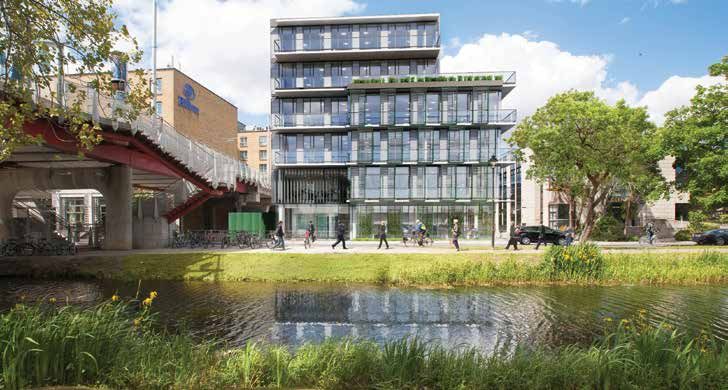
Annual Report | Ireland Investment                                                                                                            March 2018

 Definitions and Scope
 This report covers property investment across the island of Ireland in        properties without a lease agreement in place (including some forward
 2017. Its scope is limited to transactions involving income-producing         commitments) are excluded.
 property assets. As a result loan sales and transactions involving

 Introduction
 Ireland’s economy continues to perform exceptionally well with output         authorities to take action. In America the Fed has been on a tightening
 growth averaging 8% per annum over the last four quarters. Almost             cycle since December 2015, and strong US earnings data in February
 50,000 additional jobs have been created in the last 12 months and            reinforced the notion that further rate increases are coming. In the UK
 employment is back to within a whisker of its boom-time peak. The             weak Sterling is contributing to imported inflation, and this forced the
 improving labour market has contributed to a marked recovery in               Bank of England to raise interest rates last November. Since then tight
 Ireland’s public finances and a balanced budget is now expected in 2018.      labour market conditions have prompted comments that further hikes
 Looking ahead, and notwithstanding the ongoing risks associated with          could be on their way sooner rather than later. In the Euro Area there
 Brexit and US tax reform, a strong pick-up in economic growth across          is now growing evidence that that the ECB is becoming progressively
 Europe should ensure that external demand remains robust. At the same         less dovish. The monthly bond-buying target, which was reduced from
 time low inflation, a by-product of Sterling weakness, should underpin        €80bn to €60bn in April 2017, has since been halved to €30bn. Frankfurt
 domestic demand and feed through to further increases in real living          has committed to maintaining this level of stimulus until September.
 standards. Consensus forecasts are for GDP growth of 3.8% this year           Nonetheless, in the face of resurgent Eurozone growth, the tone of recent
 and 3.1% in 2019.                                                             ECB communications suggests that ultra-low interest rates in Europe
 While domestic inflation remains well in check, inflationary pressures are    may be phased out sooner than was previously expected. Already this
 building elsewhere in the world as capacity constraints start to bite after   is being priced into bond yields with German and Irish gilts drifting higher
 8 years of global expansion. Already this has caused some monetary            in recent months.

 Graph 1:
 German and Irish 10 Year Bond Yields

 As measured by IPD, capital values for prime investment property in           for further rental growth and the fact that Ireland’s prime investment stock
 Ireland rose by 1.6% in 2017 – despite a direct hit from last October’s       remains under-rented (see Graph 2) could even see yields squeeze lower
 stamp duty increase from 2% to 6%. We do not expect monetary                  in certain sectors. Beyond 2018, however, our expectation is for bond
 developments to have an immediate impact on the pricing of Irish              yields to move out further. Inevitably, this will lift the required rate of return
 investment property. While the tide is gradually turning, monetary policy     on property investments, with knock-on implications for yields.
 remains highly accommodative for the time being. Indeed, the potential

 02   savills.ie/research
Annual Report | Ireland Investment                                                                                                          March 2018

Graph 2:
Prime Property in Ireland Remains Reversionary

Market Activity
Following several years of strong trading activity investment sales returned   €395m. Perhaps a more relevant observation, then, is that 2017 sales
to more normalised levels in 2017. This is entirely as expected – post-        remained 30% above their 15-year average (see Graph 3).
crisis deleveraging led to prolific churn within the market but transactions   Interestingly, the proportion of Ex. Dublin sales increased from 14.2% in
were inevitably going to slow as more-and-more assets traded and               2016 to 18.4% in 2017. Cork accounted for 8.2% of all 2017 sales by
became locked-into longer-term ownership.                                      value – its highest weighting in the current cycle. In part this reflects the
The headline numbers show that €2.28bn of tenanted property was                influence of two large purchases by German fund Real I.S. – the €45.5m
purchased in 2017. Although this represents a 48.9% year-on-year               Capitol Building on Patrick Street (Q3) and the €31m M&S store on
decline, two atypically large deals – Blanchardstown Town Centre and           Merchant’s Quay (Q4). But it also reflects the fact that the chase for high
Liffey Valley Shopping Centre - boosted 2016 turnover by €1.58bn. In           quality product is causing investors to cast their net beyond Dublin, with
comparison the two biggest transactions of 2017 only summed to                 Cork being the next obvious location.

Graph 3:
Investment Turnover by Year

                                                                                                                             savills.ie/research       03
Annual Report | Ireland Investment                                                                         March 2018

 Investment by Lot Size                                               Graph 4:
                                                                      Average Transaction Size 2015-2017
 The average investment deal fell from €15.3m in both 2015
 and 2016 to €8.84m in 2017. However if we exclude the two
 big outlier deals of 2016 the average deal size fell by a much
 more modest 11.2% (see Graph 4).
 In addition to the absence of very large deals in 2017, the
 sectoral mix of sales played a role in reducing the average
 transaction size. In particular the share of industrial sales
 rose from 2.38% of total turnover in 2016 to 6.31% last year.
 Because industrial units tend to be cheaper – €6.25m on
 average compared with €9.1m for all other property types -
 this dragged on the average lot-size. A third factor is that,
 after four years of busy trading, fewer large standing assets are
 coming to the market. Consequently forward commitments
 and development assets are accounting for an increasing
 share of bigger deals. For the most part, however, these are
 excluded from the statistics as our definitions do not capture
 purchases of assets without an agreement for lease in place.
 This trend of fewer big deals and more small transactions is
 clearly illustrated in Graph 5; For the first time since 2012 less
 than half of the year’s investment turnover was accounted for
 by transactions of €50m or more.

 Graph 5:
 Share of Investment Spend by Lot Size

 04   savills.ie/research
Annual Report | Ireland Investment                                                                                                 March 2018

Investment by Sector
For the fourth year in five, offices enjoyed the largest share of           in the current cycle. Mixed-use schemes of just under €310m
investment turnover. Assets of €856m traded in 2017, with 37%               traded during 2017, involving 71 property assets in 64 discrete
of purchases by value taking place in Q4. However the biggest               transactions. The largest of these was the €45.5m purchase of The
deal of the year involved a retail asset - The Square Town Centre           Capitol Building in Cork. However most of the mixed-use deals
in Tallaght, South West Dublin, which was purchased for €250m by            were much smaller with an average trading price of €4.84m. Sixty
private equity buyers Oaktree Capital Partners in Q4. The Square is         two percent of the mixed-use assets that changed hands were in
the last of Dublin’s six major suburban shopping centres to trade           Dublin while 38% were situated elsewhere in the country.

Graph 6:
Investment Turnover by Sector

Given the continuing imbalance between housing demand and supply
there is a strong appetite for well-located multi-family investments.
Just under €113m of capital flowed into this sector in 2017. This
represented a decline of €147m in the year as the availability of
standing assets tightened further. Investors can still find opportunities
to buy completed buildings. However, given the scarcity of product,
those seeking to deploy larger tranches of capital are increasingly
looking to forward commitment arrangements.
As outlined above industrial emerged very strongly as a target for
property investors in 2017. This reflects the value that can still be had
in industrial units, the buoyant consumer economy which is driving
goods more rapidly through the supply chain, and the perceived
upside from technology-driven changes in the business-to-consumer
distribution channel. €144m was invested in industrial and logistics
assets during the year, a 36% increase on the 2016 figure. This
brought the industrial share of total investment turnover to 6.3% - the
highest percentage in the current cycle.
A more detailed analysis of investment within the major real estate            94 St. Stephen’s Green, Dublin 2 - Savills advised on the disposal
segments is provided below.                                                    in Q3 2017 with a quoting price of €20m

                                                                                                                     savills.ie/research     05
Annual Report | Ireland Investment                                                                                           March 2018

 Offices
 Ireland is currently experiencing 2.2% jobs growth per annum, which      Information and Communication Technology (ICT) and, to a lesser
 is rapid by both historical and international standards. However         extent, Professional Services are enjoying significant expansion.
 office-based employment in Dublin is rising even more strongly with      This has driven the office-based share of Dublin employment to
 3.6% growth in the year to September 2017. Private Administration,       almost 37% – see Graph 7.

 Graph 7:
 Office Based Employment in Dublin
            of

 Reflecting the labour market trend, 2017 was a record year for
 Dublin office lettings with take-up of 316,595 sq m. This is 4.7%
 above the high-water-mark set in 2015 and 6.5% ahead of the 2007
 peak. The pattern of lettings has been broadly consistent with the
 sectoral breakdown of jobs growth and ICT, in particular, accounted
 for 47% of gross take-up. Given the increased weighting of new
 entrants and expansions in take-up, net absorption came in at a
 robust 113,381 sq m for the year.
 There was considerable office building activity in Dublin during
 2017 with gross completions of just under 200,000 sq m for the
 year. However, netting against this, 71,063 sq m of older space was
 removed for redevelopment. As a result, net additions to the Dublin
 office stock were a much more modest 130,947 sq m.
 With net absorption of 113,381 sq m substantially offsetting the
 130,947 sq m of additions to stock, vacant space rose by less than
 17,000 sq m. Therefore the vacancy rate for purpose-built modern
 office space across Dublin only edged up marginally - from 9% in
 December 2016 to 9.2% in December 2017. As ever the vacancy
 rate varies by location and building quality. To illustrate this, less
 than 1% of the standing Grade A stock in Dublin’s South Docks
 area is currently available.

                                                                           52-55 Sir John Rogerson’s Quay - Two prime office units located
                                                                           in Dublin’s South Docks guiding in excess of €10.8m

 06   savills.ie/research
Annual Report | Ireland Investment                                                                                                                March 2018

Table 1
Analysis of Movement in the Vacant Stock – Dublin Purpose-Built 2017

                                                                                                                           Sq M
                                                                                                       Supply             Demand                  Net
    Completions                                                                                       196,287
    Withdrawals                                                                                        -71,063
    Revisions                                                                                           5,723
    Net Movement in Stock                                                                             130,947
    Lettings                                                                                                               316,595
    Pre-lets and Churn                                                                                                    -203,214
    Net Absorption                                                                                                         113,381
    Movement in Vacant Space                                                                                                                    17,566

Considerable office building is ongoing in Dublin, with 406,714 sq                        below its 12-15% equilibrium level for the foreseeable future. In this
m currently onsite and under construction. However, 46.6% of this                         context, and despite the fact that prime headline rents have already
is already committed, and old stock is still being withdrawn from                         more than doubled since their 2012 trough, Savills’ econometric
supply for redevelopment. These factors, and the expectation of                           model is forecasting further modest rental growth of approximately
2% employment growth per annum out to 2020, should ensure that                            1% per annum in 2018 and 2019.
the vacancy rate only edges up slowly. In any event it will remain

Graph 8:
Savills Forecast for Prime Headline Office Rents

Reflecting the continued strength of the occupational market,                             Eighty-two (84%) of the offices that changed hands were located
offices remains a sector of choice for investors. Although the                            in Dublin, with 10% in Cork and the remainder in Bray, Limerick,
€856m invested during 2017 was 44% down on the previous year’s                            Galway and Athlone. Of the Dublin offices, 57 were modern
figure, offices’ share of total investment turnover rose from 34% to                      purpose-built premises which, in aggregate, accounted for almost
37.5% in the year. In all, there were 80 office transactions in the                       147,000 sq m of space. This brings the total amount of modern
year, including office sales within portfolios and sales of mixed-use                     office space traded in Dublin since the beginning of 2013 to more
buildings with a substantial office element. The actual number of                         than 1.27 million sq m – over one-third of the city’s office stock.1
office assets traded was 98.
1
    Although this figure incorporates some assets that have been traded more than once.

                                                                                                                                     savills.ie/research    07
Annual Report | Ireland Investment                                                                                         March 2018

Table 2
Purchases of Purpose-Built Dublin Office Stock by Year

                                                                      Sq M                No. Assets                Average Sq M
  2013                                                              267,471                    66                      4,053
  2014                                                              406,200                    84                      4,836
  2015                                                              216,624                    57                      3,800
  2016                                                              219,903                    70                      3,141
  2017                                                              146,935                    57                      2,578
                                                                   1,257,133                  334                      3,764

 Given the increasingly stable ownership of Dublin’s
 prime stock it has become harder to buy bigger,
 better quality existing assets. Table 2 shows that
 the average size of traded buildings in Dublin has
 fallen steadily in recent years. Moreover Graph 9
 illustrates that the proportion of Grade A buildings
 has continued to decline as better quality assets
 have been bought-up. Indeed, only four Grade A
 blocks changed hands in 2017.
 But perhaps the most striking symptom of the
 tightening availability of prime offices is the sharp
 reduction in CBD / South Docks office sales.
 Graph 10 illustrates that there has been a steady
 decline in the proportion of modern office sales
 accounted for by assets in these prime locations.

                                                         77 Sir John Rogerson’s Quay - Sold by Savills in Q3 2017
                                                         for €28.7m

 Graph 9:
 Grade A Share of Office Investment

 08   savills.ie/research
Annual Report | Ireland Investment                                                          March 2018

Graph10:
Geographical Location of Sales

21 Charlemont, Dublin 2 - Acquired by Savills in Q3 2017 for in excess of €45m

                                                                                 savills.ie/research   09
Annual Report | Ireland Investment March 2018
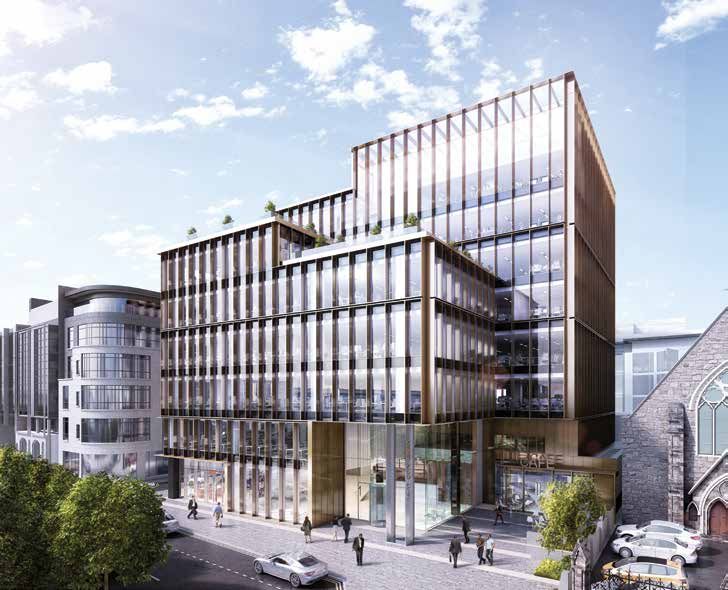
13-18 City Quay, Dublin 2 - Savills secured forward commitment of this high profile office development in Dublin’s CBD for €126.3m in Q4 2017
Table 3:
Modern Office Sales in 2017, by Location, Size and Grade
Sales Sq M Ave Sq M % Grade A % Grade B % Grade C
CBD (Including Docklands) 12 34,446 2,871 20.8 37.7 41.5
City Fringe 5 11,047 2,209 0.0 96.9 3.1
Suburban 35 91,552 2,616 3.6 75.6 20.8
Other 5 9,890 1,978 0.0 0.0 100.0
Total 57 146,935 2,578 7.1 63.3 29.7
010 savills.ie/researchAnnual Report | Ireland Investment March 2018
Looking forward, conditions in the occupational market are set to finance, forward commitment arrangements offer investors access
remain tight for the foreseeable future. At the same time Irish office to Grade A product. These transactions will continue to provide a
yields continue to look relatively attractive in a European context. route into the market for larger-scale investors in 2018. Re-trades
Together these factors will support continued investor demand for of assets bought by short-term money earlier in the cycle and the
good quality office assets in 2018. Despite there being less product ongoing break-up and resale of loan book and portfolio assets will
available than in recent years, capital will find opportunities in several also provide a continued supply of product into the market. This
areas. The speculative development pipeline is now beginning to will be facilitated by the shortening of the Capital Gains Tax (CGT)
deliver completed space on a significant scale and this will enable holding period from 7 years to 4 years in the last budget.2
investors to deploy capital. As an alternative to development
Table 4:
Top 10 Office Deals – 2017
Property Location Sold Size (Sq m) Price, €
Cherrywood Office Portfolio, Loughlinstown Dublin 18 Q4 40,575 145,000,000
13-18 City Quay* Dublin 2 Q1 10,940 126,320,000
Gardiner House Dublin 2 Q3 7,060 60,000,000
Harcourt Centre Collection Dublin 2 Q3 5,284 47,000,000
The Capitol Building, Patrick Street Cork Q3 4,754 45,500,000
21 Charlemont Dublin 2 Q3 3,422 45,000,000
The Park Portfolio, Carrickmines Dublin 18 Q2 11,837 38,600,000
76 Lower Baggot Street Dublin 2 Q4 3,734 35,900,000
5 Harcourt Centre Dublin 2 Q3 2,683 24,000,000
Chancery Building, Chancery Lane Dublin 8 Q4 2,708 23,800,000
*Forward Funding Deal
** Table includes office portfolios and mixed-use deals with large element of offices
The Exo Building, Dublin 1 - Savills secured forward funding for this prime office development in Q4 2017
2
Assets bought between 7th Dec. 2011 and 31st Dec. 2014 could be sold without a CGT liability, conditional on holding the assets for a minimum 7 years before disposal. This
holding period was reduced to 4 years in Budget 2018, meaning that the early movers can now already divest tax efficiently
savills.ie/research 011Annual Report | Ireland Investment March 2018
Retail
Ireland has enjoyed a strong labour market recovery since 2012 conditions and a meaningful pick-up in earnings growth. The
and the economy is currently creating nearly 50,000 additional jobs increased numbers at work have meant higher tax revenues
per annum. As a result unemployment has fallen from a cycle high and lower social welfare payments, creating fiscal space for the
of 16% to 6% currently, leading to more competitive recruitment Government to unwind crisis-era austerity taxes.
Table 5:
Retail Economy Dashboard
Indicator Period % Change Y/Y
Live Register Jan 2018 -14.3
Core (ex. Motors) Retail Sales Dec 2017 +7.3
Consumer Sentiment (3mma) Feb 2018 +6.3
Overseas Trips to Ireland Q4 2017 +6.2
Real VAT Receipts Jan 2018 +5.5
Real Household Disposable Incomes Q3 2017 +5.3
Consumer Credit Outstanding Balances Dec 2017 +4.4
Real Personal Consumption Expenditure Q3 2017 +2.7
Total Employment Q3 2017 +2.2
Real Average Gross Earnings Q4 2017 +2.1
Sources: CSO, CBI, KBC Bank Ireland/ESRI, Dept. of Finance.
This combination of more people at work, higher gross
earnings and lower taxes has boosted consumers’ take-home
pay by around 5% over the last year. In addition, spending
power has been enhanced by a strong expansion in consumer
credit since early 2016.
With employment growth at the root of this benign cycle, it is
perhaps unsurprising that research by economists at Savills
and the ESRI has identified jobs as by far the strongest
historical driver of growth in Irish retail ERVs. The extent
to which e-commerce has disrupted, or will disrupt this
relationship in the future, remains to be seen. So far, however,
our econometric model which relies heavily on jobs growth is
continuing to do a good job of forecasting ERV movements.
When the model was run in Q1 it forecast a 2.2% rise in the
IPD retail ERV index over the three remaining quarters of 2017.
The actual outcome was an increase of 2.7% suggesting
that retail rents, at least for prime assets, continue to follow
conditions in the consumer economy.
Boosted by the sales of Blanchardstown (€950m) and Liffey
Valley (€630m) Shopping Centres, retail overtook offices as
the biggest investment sector by turnover in 2016, accounting
for 50% of total market spend. However, with most of the
major shopping centres in Dublin and its surrounding counties
having already traded, opportunities to acquire large-scale
retail assets last year were somewhat fewer. Reflecting this,
sales of tenanted retail properties fell from €2.25bn in 2016 to
€670m last year – accounting for 29% of investment turnover.
In contrast to 2016 only one retail asset - The Square in
Tallaght – broke the €100m mark in 2017.
The Grafton Collection - A portfolio of multi-let retail buildings
off Grafton Street. Sold by Savills
012 savills.ie/researchAnnual Report | Ireland Investment March 2018
Graph11:
Share of Retail Investment by Sub-sector
Consistent with previous years, shopping centres and high street biggest high street deal of the year fell within these lots; the purchase
stores accounted for the vast majority (75%) of retail investment in of 100-101 Grafton Street by Irish Life for €50.1m.
2017, with the former remaining the largest contributor for the fourth While Dublin accounted for almost two thirds of high street purchases
straight year. However in contrast with 2016, when 21 shopping by value, Cork’s share rose sharply to 26%. This compares with just
centres were sold, just six malls (and a single unit within a seventh) 7% and 3% in 2015 and 2016 respectively. Underpinning this were
traded in 2017 for a combined €271m. As a result, shopping centres’ the acquisitions of M&S on Merchants Quay (€31m) and a three-asset
share of overall retail turnover fell to 40%. It should also be noted that portfolio with a total value of €23.65m which was purchased off-market
approximately 90% of the value of 2017 shopping centre deals was in Q4. While Cork’s increased contribution reflects the opportunities
accounted for by The Square Town Centre in Tallaght which was the that came to the market, it also demonstrates the strength-in-depth of
single biggest investment transaction of 2017. As mentioned above, Ireland’s economy; the South West (incorporating Cork and Kerry) has
this sale represents the last of Dublin’s six major suburban malls to added almost 48,000 net new jobs since the low-water-mark in Q1
trade in the current cycle. Given that most are now in stable longer- 2011 – accounting for 15% of Ireland’s total jobs growth in that period.
term ownership, further trading of shopping centres is likely to focus
Just over €100m was invested in neighbourhood retail assets last
on smaller neighbourhood malls and regional assets.
year - four times the 2016 total. One-quarter of this was accounted for
Approximately €235m was invested in high street assets in 2017, by the sale of the Avoca Collection incorporating two stores - one in
representing 35% of overall retail spend. Twelve months ago we Rathcoole, West Dublin, and the other in Kilmacanogue, Co. Wicklow
highlighted the relatively limited opportunities to invest in prime assets - for a combined €26.25m. Excluding this deal, the average lot size in
of this nature - given that they too are now generally in stable longer- the neighbourhood sector was just under €2.9m last year. This made
term ownership - and this was again evident in 2017 with just three it a popular investment with private individuals, and 81% of known
shops trading in Dublin’s Grafton Quarter last year. Unsurprisingly, the buyers fell into this category.
Table 6:
Top 5 Retail Deals – 2017
Property Location Sub Sector Quarter sold Price, €
The Square Town Centre, Tallaght Dublin Shopping Centre Q4 250,000,000
100 - 101 Grafton Street, Dublin 2 Dublin High Street Q3 50,110,000
M&S Merchants Quay, Cork Cork High Street Q4 31,000,000
Avoca Collection (two assets) Dublin Neighbourhood Shopping Q3 26,250,000
Off-market Portfolio (three assets) Cork High Street Q4 23,650,000
savills.ie/research 013Annual Report | Ireland Investment March 2018 73 & 74-75 St. Patrick’s Street, Cork - Sold by Savills in Q4 2017 for €6.5m Ireland’s economic backdrop remains favourable for retail property employment growth is a strong leading indicator of movements in with every dial on the consumer dashboard pointing in a positive retail rents. ERVs have risen by 20.7% since their cycle low (and direction (see Table 5). Consensus forecasts indicate further by 49.1% in Grafton Street). Our forecasting models are predicting compounding jobs growth of 2.3% and 1.9% in 2018 and 2019 further rental growth of 4% (overall) and 7.9% (Grafton Street) in respectively. As outlined above, Savills’ analysis shows that 2018 with increases continuing into 2019 (see Graph 12). Graph12: Grafton Street Rents Forecast Q1 2018 – Q3 2019 With opportunities to acquire large-scale retail assets in and around commitments may also provide opportunities for buyers seeking to Dublin now limited, provincial and neighbourhood investment is deploy more capital. However, while a retail development pipeline likely to feature more prominently. With a higher yields and smaller now exists, it is quite limited. This suggests that retail’s share of lot sizes, regional assets may appeal to shorter-term private money. investment turnover is likely to remain at a lower proportion of total There is, however, potential for consolidation in regional retail assets sales than in the recent past. which could provide additional investment opportunities. Forward 014 savills.ie/research
Annual Report | Ireland Investment                                                                                                                                March 2018

Residential
Due to strong demographic pressures and chronic under-building,                            €112.83m of capital flowed into the sector in 2017, through 17
residential prices have been rising rapidly over several years, and                        transactions (excluding student accommodation and mixed-use
this continued in 2017. Nationally, house prices rose by 12.3% in                          schemes with significant residential content). This represents a 56%
the year with Dublin prices increasing by 11.6% off a much higher                          decline on the 2016 investment value (€260m), with the headwind
base. In contrast, latest data show that average earnings only                             entirely on the supply side of the market.
picked-up by 2.5% (nominal). Notwithstanding the fact that tax cuts                        As described in last year’s report, professional investment in the
have provided an additional boost to take home pay, this mismatch,                         Irish residential sector is evolving rapidly. In the early stages of
along with strictly controlled mortgage lending, has made owner                            Ireland’s recovery opportunistic investors were able to buy entire, or
occupied housing less affordable. Together with factors such as                            nearly entire, blocks of apartments that were originally built for sale
a return to strong in-migration3, this has contributed to a 39,500                         as individual units. In the intervening years the availability of these
increase in the number of persons renting privately in the year to                         assets has become depleted. Investors have responded to this
June 2017. With the supply of rental properties failing to keep pace                       scarcity in several ways. Firstly they have become more willing to
with demand, vacancy rates have continued to fall and now stand                            accept fractured ownership in schemes where some of the units are
at an estimated 1.4% in Dublin. Inevitably this has led to upward                          held by existing investors or owner-occupiers. This is illustrated in
pressure on rents. Notwithstanding the introduction of rent controls                       Graph 13. Back in 2012 all multifamily transactions involved buyers
in late 20164, residential rents rose by 9.5% nationally in the year to                    taking complete ownership of the blocks. Since then the number of
September 2017, and by 9.9% in Dublin.                                                     units purchased has been steadily falling relative to the total number
Understandably, given tight conditions in the occupational market                          of units in the blocks where deals took place. In 2017 597 units
and no realistic prospect of this changing in the medium-term,                             were purchased in schemes containing 1,729 units – indicating that,
investor demand for Irish PRS product is very strong. In total                             on average, investors were prepared to accept 34.5% ownership.

Graph13:
Units Purchased as Percentage of Total Units

A second response has been to target smaller opportunities. As                              Dublin for access to this market – as shown in Graph 15 the Ex.
shown in Graph 14 the average number of units per multifamily                               Dublin share of purchased units doubled to 24% between 2016 and
transaction has been on a steady downward trend as the                                      2017. Of the multifamily blocks traded last year, three were in Cork
opportunities to buy bigger blocks of standing assets have dried                            and two were in Galway.
up. Tight availability is also causing some buyers to look beyond

3
  Ireland experienced net emigration between 2010-2014. Since then the flow has turned positive, with net in-migration rising from 5,900 in 2015 to 16,200 in 2016 and 19,800
in the year to April 2017. Previous research shows that immigrants are much less likely to be owner-occupiers (see Duffy (2007) The Housing Tenure of Immigrants in Ireland.
ESRI Working Paper No.188).
4
 A detailed description of these rent controls, along with the derivation of the PRS vacancy rate and formal rental growth forecasts, can be found in Savills report Shifting
Ownership in Ireland’s Rented Sector, November 2017. Available at http://pdf.euro.savills.co.uk/ireland-research/privaterentedsector2017v8.pdf

                                                                                                                                               savills.ie/research          015
Annual Report | Ireland Investment March 2018 Dublin Living - Ireland’s largest PRS opportunity. Currently being sold by Savills for a consideration in excess of €425m Graph14: Average Number of Units Per Multifamily Transaction The increased weighting of Ex. Dublin transactions and the trend granular. This has created opportunities for smaller players to return towards fractured ownership have led to a sharp decline in the to the market; the value of private individuals’ and syndicates’ average deal size. As shown in Graph 16 the average income- investment in Irish PRS has risen sharply and their share is now producing multifamily investment peaked at €23.4m in 2015 but slid back above 15% of the total multifamily spend. to just under €6.6m in 2017 as the available product became more 016 savills.ie/research
Annual Report | Ireland Investment                                                                                    March 2018

Graph15:                                                                   Graph16:
Percentage of Multifamily Units                                            Average Multifamily Deal Size
Purchased Outside Dublin

The Elysian, Cork - Savills is currently selling this residential investment via an off-market process

                                                                                                         savills.ie/research   017
Annual Report | Ireland Investment March 2018
Table 7:
Top 10 Multifamily Deals in 2017
Property Location Sold Price € Units sold
North Bank, North Docks Dublin 1 Q4 45,000,000 124
The Arena, Tallaght Dublin 24 Q3 9,000,000 63
Leeside Apartments, Bachelor Quay Cork Q4 8,425,000 78
Castleforbes Square Dublin 1 Q3 6,900,000 28
The Maltings, Watling Street Dublin 8 Q4 6,800,000 47
Abberley Square, Tallaght Dublin 24 Q3 5,800,000 50
Cuirt na hAbhainn, Liosban, Tuam Road Galway Q2 5,000,000 42
Block 9, Prospect Hill, Finglas Dublin 11 Q4 4,674,000 28
Culvert Apartments, Pim Street Dublin 8 Q3 4,050,000 27
Hanbury Mews, Hanbury Lane Dublin 8 Q1 4,000,000 25
With the market for standing residential investments becoming Others have taken a different approach and have entered into
more granular, investors seeking to deploy larger tranches of capital forward commitment arrangements to acquire rental stock. Both
have turned to design-and-build opportunities. Several distinct Tristan Capital Partners and German institution Patrizia have taken
approaches are being taken to this. Where development finance a forward purchase route at Honeypark in Dun Laoghaire. This
is in place some are seeking to access the market by developing involves committing in advance to buy a completed block at a fixed
their own build-to-rent schemes directly. Examples include IRES price. This mechanism de-risks the project, making it possible for
the Irish listed REIT, which is currently building rental housing at the developer to finance the build-out costs. In a slightly different
Hansfield Wood in Clonsilla, and, subject to planning consent, is arrangement Marlet Property Group is in advanced discussions
hoping to build rental apartments at Rockbrook in Sandyford, South with a preferred bidder to forward fund the development 1,205
Dublin. Kennedy Wilson, which was a large-scale buyer of standing rental apartments across four sites in Dublin. In this model the
PRS blocks earlier in the cycle, has also transitioned towards this investor buys the site from the developer up-front and then funds
model. It has already developed a build-to-rent scheme at The the developer to complete the scheme. It is worth reiterating that,
Vantage in South Dublin and is currently working on Phase 2 at although they facilitate capital inflows, these forward commitment
Clancy Quay, and on the residential element of its Capital Dock deals are generally not captured in our investment figures. Savills’
scheme in Dublin’s South Docks. Meanwhile US company Hines definition of a property investment requires a building to have an
is working in partnership with Dutch pension firm APG on plans to agreement for lease in place and to be producing a rental income.
develop more than 1,200 purpose-built rental units at Cherrywood
in South Dublin.
Table 8:
Key PRS Forward-Purchase Transactions in 2017
Investor Developer Location Units Price €
Patrizia Cosgrave Property Honeypark, 319 132,000,000
Group Dun Laoghaire,
Co. Dublin
Tristan Capital Partners Dwyer Nolan Elmfield, 138 51,000,000
Ballyogan Road,
Leopardstown, Dublin 18
IRES REIT Dwyer Nolan Hampton Wood Square, 128 40,000,000
Finglas,
Dublin 11
018 savills.ie/researchAnnual Report | Ireland Investment March 2018
Industrial
Last year we highlighted growing investor demand for industrial property continues to account for a relatively small proportion of
property assets, with investment in the sector rising by 53% to overall investment turnover, its share has been growing for three
€106m in 2016. This trend continued in 2017 with a further increase straight years (see Graph 17).
of 36% bringing investment to just under €144m. While industrial
Graph17:
Industrial Property’s Share of Total Investment Turnover
The Gibson Hotel - Sold by Savills in Q4 2017 for in excess of €90m
savills.ie/research 019Annual Report | Ireland Investment March 2018 Several factors are whetting investors’ appetite for industrial office and retail investments have risen by around 12% in the last and logistics units. Most fundamentally the strength of the Irish 18 months, the industrial index has risen by 17.3%. Furthermore, consumer economy, along with what appears to be a rapid following years of robust growth in office and retail investment, some penetration of e-commerce, has led to perceived upside and funds are seeking to balance their CRE portfolios by increasing investors see industrial property as a means of driving total portfolio their industrial weighting. Finally, despite the appetite for industrial returns. Indeed, these perceptions are borne out by recent market properties, these buildings can still be bought at a significant evidence - MSCI data show that, while the total returns indices on discount to other asset classes (see Graph 18). Graph 18: Net Initial Yields on Commercial Property Notwithstanding a marked pick-up in the average lot size, from €3.4m that investors who bought industrial and logistics units between 2012- in 2016 to €6.3m in 2017, a general shortage of good quality large- 2014 can either already trade out of them tax efficiently or will shortly scale modern properties continues to curtail investment volumes. Just be able to do so. This should lead to increased availability of stock. three lots topped €20m last year, while only four exceeded €10m. Development will provide further opportunities for those seeking Looking ahead the strength of the economy should see continued to deploy larger capital. Some funds and institutions are already strong demand for industrial assets. On the supply side, the reduction developing their own assets while the pipeline of speculative building in the Capital Gains Tax (CGT) holding period from 7 to 4 years means will provide further opportunities. Table 9: Top Ten Industrial Deals in 2017 Property Location Sold Price € Off Market - North Dublin Industrial Investment Dublin Q4 30,000,000 Off Market - Unit Q1, Aerodrome Business Park Co. Dublin Q1 28,000,000 Unit 2 Merrywell Business Park, Ballymount Dublin 12 Q3 25,000,000 Unit 21, Fonthill Industrial Park, Clondalkin Dublin 22 Q2 11,050,000 Unit 1 Stadium Business Park, Ballycoolin Dublin 11 Q4 8,650,000 Off Market Not Disclosed Q3 7,100,000 Building 2 Parkmore Business Park, Galway Galway Q1 6,000,000 Building 3, Parkmore West, Galway Galway Q4 6,000,000 Galway Crystal, Renmore, Galway Galway Q2 3,500,000 Unit 2, Swords Business Park, Swords Co. Dublin Q2 €2,850,000 020 savills.ie/research
Annual Report | Ireland Investment                                                                                              March 2018

Investment by Buyer Type
The lines between core, core-plus and opportunistic buyers have          yield and specification requirements of institutional buyers. In this
become increasingly blurred in recent years as investors have            context, and as discussed above, core investors are increasingly
adapted their business models. This, along with increasingly             seeking access to the Irish market through development plays –
competitive market conditions, makes an analysis of buyer types          either directly or via forward-commitment arrangements.
along rigidly defined lines increasingly challenging. Nonetheless        Early-on in the economic recovery, risk-embracing Private Equity
there does appear to have been a marked shift in the investor profile.   (PE) firms were the most active buyers in the market, accounting
From being absolutely inactive in 2012, institutions and REITs rose      for 53% of total investment turnover in 2012. But with prime assets
to become the dominant buyers in recent years. Their share of            becoming more fully-priced as Ireland’s economy strengthened, this
turnover rose from 32% in 2013 to almost three-quarters of the           flow of capital slowed in recent years. However PE made a return
annual spend by 2016. In total almost €8bn of core money flowed          in 2017 as the higher yielding, more granular assets coming to the
into the Irish property market over this four-year period. However       market provide a good fit with the investment objectives of private
Graph 19 illustrates that this pattern reversed quite abruptly in        equity investors. In total PE buyers accounted for €745m (32.7%)
2017; Institutional / REIT investment fell from €3.32bn to just shy of   of investment turnover in 2017.
€811m in 2017. This reflects the fact that an increasing proportion
of standing investment opportunities in the market do not meet the

Graph 19:
Investment Turnover by Buyer Type

Retail accounted for 45% of the PE spend in 2017. Seven out of           With the strength of Ireland’s economic recovery syndication was
the eight high street shops bought by PE investors were regional         inevitably going to make a comeback. This source of capital
assets. Similarly, of the three retail parks purchased by PE money,      accounted for less than 1% of market turnover in 2016 but rose to
only Ballymount Retail Centre was in Dublin. Offices accounted           5.2% in 2017. In all, private syndicates organised by various wealth
for one third of the PE spend. Of the 24 office assets bought by         management intermediaries deployed €117.6m in a wide range of
these players nineteen were in Dublin. But, of these, only two were      assets. The largest syndicate purchase was The Park Collection –
in the Central Business District. Among the remainder 11 were in         which included four buildings in Carrickmines, South Dublin – by
suburban locations and three were in the City Fringe. A further five     Cantor FitzGerald Syndicated Fund for €38.6m in Q2.
buildings were bought outside the capital – three in Cork and one
each in Limerick and Athlone.

                                                                                                                 savills.ie/research    021
Annual Report | Ireland Investment March 2018 Investment by Seller Type 2016 saw very significant selling of older properties by the institutions Grade C buildings, with three Grade Bs and only a single Grade A and REITs as they sought to make room for the €3.32bn of newer property. The average age of the office assets being disposed of properties bought-in to improve the quality of their portfolios. For by the institutions was 18 years. Core investors also traded-out 10 the second year in succession the institutions remained the biggest retail assets with two of these being sold as a portfolio. Of the five sellers in the market in 2017. However, reflecting the fact that their high street shops sold, three were in Cork and two were in Dublin buying activity slowed, the share of sales accounted for by these core city centre. Only one of these assets, 100-101 Grafton Street, was investors also fell; from 33.3% in 2016 to 21.8%. Offices accounted traded back into the hands of an institutional buyer. for eight of the 19 institutional sales in 2017. Four of these were Graph 20: Investment Turnover by Seller Type The second biggest seller of income producing property in 2017 was Bank PRS scheme (€45m) – lifted the share of receivership sales up private equity. Given the typical PE investment horizon of 3-5 years from 12.5% in 2016 to 18.9% last year. Nonetheless the €432m of it is not surprising to see some of the opportunistic early movers receiver sales in 2017 remains a fraction of the €975m and €1.68bn take profits. However it is interesting to note that 2017 PE sales figures recorded in 2013 and 2014 respectively when the post-crisis were 60% down on 2016. And, given the pick-up in acquisitions by deleveraging was at its height. With most of the distressed assets private equity investors, 2017 saw PE return to being a net investor now having been worked through, and with the economy expected in the Irish market for the first time since 2015 (Graph 21). to continue performing strongly, our view is that receivership sales The fact that receivers were on the sell side of two substantial will remain on a downward trajectory. transactions in 2017 – the Gibson Hotel (€90.2m) and the North 022 savills.ie/research
Annual Report | Ireland Investment                                                                                                 March 2018

Graph 21:
Private Equity Purchases and Sales 2012-2017

     Summary and Outlook
     Investment conditions remained favourable in 2017.                   After four years of very busy trading the market for standing
     Continuing economic expansion saw occupational markets               assets has become more granular. While there are still
     tighten and rents increase across all sectors of the market.         opportunities for large scale investors to buy prime assets, the
     At a global level, monetary policy remained accommodative,           trade in existing properties has shifted somewhat towards fringe
     leading to a natural channelling of capital into real estate         and regional locations, older buildings and lower price points.
     assets. And, given that yields in Ireland remain higher than         In saying this core investors are continuing to find an outlet
     those in many other European countries, the Irish market             for larger tranches of capital through forward commitment
     particularly benefited from this inflow. Indeed, it is interesting   arrangements. Moreover, with the speculative development
     to note that foreign investors continued to account for more         pipeline now delivering significant quantities of new stock,
     than half (53.3%) of the total investment spend in 2017.             investors will increasingly find opportunities to buy newly
     Notwithstanding benign conditions, investment turnover               completed buildings – particularly offices and residential blocks.
     fell substantially in 2017. This was entirely as expected            Looking ahead we expect favourable investment conditions to
     given huge market activity over recent years as the post-            continue. On the demand side, consensus forecasts indicate
     crisis deleveraging process took place. With many prime              that Ireland’s economy should outperform again in 2018 and
     assets having traded since 2013 – some more than once –              2019. This will underpin occupational markets and our forecast
     an increased proportion of the existing property stock is            is for further rental growth across all sectors of the market.
     now in the hands of longer term capital and a slowdown in            While interest rates are destined to eventually begin migrating
     transactional activity was inevitable.                               back to more normalised levels, current thinking is that rate
     As ever, Dublin offices were a key target for investors in 2017,     hikes are unlikely before mid-2019. On the supply side, we
     and offices enjoyed the highest sectoral share of turnover for       believe the trend towards forward commitment arrangements
     the fourth year out of five. However a notable feature of 2017       will continue. But speculative development and re-trades will
     was the increased appetite for industrial and PRS investments.       also ensure ample opportunities for investors of all shapes and
     In a strongly expanding economy, with technology modifying           sizes to deploy capital.
     the relationship between businesses and consumers, and with
     population growth outstripping house building, we expect this
     to continue.

                                                                                                                   savills.ie/research     023
Market in Minutes | Ireland
Table 10:
Yield Matrix.
Q4 2017 Q4 2018(f)
Offices - Prime CBD Yields 4.00% 4.00%
Offices - Secondary CBD Yields 5.25% 5.25%
Industrial - Prime Yield 5.50% 5.25%
Industrial - Secondary Yield 8.00% 7.50%
Shopping Centres - Prime Yields 4.50% 4.50%
Shopping Centres - Secondary Yields 6.25% 6.25%
Warehouse Retail - Prime Yields 5.00% 4.50%
Warehouse Retail - Secondary Yields 7.00% 6.75%
High Street - Prime Yields 3.50% 3.50%
High Street - Secondary Yields 5.50% 5.50%
Prime PRS 4.50% 4.00%
Savills Research and Investment Teams
Please contact us for further information
John McCartney Domhnaill O’Sullivan Fergus O’Farrell Dessie Kilkenny
Director of Research Director, Director, Director,
+353 (0) 1 618 1427 Investment Investment Investment
john.mccartney@savills.ie +353 (0) 1 618 1364 +353 (0) 1 618 1311 +353 (0) 1 618 1401
domhnaill.osullivan@savills.ie fergus.ofarrell@savills.ie dessie.kilkenny@savills.ie
Savills is a leading global real estate service provider listed on the London Stock Exchange. The company established in 1855, has a rich heritage with unrivalled growth.
It is a company that leads rather than follows, and now has over 180 offices and associates throughout the Americas, Europe, Asia Pacific, Africa and the Middle East. A
unique combination of sector knowledge and entrepreneurial flair give clients access to real estate expertise of the highest calibre. We are regarded as an innovative-thinking
organisation backed up with excellent negotiating skills. Savills chooses to focus on a defined set of clients, therefore offering a premium service to organisations with whom
we share a common goal. Savills takes a longterm view to real estate and works hard to invest in long term and strategic relationships and is synonymous with a high quality
service offering and a premium brand. This bulletin is for general informative purposes only. Whilst every effort has been made to ensure its accuracy, Savills accepts no
liability whatsoever for any direct or consequential loss arising from its use. All references to space and floor areas are approximate and apply to the greater Dublin area. The
bulletin is strictly copyright and reproduction of the whole or part of it in any form is prohibited without written permission from Savills Research. (c) Savills Ltd.You can also read