Listing South Africa's Most Iconic Property Assets - Investor Presentation November 2016 - The Vault
←
→
Page content transcription
If your browser does not render page correctly, please read the page content below
Listing South Africa’s
  Most Iconic Property
  Assets

          Investor Presentation
                  November 2016

                                  1
Introduction

•   Liberty Group Limited’s (“Liberty”) existing property portfolio (“LPP”) is one of South Africa’s leading retail property portfolios with
    world-class assets such as the Sandton City Complex, Eastgate Complex and Melrose Arch
•   A portion of the LPP is being made available to investors through the listing of participatory units in a Collective Investment
    Scheme in Property (“Liberty Two Degrees”) which will co-own the properties alongside Liberty
•   The listing of Liberty Two Degrees is a unique opportunity to invest in one of South Africa’s most iconic retail property
    portfolios

                                                                                                                                               2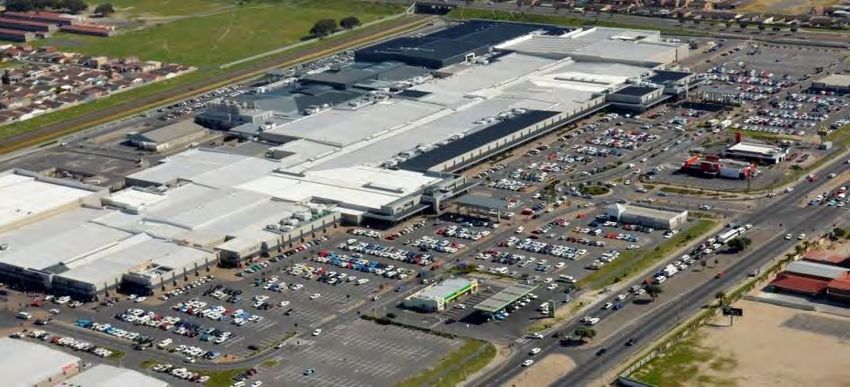
IPO structure
                                                                                                                  •   JSE Main Board
Issuer                  •   Liberty Two Degrees                                       Listing
                                                                                                                  •   Real Estate Sector

                        •   Institutional tranche: R 2.0bn
                        •   Liberty subscription: R780m
Offer size                                                                            Marketing strategy          •   Private placement to South African investors only
                        •   Secondary sale of up to R1.0bn from Liberty Shareholder
                            Investment Portfolio

Expected market
                        •   c.R9.1 billion                                            Free float                  •   Expected free float 22% ─ 33%
capitalisation

                                                                                                                  •   R10.00
Loan to value           •   0%                                                        Offer price
                                                                                                                  •   Fixed price offer

                                                                                                                  •   Financing of acquisitions and current development
Yield                   •   6.5%                                                      Use of proceeds
                                                                                                                      pipeline

Listing date            •   Early December 2016                                       Securities offered          •   Participatory units only

                        •   Liberty Shareholder Investment Portfolio: 180 days                                    •   R2.0 billion primary issuance
Lock-ups                                                                              Primary / secondary split
                        •   Management: 365 days                                                                  •   Up to R1.0 billion secondary subject to demand

                                                                                                                  Liberty Two Degrees’ counsel
                        Joint Co-ordinators and Joint Bookrunners
                                                                                                                  • Webber Wentzel
Syndicate               • Standard Bank                                               Legal counsel
                                                                                                                  Bookrunners’ counsel
                        • Java Capital
                                                                                                                  • Cliffe Dekker Hofmeyr

                                                                                                                  •   JLL
Reporting Accountants   •   PricewaterhouseCoopers                                    External Valuers            •   Mills Fitchet
                                                                                                                  •   Rode and Associates
                                                                                                                                                                          3
Investment highlights

             Defensive, prime and iconic real estate assets
              • Prime super-regional real estate tapping into the entire LSM spectrum with exposure to foreign spending power
              • Defensive portfolio located in major economic nodes anchored by South Africa’s leading real estate assets
              • Blue-chip tenant base with strong new tenant demand for prime GLA

                     Industry-leading management team
                        • Industry-leading professionals with extensive property experience and knowledge of
                           the assets
                        • Sustained track record in managing, developing and acquiring South Africa’s flagship property assets and RoA
                           property investments
                        • Ongoing access to STANLIB and Liberty support infrastructure

                   Growth opportunities in SA and RoA
                      •    R2.8bn capital raise to support identified acquisition pipeline
                      •    Initial focus of Liberty Two Degrees will be on growing its South African footprint
                      •    Considered investment into RoA aligned to Liberty Two Degrees’ focus on quality assets with a retail bias
                      •    Significant investment in existing assets of over R2.5bn between 2011 – 2016 underpins future growth

            Robust income growth with unique gearing flexibility
              • Long track record of benchmark-beating returns
              • Ungeared balance sheet attractive in current climate and gives Liberty Two Degrees the capacity to further augment its
                 growth story

                                                                                                                                         4
Listing rationale

                    •   Gain / desire for exposure to listed property within Liberty’s product range
                         ‒     Enhanced returns via gearing of the portfolio
Address customer         ‒     Creates efficient platform to access equity and debt capital
    demand               ‒     Growth in the portfolio through new developments and acquisitions
                         ‒     Measured exposure to growth markets including Rest of Africa economies
                         ‒     Potential to trade at a premium to NAV

                    •   Efficient mechanism for Liberty to match policyholder liquidity requirements
    Liquidity
                    •   Facilitates access for institutional and retail investors

Access to capital   •   New channels to access capital for the benefit of both investors and Liberty’s policyholders

                                                                                                                       5
IPO building blocks

                                                                 Institutional offer
      Institutional
        offering

                              R2 billion          R2.8           • New capital raised from institutional and cornerstone investors
                                                  billion IPO    • Listing early December
                                                  proceeds

                                                                 Liberty new policy sales
  policy
  sales
  New

                            R780 million
                                                                 • Liberty will subscribe for R0.78bn capital raised from new policy sales
  Liberty shareholder

                                R3 billion                       Liberty shareholder exposure
                          (may be reduced by
       exposure

                                                                 • Liberty will move its shareholder exposure in the LPP to Liberty
                            up to R1 billion if
                                                                    Two Degrees
                             secondary sale                                                                                                  Switches and sales closed
                                                                 • Units sold by Liberty through a secondary sale will not be issued to
                                 occurs)                                                                                                     31 October
                                                                    Liberty at a discount
                                                                                                                                             The switches and policyholder
                                                  R6.0billion
                                                                                                                                             investment in the REIT will be
                                                  switches out                                                                               effected at a 5% discount to the IPO
                                                  of LPP                                                                                     price
   Liberty policyholder

                                                                 Policyholder switches
                                                                 • Policyholders will switch exposure from the LPP into a new
         switches

                              R3 billion                            portfolio offering within Liberty
                                                                 • First-come, first-served basis
                                                                 • Capped at R3bn

                                                                                                                                                                                    6
Portfolio assets
Value underpinned by
  location and tenant

                        7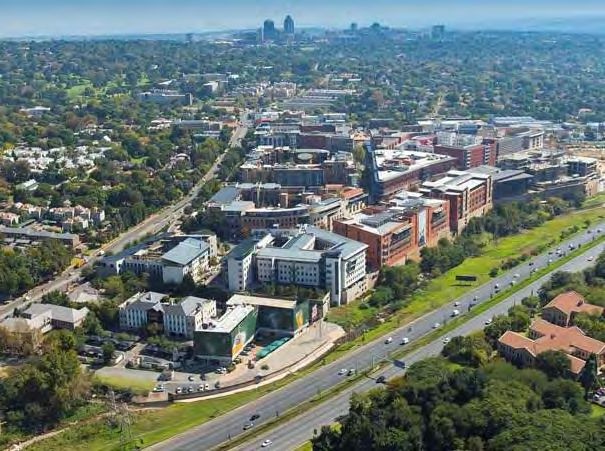
LPP’s transformation to iconic status

                                                Liberty Midlands                                         Transfer of asset                             Liberty acquires         Eastgate
                                                   Mall opens                                           management function                              25% stake in      refurbishment and
                                                                                                            to STANLIB                                  Melrose Arch            extension
                                                                                                                                                                                complete
 Sandton City                  Nelson Mandela                             Liberty Promenade is                                Sandton Office Tower     Nelson Mandela
    opens                       Square opens                                bought by Liberty                                   façade upgrade         Square upgrade
                                                                                                                                                          complete

    1973         1979              1994              2002          2003          2004            2011          2012                   2014                  2015               2016

           Eastgate Shopping                             Nelson Mandela Statue           Sandton City Protea                     Redevelopment                        Botshabelo Mall opens
             Centre opens                                       unveiled                    Court opens                          of Atrium on 5th
                                                                                                                                                    Sandton City Diamond
                                                                                                                                                         Walk opens

                                                                                                                                                                                               8
An iconic, defensive portfolio
         Robust performance metrics that will deliver sustained and defensive returns

Property portfolio value1                                                       R27.4 billion
Number of properties2                                                                      11
Attributable GLA                                                                 615 826m2
    Retail                                                                              68.2%
    Office                                                                              28.4%
Gross rental income                                                                R595.7m
    Retail                                                                              82.9%
    Office                                                                              16.0%
Vacancy rate                                                                            5.9%
Weighted average trading    density3                                           R45 663 / m2
Weighted average gross rent to sales3                                                   9.4%
Weighted average rental                                                           R270 / m2
    Retail                                                                      R322.3 / m2
    Office                                                                      R161.3 / m2
                                       Financial metrics

Value per square metre (R’000 / m2)                                                      44.5
2016 / 17 weighted average rental escalation                                            7.1%
Forward yield                                                                           6.5%
2017 / 18 NPI growth management guidance                                         7.0 – 9.0%
Premium to NAV                                                                          5.0%
                                                                                                1.   Valuations at 31 October 2016. All metrics per PLS unless stated otherwise
Gross cost to income 2016                                                               31.3%   2.   Currently LPP owns 100% of portfolio assets except for Sandton City (75%), Botshabelo (70%),
                                                                                                     Melomed Hospital (70%) , Standard Bank Centre (50%) and Melrose Arch (25%)
                                                                                                3.   Retail Live Stats, as at 31 July 2016                                                          9
Prime properties dominate the portfolio
                                                                   REIT composition by value
                                                                                                                                                                   REIT composition by GLA
 Portfolio anchored by 2                                                     5% 2%                                                                                              5%
super regionals – both in                                               5%
                                                                                                                                                                       14%                          24%
  top 3 centres by foot                                            6%
                                                                                                 36%
   count density in SA                                          7%
                                                                                                                                                                 12%
                                                                 7%

                                                                                                                                                                   6%                                 23%

                                                                                                                                                                         9%
Defensive mix of mature                                                         32%                                                                                                  7%

assets in prime locations
                                                                 Sandton City Complex                     Melrose Arch                       Nelson Mandela Square                        Standalone
                                                                                                                                                                                              Standalone
                                                                                                                                                                                                     officeoffice
and developing assets in
                                                                 Eastgate Complex                         Liberty Midlands Mall              Liberty Promenade                            Other
    strategic nodes
                                                          REIT portfolio sectoral spread by GLA                                                              Vacancy sectoral spread by GLA

                                                                               3.4%                                                                                          2.7% 3.2%

Highest average property                                      28.4%

  values in the sector –                                                                          68.2%
  R2.5bn average asset
    value; R44.5k / m2
                                                                                                                         Retail     Office
                                                                                                                                                                                          94.1%
   1.   Independent valuations at 31 October 2016, GLA adjusted for shareholding in properties
                                                                                                                         Occupied   Other
   2.   Vacancies as at 30 September 2016
   3.   Sandton City Complex includes Atrium on 5th
   4.   Standalone office comprise Standard Bank Centre, Umhlanga Ridge, Century City                                                                                                                               10
Portfolio summary
Geographic profile by GLA Tenant profile by category
Free State Category C
Kwazulu-Natal 2.4% 13.8%
15.2%
Category B
11.7%
Western Cape
14.8%
Gauteng
67.6% Category A
74.6%
Lease expiry by GLA
28.9%
23.3%
13.3%
9.8% 9.7%
5.9% 7.1%
2.0%
Vacant Monthly 2016 2017 2018 2019 2020 2020+
1. All data per PLS
2. GLA adjusted for shareholding in properties
11Sandton City: Investment highlights
Sandton City is an iconic Johannesburg landmark at the
heart of the Sandton CBD offering a destination in itself
beyond retail
1• Sandton City continues to boast trading densities significantly
ahead of its peers
2• Sandton City’s recently opened Diamond Walk has a trading
density close on double the centre’s average at R98 400 / m2
per annum
3• Recently opened large retail centres in Gauteng have not
materially impacted Sandton City’s trading performance –
Sandton City continues to attract the full spectrum of LSMs
through a differentiated retail and entertainment offering
4• Sandton City has significant prospective tenant appetite for
substantial GLA should existing anchor tenants vacate (e.g.
Edcon, Stuttafords)
5• Sandton City’s office space has recently undergone major
refurbishments and is continuing to secure tenants on an
ongoing basis
6• Superbly located i.e. walking distance to the Gautrain station,
surrounded by business and leisure hotels and an ever
growing office node
12Sandton City: Overview
1973 1983 1992 - 1995 2001 2009 - 2011 2013 - 2015
Opens Expansion Refurbishment Major expansion Major expansion Re-development & expansion
120 stores GLA: 94,000m2 Refurbishment: GLA: 128,000m2 GLA: 175,000m2 Added: 2016
GLA: 50,000m2 Added: Common areas Added: Added: Diamond Walk Re-development:
Twin Towers Food Court Protea Court Twin Towers (Atrium on 5th)
Sandton Sun Sandton Office Towers (lifts & façade)
Asset summary1 Tenant % total
GLA (m2) 194 779 Tenant 1 9.9%
Retail 144 658 (74%) Tenant 2 9.9%
Office 50 122 (24%) Tenant 3 7.0%
Valuation (Rm) 9 809 Tenant 4 5.3%
Tenant 5 3.2%
Number of stores 311
Total 35.4%
Key metrics2 Sandton City IPD
Department Stores 35.1%
Trading density (R / m2) 52 302 39 353
Apparel 31.0%
Vacancy3 11.1%
Non Turnover Generating Stores 5.1%
Retail 2.1% n/c
Homeware, Furniture & Interior 3.7%
Office 31.7% n/c
Sportswear and Outdoor 3.4%
Gross rent to sales 10.0% 9.0% Other 21.7%
1. Valuations as at 31 October 2016 on 75% of asset. GLA not adjusted for shareholding
2. Trading density and rent to sales from 2015 IPD. Vacancies as at 30 September 2016 per PLS
3. Storage vacancy of 2 257m2 not shown in vacancy subtotals but included in total 13Sandton City: Key statistics
Lease expiry profile Valuation (R’bn)
9.4 9.8
9.2
26.5% 8.6
21.6% 7.1
6.5
14.6%
11.1%
9.9%
6.4% 7.3%
2.6%
2011 2012 2013 2014 2015 Oct-16
Vacant Monthly 2016 2017 2018 2019 2020 2020+
Trading density evolution (R’000 / m2) Base rental evolution (R / m2)
52.3
49.3 403
44.1 383
40.0 39.4 340
36.8 37.8 319
33.9 295
29.6 31.7 2011 – 2015 252 265
CAGR: 9.2% 201 221
186
2011 2012 2013 2014 2015 2011 2012 2013 2014 2015
Sandton City IPD Sandton City IPD
Source: IPD, independent valuations
14Nelson Mandela Square: Investment highlights
Nelson Mandela Square is a premium dining and entertainment
node in the heart of the Sandton CBD
1• The Nelson Mandela statue at the head of the Square is the most
photographed statue in Africa, generating significant tourist
presence
2• The Square is a major thoroughfare for the wider Sandton CBD
and Gautrain
3• The Square continues to perform significantly above its peers on all
metrics
4• The Square has undergone a major refurbishment, which has seen
new tenants move in and the central fountain being upgraded
5• This has impacted performance but a post-completion rebound is
already evident
6• The Square continues to be a preferred venue for both international
and national events
15Nelson Mandela Square: Overview
Sandton Square opens Liberty Group Nelson Mandela statue Sandton Gautrain Nelson Mandela
acquires final portion unveiled station opens Square upgrade
of Sandton Square complete
1994 2000 2003 2010 2015
Renamed Nelson New tenants:
Mandela Square Tashas, Big Mouth, La Martina,
Hamley’s, Forever 21
Asset summary1
Tenant % total
GLA (m2) 38 789
Tenant 1 13.2%
Retail 20 029 (52%)
Tenant 2 7.1%
Office 18 760 (48%) Tenant 3 5.0%
Valuation (Rm) 1 760 Tenant 4 4.9%
Number of stores 58 Tenant 5 4.0%
Total 34.2%
Key metrics2 NMS IPD
Food Service 34.9%
Trading density (R / m2) 79 212 32 089
Apparel 29.4%
Vacancy3 15.7%
Speciality 6.4%
Retail 1.1% n/c Accessories, Jewellery & Watches 6.1%
Office 23.6% n/c Motor Related 4.4%
Gross rent to sales 7.9% 8.8% Other 18.9%
1. Valuations as at 31 October 2016
2. Trading density and rent to sales from 2015 IPD. Vacancies as at 30 September 2016
3. Storage vacancy of 68% on a total GLA of 2 419m 2 not shown in subtotals but included in total
16Nelson Mandela Square: Key statistics
Lease expiry profile 23.5% Valuation1 (R’bn) 1.7 1.8
1.6
19.7% 1.4
18.6%
1.3 1.3
15.7%
6.8% 6.7%
5.6%
3.2%
2011 2012 2013 2014 2015 Oct-16
Vacant Monthly 2016 2017 2018 2019 2020 2020+
Trading density evolution (R’000 / m2) Base rental evolution2 (R / m2)
408 418 424
79.2 392
73.0 369
64.7
52.1
45.0 2011 – 2015
174 193
30.3 32.1 CAGR: 15.2% 147
23.3 25.8 27.3 133
84
2011 2012 2013 2014 2015 2011 2012 2013 2014 2015
NMS IPD NMS IPD
1. Pro forma adjusted valuation for 2015, as unit of account methodology only applied in 2015
2. Rental decline due to development activity in 2015
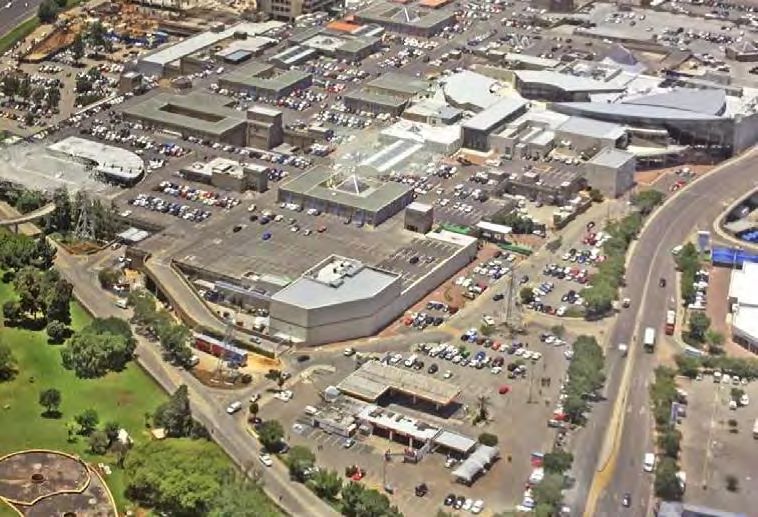
3. Source: IPD, independent valuations 17Eastgate: Investment highlights
Eastgate Complex is a top 3 super regional mall servicing the
East and South-Eastern suburbs of Johannesburg
1• Eastgate is nearing the completion of the Phase 2 project that
involved extensions and refurbishments
2• The centre has undergone a significant transformation,
positioning it as a contemporary retail, leisure and lifestyle
destination
3• Implementation of the leasing strategy has ensured the
addition of Zara, River Island and Hamleys, as well as
extensions to Woolworths, Edgars, Markhams and Foschini
4• The centre boasts one of the finest cinema complexes in the
country that include an IMAX theatre, 2 Cine Prives and 7
other cinemas
5• Eastgate has a loyal customer base from the significant
catchment area it continues to serve
6• The Eastgate Office Tower space is anchored by a significant
Virgin Active Club, and available space is being actively
marketed now as construction is nearing completion
18Eastgate: Overview
Eastgate Shopping Further retail expansion at Major expansion Additional 2 level Major expansion Major expansion
Centre opens Northern and Southern expansion of north-
entrances facing parkade
1979 1990 1991 2010 2014 2016 Q1 2017
Largest shopping Alterations to include Food court and restaurant Completion of a two-year East Office Tower
centre in the Southern Checkers piazza opens extension and being re-developed,
Hemisphere Reconstruction of >250 stores refurbishment Virgin Active to take
Nicol Road flyover GLA: 118,683m2 project up 2 floors
Asset summary1 Tenant % total
GLA (m2) 139 792 Tenant 1 11.2%
Retail 131 244 (94%) Tenant 2 9.4%
Office 8 548 (6%) Tenant 3 6.3%
Valuation (Rm) 8 655 Tenant 4 5.7%
Number of stores 275 Tenant 5 5.0%
Key metrics2 Eastgate IPD Total 37.6%
Trading density (R / m2) 42 849 39 353 Department Stores 35.7%
Vacancy 5.7% Apparel 21.5%
Food Service 4.9%
Retail 4.1% n/c
Speciality 4.6%
Office Under development n/c
Sportswear and Outdoor 4.4%
Gross rent to sales 10.2% 9.0% Other 28.8%
1. Valuations as at 31 October 2016
2. Trading density and rent to sales from 2015 IPD. Vacancies as at 30 September 2016 per PLS 19Eastgate: Key statistics
Lease expiry profile Valuation (R’bn)
36.4% 8.7
8.2
30.4% 7.2
6.8
5.8 6.0
12.4%
5.7% 4.3% 5.8%
2.1% 2.9%
2011 2012 2013 2014 2015 Oct-16
Vacant Monthly 2016 2017 2018 2019 2020 2020+
Trading density evolution (R’000 / m2) Base rental evolution (R / m2)
42.8 323 340
41.6
37.5 37.8 39.4 302
35.2 285 285
32.7 33.9 252 265
29.6 31.7
221
186 201
2011 – 2015
CAGR: 7.0%
2011 2012 2013 2014 2015 2011 2012 2013 2014 2015
Eastgate IPD Eastgate IPD
Source: IPD, independent valuations
20Melrose Arch: Investment highlights
Melrose Arch is Johannesburg’s unique mixed-use precinct
positioned between Sandton and the expanding Rosebank
node
1‒ Significant bulk available for office and residential
‒ Liberty Two Degrees and Liberty have a right of first refusal to
acquire their respective shares of developments upon
completion
2‒ It has become one of the destinations of choice in Johannesburg for
blue-chip corporate tenants and smaller businesses alike
3‒ It is a premier restaurant and office hub servicing Johannesburg’s
Northern suburbs
4‒ While Liberty Two Degrees does not have residential exposure, One
on Whiteley includes a premium urban residential offering which
increases high LSM consumer footfall in the precinct
Lease expiry profile
26.9%
23.9%
20.5%
14.8%
11.9%
0.6% 0.4% 1.2%
Vacant Monthly 2016 2017 2018 2019 2020 2020+
21Melrose Arch: Overview
Amdec acquires the
Phase 1 construction Amdec acquires a 50% stake One on Whitely construction
remaining 50% stake in
begins in Melrose Arch begins
Melrose Arch
1998 2004 2005 2009 2011 2015 2016
Phase 1 completed
38 000m2 Piazza opened Liberty acquires 25% stake
in Melrose Arch
Asset summary1
Tenant (Office and Retail) % total
GLA (m2) 181 163
Retail 54 553 (30%)
Tenant 1 13.2%
Office 109 607 (61%)
Other 17 003 (9%)
Tenant 2 6.7%
Valuation (Rm) 2 039
Number of stores 119 Tenant 3 4.8%
Key metrics2 Melrose Arch2 IPD3
Trading density (R / m2) 41 402 42 786 Tenant 4 4.7%
Vacancy 0.6% n/c
Retail 1.4% n/c Tenant 5 3.9%
Office 0.3% n/c
Gross rent to sales 10.2% 9.8% Total 33.4%
1. Valuations as at 31 October 2016 on 25% of the asset. GLA not adjusted for shareholding
2. Trading density and rent to sales from 2015 IPD. Vacancies as at 30 September 2016 22
3. Melrose Arch’s lack of peers makes IPD data not directly comparableLiberty Midlands Mall: Investment highlights
Liberty Midlands Mall is a major regional centre servicing the
Pietermaritzburg and wider KZN midlands region,
strategically situated on the N3
1• Liberty Midlands Mall delivers superior performance to its
peers with a long lease expiry profile and diverse anchor
tenants
2• Liberty Midlands Mall houses significant anchor tenants –
Woolworths, Pick n Pay, Edgars, Game and Dischem
3• It offers shoppers 166 stores that include a strong presence
from the national retail groups such as the Foschini Group,
the Truworths Group, Mr. Price and Edcon
4• The centre offers a significant food-court that is a combination
of formal sit-down restaurants and take-away stores
5• Liberty Midlands Mall is about to commence a 22 282m2
Phase 3 development that encompasses an expansion of
Woolworths, the introduction of Planet Fitness and Checkers
23Liberty Midlands Mall: Overview
Liberty Midlands Major expansion Major expansion Major expansion
Mall opens
2002 2006 2011 2016
Phase 2 expansion R50 million revamp Phase 3 expansion
36 new stores added Expansions to anchor tenants planned
Dischem enters as anchor tenant
1678m2
Asset summary1 Tenant % total
GLA (m2)
Tenant 1 10.3%
Retail 56 130
Tenant 2 8.2%
Valuation (Rm) 1 882
Tenant 3 8.0%
Number of stores 166
Tenant 4 6.8%
Key metrics2 Midlands Mall IPD
Tenant 5 3.0%
Trading density (R / m2) 37 488 32 089
Total 36.3%
Vacancy
Department Stores 26.0%
Retail 2.1% n/c
Apparel 21.1%
Gross rent to sales 6.6% 8.8%
Food 9.4%
Homeware, Furniture & Interior 6.9%
Food Service 6.2%
Other 30.5%
1. Valuations as at 31 October 2016
2. Trading density and rent to sales from 2015 IPD. Vacancies as at 30 September 2016
24Liberty Midlands Mall: Key statistics
Lease expiry profile Valuation (R’bn)
29.0% 1.9
27.5% 1.8 1.8
1.6
1.4
20.6% 1.3
11.0%
5.4%
2.1% 2.4% 2.1%
2011 2012 2013 2014 2015 Oct-16
Vacant Monthly 2016 2017 2018 2019 2020 2020+
Trading density evolution (R’000 / m2) Base rental evolution (R / m2)
37.5 193
35.5 174 177
33.2 32.1
29.6 30.9 30.3 155
27.3 146 147
25.8 133 133
23.3 122
2011 – 2015 84
CAGR: 6.1%
2011 2012 2013 2014 2015 2011 2012 2013 2014 2015
LMM IPD LMM IPD
Source: IPD, independent valuations
25Liberty Promenade: Investment highlights
Liberty Promenade is a leading regional centre servicing the
northern Cape Town areas
1• Modern shopping centre in the heart of a township, boasting
175 shops
2• Strategically located close to the N1 / N2 freeways, allowing
easy access and egress
3• Attracts an aspirational shopper profile and as a result
interest from leading international retailers, such as H&M and
Cotton On
4• Receives over 1 million shoppers per month
5• Promenade’s loyal customers appreciate the centre for its
tenant mix, design, atmosphere, service levels and easy
access
26Liberty Promenade: Overview
Liberty Promenade A further 11 000 m² Food Court and Classified as a Addition of Burger
Mall first opened in for retail was entertainment area regional Shopping King Drive-Thru
November with 42 000 m² completed opens Centre
2003 2004 2005 2010 2011 2016
Liberty acquires
Promenade
Mall
Asset summary1 Tenant % total
GLA (m2)
Tenant 1 8.5%
Retail 72 398
Tenant 2 7.6%
Valuation (Rm) 1 383
Tenant 3 5.1%
Number of stores 175
Tenant 4 3.6%
Key metrics2 Promenade IPD
Tenant 5 3.5%
Trading density (R / m2) 33 863 32 089
Total 28.3%
Vacancy
Apparel 23.4%
Retail 3.1% n/c
Department Stores 19.0%
Gross rent to sales 4.7% 8.8%
Non Turnover Generating Stores 12.1%
Food 10.9%
Speciality 9.4%
Other 25.2%
1. Valuations as at 31 October 2016
2. Trading density and rent to sales from 2015 IPD. Vacancies as at 30 September 2016 27Liberty Promenade: Key statistics
Lease expiry profile Valuation (R’bn)
27.1% 1.3 1.4
26.4% 1.3
1.2
1.1
1.0
15.7%
14.2%
11.0%
3.1%
1.5% 1.0%
2011 2012 2013 2014 2015 Oct-16
Vacant Monthly 2016 2017 2018 2019 2020 2020+
Trading density evolution (R’000 / m2) Base rental evolution (R / m2)
33.9
32.1 193
30.3 174
28.6
25.8 25.8 26.7 27.3
25.0 147
23.3 133
2011 – 2015 114 121
105 111
CAGR: 7.8% 96
84
2011 2012 2013 2014 2015 2011 2012 2013 2014 2015
Promenade IPD Promenade IPD
Source: IPD, independent valuations
28Botshabelo Mall: Overview
Botshabelo Mall opened on 17 November 2016. The Mall will Asset summary1
be a community retail centre servicing growing demand in a GLA (m2)
previously unserved node Retail 20 718
Valuation (Rm) 225.7
1• Exposure to an aspirational consumer who has not previously Number of stores 70
had access to a local retail centre (next closest centre with Key metrics
similar offering is over 50km away) Trading density (R / m2) n/a
2• Leading anchor tenants making first entry into Free State’s Vacancy 10.4%
largest township Tenant % total
3• Geographic and socio-economic profile provides Tenant 1 13.8%
diversification and growth in the portfolio Tenant 2 9.7%
Tenant 3 6.4%
Tenant 4 3.9%
Tenant 5 3.4%
Lease expiry profile 82.5%
Total 37.1%
Grocery / Supermarket 23.4%
Unisex Wear 21.5%
Hardware, security & Home
10.4% 6.4%
7.1% Improvement
0.0% 0.0% 0.0% 0.0% 0.0%
Fast Food 5.5%
Vacant Monthly 2016 2017 2018 2019 2020 2020+
Banks 5.5%
Other 37.7%
1. Valuations as at 31 October 2016, on 70% of the asset. Vacancies as at 30 September 2016
29Office overview
A grade office space in Durban and Cape Town’s leading Standard Bank
Asset summary1 Umhlanga Ridge Century City
office parks Centre
GLA (m2) 20 699 19 020 92 789
1• The majority of Umhlanga Ridge’s GLA is let to Liberty as the
Valuation (Rm) 402.3 358.6 530.5
Durban Head Office; Liberty’s lease expires beyond 2020.
Vacancy 3.3% 0.0% 0.0%
2• Century City is majority-let to Liberty, serving as the Cape
Town Head Office. Liberty is in the process of negotiating the
lease renewal
3• Standard Bank Centre is fully let to Standard Bank to 2019
Lease expiry profile – Umhlanga Ridge Lease expiry profile – Century City
96.0%
57.9%
36.9%
3.3% 0.3% 0.0% 0.0% 1.7% 0.0% 0.0% 0.0% 4.0% 0.0% 0.0% 0.0% 0.0%
Vacant Monthly 2016 2017 2018 2019 2020 2020+ Vacant Monthly 2016 2017 2018 2019 2020 2020+
1. Valuations as at 31 October 2016. Vacancies as at 30 September 2016.
30John Ross Eco Junction
John Ross Eco Junction is a 20 ha mixed-use, partially-
developed commercial and industrial precinct located
between Empangeni and Richards Bay
1• Located at the junction of the N2 (Linking Durban and
Pongola) and the John Ross Highway (connecting Richards
Bay and Empangeni)
2• John Ross Highway offers easy access to multiple logistics
facilities and the corridor will benefit from Transnet’s R33bn
planned infrastructure spend over the next seven years
3• It is currently home to Tangawizi Motor dealership and
Melomed Hospital which is currently under development
4• The hospital provides a link to wider community and an
Asset overview1
underpin to the ongoing development of the Junction
Vacant land 28 serviced stands, 7 in negotiation for sale
Automotive showrooms Tangawizi Motors, 10 year lease
200 beds, completion Q3 2017. 20 year lease
Melomed Hospital
agreement
Valuation (Rm) GLA (m2)
John Ross Eco Junction 154.6
Tangawizi Motors 57.2 7 060
Melomed Hospital 129.2 13 809
1. Valuations as at 31 October 2016. Melomed at 70% of asset value, GLA not adjusted
31Management
Established track record and
deep asset familiarity
32Board with significant industry experience
Peter Moyo Wolf Cesman Michael Ilsley
Non-executive director Non-executive director Non-executive director
B Accounting science (Hons), CA(SA), HDip BCom, CA(SA), HDip Tax Law BCom, BAcc, CA(SA)
Tax Law, AMP
50 years’ experience in property
Currently CEO of NMT Capital and Spent 24 years with Liberty Properties, the Previously group Finance Director at
Chairman of Vodacom last 17 of which as CEO Alexander Forbes, Audit Partner at PwC
Previously group CEO of Alexander Forbes, Previous director of Redefine and Hyprop
Deputy Managing Director of Old Mutual SA,
Partner at EY
Amelia Beattie John Sturgeon
Chief Executive Officer Chief Financial Officer
BCom, CSCM CTA, CA(SA), CMA, HDip Tax Law
Previously Head of STANLIB Direct Property Previously the head of Liberty Corporate
Investments Finance
Previously COO, Regional General Manager Held various Financial Director positions,
and Retail Asset Manager at Old Mutual including at Argus Holdings and the Premier
Property for over a decade Group
Past president of SAPOA
33Industry-leading management team
Amelia Beattie John Sturgeon Alex Phakathi
Chief Executive Officer Chief Financial Officer Chief Operating Officer
BCom, CSCM CTA, CA(SA), CMA, HDip Tax Law MCom, EDP, PDP
Over 40 years experience
17 years experience 21 years experience
Brian Unsted Jonathan Sinden Nikiwe Mkhabela
Asset Management Executive Asset Management Executive Asset Management Executive
BCom, PDM, MBA BSc (Quantity Surveying) MSc Property Development
18 years experience 17 years experience Management, BTech
(Construction Management)
10 years experience
Potlaki Lekoetje Xolani Nene Luba Vengeni
Development Manager Development Manager Executive: Business Development
and Valuations
BTech (Quantity Surveying), BTech (CM and QS), PDP
BSc (Property Studies)
PDM 16 years experience
10 years experience
14 years experience
34Management incentivisation
• Scheme to be implemented shortly after listing
• Reward will be governed by Manco’s Remco, who will set scheme parameters
Overview
• Scheme is benchmarked to market norms
• Management’s existing STANLIB scheme will migrate to align management with unitholders
Short term: Individual and REIT performance Long term: REIT performance
Incentivisation Settlement: Cash and units settled (over Settlement: REIT units over rolling
rolling period) 3 – 5 years vesting period in equal thirds
• All incentivisation costs will be borne by the Manco from the asset management fee
Cost to unitholders
• Units awarded to management will not be dilutive
35Use of proceeds
Identified pipeline and
unique gearing flexibility
36Investment strategy and growth opportunities
• Liberty Two Degrees will be ungeared and have R2.65bn of primary capital to execute an
attractive growth strategy, primarily in South Africa
Investment strategy • Liberty Two Degrees will look to invest in Rest of Africa jurisdictions, leveraging STANLIB and
Liberty group expertise
• Liberty Two Degrees has an identified acquisition pipeline (in excess
of R4bn)
─ This will be deployed in a manner consistent with the premium and iconic nature of the
portfolio’s assets
South Africa
• Discussions are ongoing, but cannot be disclosed at this point in time
• Acquisition yield will be in line with that of the existing portfolio
• The pipeline will utilise a significant portion of the capital raised, with the option for any remaining
cash to be used to acquire a greater share of the existing portfolio from the LPP
37Investment strategy and growth opportunities
• Being highly selective and investing in only premium investment opportunities in high-end retail and
Rest of Africa commercial space, targeting multinational anchor tenants
investment • Ensuring adequate repatriation of distributions to the South African investor base
principles • Targeting both yielding assets and new developments as appropriate
• Limiting the total portfolio in RoA jurisdictions to 10%
38Gearing Liberty Two Degrees
• Liberty Two Degrees will list ungeared, which uniquely positions the REIT relative to peers in a
potentially rising interest rate cycle
Gearing flexibility
• The REIT will re-examine this unrivalled flexibility as appropriate on an ongoing basis in order to
optimally structure the balance sheet
• In time, the REIT will raise external debt to be deployed towards acquisitions and developments.
It is not envisaged that gearing will be raised to support the immediate acquisition pipeline in
order to retain balance sheet flexibility in the near term
Gearing strategy
• Liberty Two Degrees has tested the capital structure with lenders, who see it as no impediment to
raising external debt. The REIT will have a long-term LTV in line with peers, with this expected to
be significantly lower in the near- and medium-term
39Additional
information
40Transformation philosophy
Liberty Two Degrees is a responsible property investor committed to promote transformation through creating work and business
environments that represent demographic diversity, in line with transformation legislation in South Africa.
The REIT will drive transformation through the following four principles:
1. Employment Equity
Management is committed to comply with the Employment Equity Act and to have the appropriate gender and racial
representation at all levels
2. Black Economic Empowerment
Management will address B-BBEE through the procurement of goods and services for the property portfolio.
3. Skills Development
For progressive skills development, management endeavours to provide an environment where staff members are equipped to
effectively do their jobs and talent is identified and nurtured
4. Corporate Social Investment
Management will look to provide Corporate Social Investments (CSI) directly and through the participation of the assets in the
portfolio
41Sustainability
Liberty Two Degrees has a Sustainability Policy, which has the following objectives:
The REIT will strive to be one of the leaders in sustainability performance. This generates attention to
Leader
the portfolio, especially from blue-chip tenants
Stakeholder Manco will inform tenants, staff, shareholders, partners and suppliers of the portfolio’s sustainability
Engagement initiatives
Manco will aim to create efficiency which reduces tenant occupancy costs and potentially creates new
Efficiency
revenue streams for the REIT
Management will investigate renewable energy opportunities in the portfolio as a means to generate
Renewable energy
additional revenue
Atrium on 5th is the portfolio’s first 4 Green Star Rated building. Management view Green Buildings as
Green Buildings
an opportunity to attract and retain international tenants
Community The REIT understands that it has a responsibility to the surrounding community in the areas it operates
42Conclusion
Owning a piece of Africa’s
richest square mile
43South Africa’s most anticipated property IPO
Defensive, prime and iconic real estate assets
Industry-leading management team
Growth opportunities in SA and RoA
Robust income growth with unique gearing flexibility
44Thank you
45Appendices
46Forecast income statement R’000 Forecast for the one month ending 31 Dec 2016 Forecast for the year ending 31 Dec 2017 Property portfolio 45 930 588 143 Rental income and recoveries 47 099 595 684 Straight-line lease income adjustments (1 169) (7 541) Property operating expenses (14 097) (186 195) Net rental and related income 31 833 401 948 Other income - - Administrative expenses (273) (3 306) Tenant installation and letting commissions (10) (759) Net property income 31 550 397 883 Asset management fee (2 927) (36 809) Profit from operations 28 623 361 074 Interest income 15 017 222 537 Finance costs - - Profit before fair value adjustments 43 640 583 611 Fair value adjustments 1 169 7 541 Existing investment properties 1 169 7 541 Investment properties under development - - Profit before taxation 44 809 591 152 Taxation - - Total profit for the year 44 809 591 152 Number of units in issue 908 443 334 908 443 334 Weighted average number of units in issue 908 443 334 908 443 334 Basic and diluted earnings per unit (cents) 4.93 65.07 Headline earnings per unit (cents) 4.80 64.24 Distributable income per unit (cents) 4.93 65.07 47
Pro forma statement of financial position
                                          Acquisition of portfolio   Placement to new    Private placement to invited
                                                                                                                         Pro forma after
                                                           assets        policyholders           investors and listing

ASSETS
Non-current assets                                 6 000 000 000                                                          6 000 000 000
 Investment property                               6 000 000 000                                                          6 000 000 000
Current assets                                                            780 211 676                  1 870 000 000      2 650 211 676
 Cash and cash equivalents                                                780 211 676                  1 870 000 000      2 650 211 676

Total assets                                       6 000 000 000          780 211 676                  1 870 000 000      8 650 211 676
EQUITY AND LIABILITIES
Equity                                             6 000 000 000          780 211 676                  1 870 000 000      8 650 211 676
 Stated capital                                    6 000 000 000          780 211 676                  1 870 000 000      8 650 211 676
Non-controlling interests
Non-current liabilities
Current liabilities
Total equity and liabilities                       6 000 000 000          780 211 676                  1 870 000 000      8 650 211 676

Number of units in issue                             626 315 789           82 127 545                    200 000 000        908 443 334

Net asset value per unit (ZAR)                                                                                                     9.52
Net tangible asset value per unit (ZAR)                                                                                            9.52

                                                                                                                                           48
Key assumptions
Subject Key assumptions
• The property portfolio comprises the following properties:
‒ Sandton City Complex (SC Shopping Centre, SC Office Tower and Atrium on 5th)
‒ Nelson Mandela Square
‒ Eastgate Complex
‒ Liberty Midlands Mall
‒ Liberty Promenade Shopping Centre
Property portfolio ‒ Standard Bank Centre
‒ Umhlanga Ridge Office Park and Liberty Regional Head Office
‒ Liberty Regional Head Office - Century City
‒ Botshabelo Mall
‒ Melrose Arch
‒ John Ross Eco Estate (Tangawizi Motors, Melomed Hospital and various stands)
Total property portfolio in LPP of R27.4 billion
• R6bn of switches representing a 22.0% undivided share in LPP’s investment property as at 30 November 2016 settled through the issue of Liberty
Two Degrees units at a subscription price of R9.50 per unit representing a 5% discount to the subscription price of R10
• Subject to demand, there may be a secondary sell down of Liberty Two Degrees units of up to R1 billion by Liberty shareholders. Any units sold as
Switches
part of this secondary placement will not receive the 5% discount when exchanging assets for units. If the total R1 billion is sold down through a
secondary placement it would result in 626 315 789 units issued in Liberty Two Degrees to settle the acquisition
• A secondary sale is assumed in the pro forma statement of financial position shown
49Key assumptions (cont.)
Subject Key assumptions
• Private placement of R2.8 billion as follows:
‒ 200 000 000 Liberty Two Degrees units on listing to invited investors at the subscription price of R10 per unit, raising a total of R2 billion; and
Private placement
‒ to Liberty (on behalf of its policyholders), 82 127 545 new Liberty Two Degrees units at a 5% discount to the subscription price of R10 per unit
raising a total of R780 million
Interest on cash • 8.0%
Listing expenses • R130 million
Market capitalisation • R9.1 billion
50Disclaimer
Private and confidential
This document has been prepared by Liberty Two Degrees (the “REIT”) and is the responsibility of the REIT and comprises the written materials for a presentation to potential investors concerning the REIT and its proposed listing on the stock exchange operated by the JSE Limited and the private placement
(“Private Placement") to issue and/or sell participatory interests in the REIT ("Units"). For purposes of this notice, this “Presentation” includes this document, its contents or any part of it and any related video or oral presentation, any question and answer session and any written or oral material discussed or
distributed during the meeting. In accessing this Presentation, you agree to be bound by the following terms and conditions.
This Presentation does not constitute or form part of any offer to sell or issue or invitation to purchase or subscribe for, or any solicitation of any offer to purchase or subscribe for, any securities of the REIT, nor shall it or any part of it nor the fact of its distribution form the basis of, or be relied on in connection
with, any contract or investment decision. This Presentation does not constitute advice relating to legal, taxation or investment matters and investors must always consult their own professional advisers on the merits and risks of any investment. The information contained in this Presentation is for discussion
purposes only and does not purport to contain all information that may be required to evaluate the REIT, its financial position and/or any investment decision. No reliance may be placed for any purpose on the Presentation for its accuracy, fairness or completeness. The information and opinions contained in this
Presentation are provided as at the date of the meeting and are subject to change without notice. The pre-listing statement may contain information different from this Presentation. Any acquisition of units in the Private Placement should be made solely on the basis of the information contained in the final pre-
listing statement.
To the extent available, the industry, market and competitive position data contained in this Presentation come from official or third party sources. Third party industry publications, studies and surveys generally state that the data contained therein have been obtained from sources believed to be reliable, but
that there is no guarantee of the accuracy or completeness of such data. While the REIT reasonably believes that each of these publications, studies and surveys has been prepared by a reputable source, none of The Standard Bank of South Africa Limited or Java Capital, (together, the “JBRs”), the REIT, or
any of their respective parent or subsidiary undertakings or affiliates, or any of their respective directors, officers, employees, advisers or agents have independently verified the data contained therein. In addition, certain of the industry, market and competitive position data contained in this Presentation come
from the REIT’s own internal research and estimates based on the knowledge and experience of the REIT’s management in the markets in which the REIT operates. While the REIT reasonably believes that such research and estimates are reasonable and reliable, they, and their underlying methodology and
assumptions, have not been verified by any independent source for accuracy or completeness and are subject to change without notice. Accordingly, undue reliance should not be placed on any of the industry, market or competitive position data contained in this Presentation.
The information contained in this Presentation does not purport to be comprehensive. None of the JBRs, or any of their respective parent or subsidiary undertakings or affiliates, or their respective directors, officers, employees, advisers or agents accepts any responsibility or liability whatsoever for/or makes
any representation or warranty, express or implied, as to the truth, fullness, accuracy or completeness of the information in this Presentation (or whether any information has been omitted from this Presentation) or any other information relating to the REIT, its subsidiaries or associated companies, whether
written, oral or in a visual or electronic form, and howsoever transmitted or made available or for any loss howsoever arising from any use of this Presentation or its contents or otherwise arising in connection therewith. None of the JBRs, or any of their respective parent or subsidiary undertakings or affiliates, or
any of their respective directors, officers, employees, advisers or agents has verified the information in this Presentation.
This Presentation has been prepared by the REIT solely for use at the meeting held in connection with the Private Placement and may not be used for any purpose other than the preparation of research reports concerning the REIT. Neither this Presentation nor any part or copy of it may be taken or transmitted
into the United States or distributed, directly or indirectly, in the United States, as that term is defined in Regulation S under the US Securities Act of 1933, as amended (the “US Securities Act”). Neither this Presentation nor any part or copy of it may be taken or transmitted into Australia, Canada or Japan or to
any resident of Japan, or distributed directly or indirectly in Australia, Canada or Japan or to any resident of Japan. Any failure to comply with this restriction may constitute a violation of United States, Australian, Canadian or Japanese securities laws. This Presentation is not an offer for the sale of securities in
the United States. This Presentation does not constitute an offer of securities to the public in the United Kingdom or in any other jurisdiction. Persons into whose possession this document comes should observe all relevant restrictions.
The units of the REIT have not been, and will not be, registered under the US Securities Act and may not be offered or sold in the United States. There will be no public offering of the units in the United States and the REIT does not intend to register the Private Placement or any aspect thereof in the United
States.
The Presentation does not constitute or form a part of any offer or an invitation or solicitation or advertisement to purchase and/or subscribe for securities in South Africa, including an “offer to the public” as defined in the South African Companies Act, 2008 (the “South African Companies Act”). The Private
Placement will only be addressed to and directed at persons in South Africa who fall within one of the categories listed in section 96(1)(a) of the South African Companies Act (“South Africa Relevant Persons”). Information made available in this Presentation should not be considered as “advice” as defined in
the South African Financial Advisory and Intermediary Services Act, 2002.
The information and opinions contained in this Presentation and any other material discussed at the meeting are provided as at the date of this Presentation and not as of any future date and will be subject to updating, revision, verification and amendment without notice and such information may change
materially up until the date of publication of any pre-deal research. None of the REIT’s unitholders, the JBRs, or any person who may be acting as legal adviser, or their respective parent or subsidiary undertakings, or any of such persons’ respective directors, officers, employees, agents, representatives,
partners, shareholders, affiliates or advisers is under any obligation to update or keep current the information contained in this Presentation or to provide the recipient of this Presentation with access to any additional information that may arise in connection with it. This document has not been approved by any
regulatory or supervisory authority.
The information in this Presentation may include forward-looking statements, which are based on current expectations and projections about future events. These statements may include, without limitation, any statements preceded by, followed by or including words such as “target,” “believe,” “expect,” “aim,”
“intend,” “may,” “anticipate,” “estimate,” “plan,” “project,” “will,” “can have,” “likely,” “should,” “would,” “could” and other words and terms of similar meaning or the negative thereof. These forward-looking statements, as well as those included in any other material discussed at the meeting, are subject to risks,
uncertainties and assumptions about the REIT and its subsidiaries and investments, including, among other things, the development of its business, trends in its operating industry, market growth trends and future capital expenditures and acquisitions. In light of these risks, uncertainties and assumptions, the
events in the forward-looking statements may not occur. No representation or warranty is made that any forward-looking statement will come to pass and no reliance should be placed on any forward-looking statement. No one undertakes to publicly update or revise any such forward-looking statement. No
statement in this Presentation is intended to be, or may be construed as, a profit forecast or a profit estimate.
The JBRs and any of their respective parent or subsidiary undertakings or affiliates, or their respective directors, officers, employees, advisers or agents are acting for the REIT in connection with the Private Placement and no one else and will not be responsible to anyone other than the REIT for providing the
protections afforded to their respective clients or for providing advice in relation to the Private Placement or any transaction or arrangement referred to in this Presentation.
Certain figures contained in this Presentation, including financial information, have been subject to rounding adjustments. Accordingly, in certain instances, the sum or percentage change of the numbers contained in this Presentation may not conform exactly to the total figure given.
Collective investment schemes are generally medium to long-term investments. The value of participatory interests or the investment may go down as well as up and past performance is not necessarily a guide to future performance.. Collective investment schemes are traded on an exchange at offered prices
and can engage in borrowing. Liberty Two Degrees and the Managers are not obliged to redeem units. A schedule of fees and charges and maximum commissions is available on request from the management company. STANLIB REIT Fund Managers does not provide any guarantee either with respect to the
capital or the return of a portfolio. STANLIB REIT Fund Managers has a right to close the portfolio to new investors in order to manage it more efficiently in accordance with its mandate. STANLIB REIT Fund Managers does not provide any guarantee either with respect to capital or the return of the Fund.
Collective Investment Schemes are not investments in insurance policies with an insurer and therefore cooling-off periods do not apply. The directors or employees of STANLIB REIT Fund Managers may be invested in the fund. The investor understands that the legal and tax environment is continually
changing and that STANLIB REIT Fund Managers cannot be held responsible for any changes to the law which might have an effect on their investment, and which do not exist at the time their investment is made. STANLIB REIT Fund Managers Proprietary Limited (RF) is a registered Collective Investment
Scheme Manager. 51You can also read