Full Year Results Presentation 12 Months to 31 March 2020 - 18 June 2020 www.nrr.co.uk

Page created by Doris Mcbride
 
CONTINUE READING
Full Year Results Presentation 12 Months to 31 March 2020 - 18 June 2020 www.nrr.co.uk
Full Year Results Presentation
                 12 Months to 31 March 2020
                          18 June 2020

www.nrr.co.uk
Full Year Results Presentation 12 Months to 31 March 2020 - 18 June 2020 www.nrr.co.uk
Introduction
Allan Lockhart: Chief Executive
Full Year Results Presentation 12 Months to 31 March 2020 - 18 June 2020 www.nrr.co.uk
OVERVIEW

     Reviewing FY20:               Impact of COVID-19:              Priorities for FY21:
A year of strategic progress,   Focus on cash reserves and      Fully reopening, rebuilding
with robust operational and     liquidity, and the safety and   revenues and adapting our
   financial performance        wellbeing of stakeholders               strategies

                                                                                              3
Full Year Results Presentation 12 Months to 31 March 2020 - 18 June 2020 www.nrr.co.uk
OVERVIEW OF FY20

   Underlying Funds From
        Operations                     UFFO ps               DPS              EPRA NAV ps                     LTV

    £52.1m                            17.0p              16.2p                   201p                      47%
                                                      105% covered by UFFO
      (FY19: £55.1m)                  (FY19: 18.1p)                              (FY19: 261p)             (FY19: 37%)
                                                         (FY19: 21.6p)

        Disposals                    Acquisitions1    Retail occupancy        Average rent            Leasing deals

   £48.4m                            £102.3m             94.8%               £12.66 psf              678k sq ft
             NIY: 5.5%                 NIY: 9.5%                                                    Long term deals +1.2% ahead
-1.5% discount to book value
                                                      (March 2019: 95.2%)    (March 2019: £12.52)         of prev. passing

1 NewRiver   share of acquisitions
                                                                                                                                  4
Full Year Results Presentation 12 Months to 31 March 2020 - 18 June 2020 www.nrr.co.uk
IMPACT OF COVID-19 AND OUR RESPONSE

                                                                                                           Supporting our
 Cash flow and liquidity                  Retail portfolio               Hawthorn Leisure
                                                                                                            stakeholders

Significant available liquidity of                                      All pubs temporarily closed
 £177 million at 31 March 2020       Almost 40% of occupiers open                                     Safety and wellbeing of staff,
                                                                      from 20 March, as required by
                                        and trading throughout                                        occupiers and customers our
                                                                              UK Government
                                               lockdown                                                        top priority
 Eligibility for CCFF, although
      not currently drawn                                             Rents deferred; good progress
                                      75% of lockdown rents due                                       Additional support provided to
                                                                        with at least 45% recovery
                                      either collected or moved to                                    our corporate charity partner,
                                                                      expected, and insurance claim
    Suspension of all non-               an alternative payment                                              the Trussell Trust
                                                                           made for remainder
       essential capex

                                      Majority of rent outstanding                                        Rent waived for charity
                                                                      Well-advanced reopening plan
    Suspension of dividend            relates to national retailers                                   occupiers and car parks made
                                                                       to ensure business can be
         payments                                                                                       free for essential workers
                                                                           operational by 4 July

                                                                                                                                       5
Full Year Results Presentation 12 Months to 31 March 2020 - 18 June 2020 www.nrr.co.uk
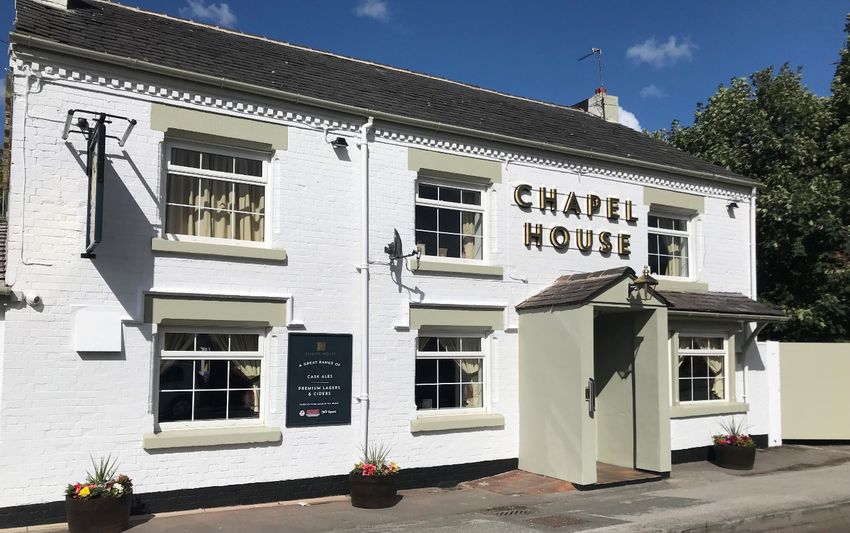
IMPACT OF COVID-19 IN RETAIL PORTFOLIO

Status of retail portfolio occupiers through lockdown                                    75% of rent with due dates from 25 March to 1 June 2020 has
                                                                                         either been collected or moved to an alternative payment

Closed                                                                      Open         Rent outstanding                                                       Collected
Mainly fashion, value                                              Over half of stores   • Mainly relates to national retailers
                                                                                         • Negotiations ongoing
leisure, home &                                                       open are in the
                                                                                         • Confident of higher collection
electrical, books &                                                discounter, food &
stationery and                                                  grocery and health &
                                                                                           once stores reopen                     21%
independents                                        37%           beauty sub-sectors
                              Retail portfolio:
                                  66% of

                        63%
                               NewRiver’s
                               gross rental
                                                                                                            Waived
                                                                                                                       4%               £17.1m
                                 income                                                                  Moved to      2%          rent with due dates from   52%
                                                                                                          monthly
                                                                                                                                   25 March to 1 June 2020
                                                                                                                        6%
                                                                                                             Re-gear

Top 5 operators by gross income all open throughout lockdown:
                                                                                         Agreements                               15%
                                                                                         reached with
                                                                                         retailers                       Deferred

                                                                                                                                                                            6
Full Year Results Presentation 12 Months to 31 March 2020 - 18 June 2020 www.nrr.co.uk
IMPACT OF COVID-19 IN HAWTHORN LEISURE

Progress made on collecting rent due during lockdown                  Mitigating operational and administrative costs

                                                                                     UK Government support for leisure sector
                                              Collected                              Almost all our pub partners are eligible for grant funding

Rent                                                                                79% of head office staff furloughed
outstanding                                                                         Salaries topped up to ensure no reduction in regular pay
• Some may be
                                                   36%
  waived as part
  of conditional
  support grant
                              £3.8m
  given to pub              rent due from pubs                                      Supply and distribution contracts paused
  partners                   from beginning of
• Remainder          55%
  subject to               lockdown to 30 June
  insurance claim                  2020
  for loss of rent                                                                  Limiting transformational capex in FY21

                                              5%
                                                   Pub partners
                                         4%        committed to pay
                                           Confident                                Concessions secured from key suppliers
                                           of recovery

                                                                                                                                                  7
Full Year Results Presentation 12 Months to 31 March 2020 - 18 June 2020 www.nrr.co.uk
FINANCIAL IMPACT OF COVID-19

                                          FY21 Net Property Income compared to internal pre-COVID-19 forecast
                           Scenario
                                                   Retail                        Pubs                  Group blended

                              1               In-line to -10%              -30% to -50%                       -18%

Current FY21 forecast         2                -10% to -20%                -50% to -70%                      -30%
Improved due to progress
                                                                                                                         All scenarios
with rent collection and
                                                                                                                       test a valuation
reopening preparation
                              3               -20% to -30%                 -50% to -70%                      -38%           decline
                                                                                                                        significantly in
                                                                                                                       excess of FY20

FY21 forecast at the
                              4                -30% to -40%                -50% to -70%                       -44%
beginning of lockdown

                              5               -40% to -50%                 -50% to -70%                      -50%

                                  Even in Scenario 5, we would hold sufficient cash funds and meet all debt covenant
                                                              requirements during FY21
                                                                                                                                       8
Full Year Results Presentation 12 Months to 31 March 2020 - 18 June 2020 www.nrr.co.uk
ASSETS WELL-POSITIONED FOR GRADUAL EASING OF LOCKDOWN

                                 Retail parks              Community
            Two thirds of     provide large, free       shopping centres
         assets anchored by     car-parks and          are located in town
Retail    a food & grocery      ample outside          centres, accessible
                brand          space for social        by foot, and over a
                                  distancing            third are open air

         Majority of pubs
                              Almost all our pubs       Over 70% of our
         are in community
                              are wet-led, so less     pubs have outside
Pubs             and
                                exposed to food         spaces, enabling
          neighbourhood
                               and casual dining        social distancing
              locations

                                                                                                         9
Full Year Results Presentation 12 Months to 31 March 2020 - 18 June 2020 www.nrr.co.uk
GOOD PROGRESS MADE ON OUR STRATEGIES IN FY20

Disposing of lower yielding    Completed £48.4m of disposals at a blended NIY of 5.5%; achieved over 75% of target
assets                         but H2 impacted by election uncertainty and COVID-19

Capital recycling, primarily   Acquired £172.8m (NewRiver share: £102.3m) of assets at a blended NIY of 9.5%,
in joint ventures              including five retail parks in joint venture with BRAVO

Leveraging our asset
                               Annualised asset management fees increased by 120%
management platform

Sharper asset management &
                               Completed 678,100 sq ft of leasing activity and progress in reducing service charges
operational efficiencies

                               LFL EBITDA per pub of +5.9% during the year excluding March 2020, platform scale
Growth from pubs               grew from 665 to 720 pubs due to net acquisitions

                                                                                                                      10
ADAPTING OUR STRATEGIES FOR A
                                                                             CHANGED OPERATING ENVIRONMENT

                       Targeting £80m to £100m of disposals in FY21
Disposing of lower
                       Exchanged, completed or under offer on £30.2 million in FY21 so far
yielding assets
                       Prioritising LTV improvement in the use of proceeds

                       Significant opportunity to leverage our platform to work with private
                       and public investors
Capital Partnerships   Exploring opportunities from market dislocation through JVs
                       Supporting Local Authorities in transforming town and city centres

                       Successful execution of our pub reopening strategy
                       Targeted capex to deliver double digit returns
Growth from pubs
                       Extracting value and recycling capital from pub portfolio through asset
                       management, development and selective disposals

                                                                                                           11
Finance Review
Mark Davies: Chief Financial Officer
RESILIENT FINANCIAL PERFORMANCE

• Underlying Funds From Operations (“UFFO”) was £52.1               Proportionally consolidated                                       FY20     FY19
  million, including lost income and provisions specifically                                                                            £m      £m
  relating to COVID-19 of £2.8 million, compared to £55.1           Revenue                                                           148.2    141.9
  million in FY19
                                                                    Property operating expenses                                       (55.3)   (51.4)
• Administrative expenses increase principally due to a             Net property income                                                92.9    90.5
  full year of costs relating to Hawthorn Leisure, and the
                                                                    Administrative expenses                                           (19.8)   (16.2)
  movement of pub management from a third-party
  platform to Hawthorn Leisure, which also decreased                Net finance costs                                                 (22.0)   (18.7)
  property operating expenses
                                                                    Taxation                                                             1.0   (0.5)

• Increase in net finance costs mainly due to                       Underlying Funds From Operations                                   52.1     55.1
  implementation of IFRS 16, which added £2.9 million               Underlying FFO per share                                          17.0p    18.1p

• Ordinary dividend per share of 16.2 pence (FY19: 21.6             Ordinary dividend per share                                       16.2p    21.6p
  pence), with cover1 improved from 84% to 105%.                    Ordinary dividend cover1                                          105%      84%

                                                                Weighted average # shares                                             306m     304m

                                                               1.    Calculated with reference to Underlying Funds From Operations.

                                                                                                                                                    13
NET PROPERTY INCOME (£M):
                                                                                                                           RETAIL PORTFOLIO

           NON-
         RECURRING
                                                                    4.8          (3.0)
68.6       (1.7)                                                                                                               2.9       68.4

                        (3.5)
                                                                                               (0.9)
                                                                                                           0.2       65.5

                                                      0.4
                                        0.6

                          Retail LFL impact
                          CVA/Admin impact                           (2.5)%
                          Excluding CVAs/Admins                      (3.5)%
                          LFL net property income                    (6.0)%

Mar-19   Surrender   Like-for-like      Asset      Completed    Acquisitions   Disposals   COVID-19 rent   Other              IFRS 16    Mar-20
          premia                     management   development                               provisions                      adjustment
                                        fees
                                                                                                                                                  14
NET PROPERTY INCOME (£M):
                                                                                                                                             PUB PORTFOLIO

                                                                0.7          (0.6)
                                                0.6                                         (1.6)
                                2.3

                                                                                                              (0.8)

                                                                                                                           (0.4)               0.2
                                                                                                                                     24.3                24.5
             2.2

21.9

             Driven by +5.9% LFL
             EBITDA per pub growth
             (excl. March 2020)

Mar-19   Like-for-like   Hawthorn Leisure Star Pubs & Bars   Bravo Inns     Disposals   Rent and stock       COVID-19      Other              IFRS 16    Mar-20
                           acquisition       acquisition     acquisition                  provisions     lockdown impact                    adjustment
                             (full year)      (full year)     (part year)

                                                                                                                                                                  15
ORDINARY DIVIDEND POLICY

• Total ordinary dividend per share of 16.2p (FY19:                          3.0
                                                                           Special                   No dividend
  21.6p) following decision not to pay a Q4                                                   21.6   paid for Q4
                                                                                     21.0               amid
  dividend due to the impact of COVID-19                                   20.0                       COVID-19
                                                                    18.5                      5.4    uncertainty
                                                                                     5.25
• Dividend 105% covered by UFFO (FY19: 84%)                                5.00
                                                                                                        16.2
                                                                    4.75

• Decision taken not to pay a Q1 dividend for FY21
                                                                                     5.25     5.4        5.4
  due to continuing uncertainty around the impact                          5.00
                                                                    4.75
  of COVID-19

                                                                                     5.25     5.4        5.4
• It is our firm intention to resume dividend                       4.50
                                                                           5.00

  payments as quickly as possible, when
  conditions allow
                                                                    4.50   5.00      5.25     5.4        5.4

                                                      DPS (pence)   FY16   FY17      FY18    FY19       FY20

                                                                                                                   16
UNENCUMBERED BALANCE SHEET

• Our balance sheet is fully unsecured and our assets   Proportionally Consolidated      March      March
  are unencumbered                                                                       2020        2019
                                                                                           £m         £m
• Investment property was £1.20bn at 31 March 2020      Properties at valuation           1,197.1   1,288.4
  (March 2019: £1.29bn)
                                                        Other Assets                       118.0      36.4
• EPRA NAV per share of 201 pence, compared to 261
  pence per share at 31 March 2019, 54p of the          Cash                                82.1      27.6
  reduction related to portfolio valuation decline
                                                        Borrowings                       (645.7)    (502.7)
• LTV at 47%, increased from 37% at 31 March 2019,
  within policy but above internal guidance; LTV        Other Liabilities                (140.9)     (53.6)
  improvement a key priority for FY21
                                                        IFRS net assets                   610.6      796.1

                                                        EPRA NAV per share                 201p       261p

                                                        LTV                                47%        37%

                                                                                                          17
LTV AND DEBT COVENANTS

• LTV of 47% is above internal guidance of 40% but below internal policy of 50%
• Good headroom still remains across our unsecured bank facilities and corporate bond
• Disposal programme in FY21 focused on improving LTV
• On 1 April 2020, Fitch Ratings affirmed NewRiver’s Long-Term IDR at ‘BBB’ with a Stable Outlook and senior unsecured
  rating at ‘BBB+’.

                          Facility       Drawn         Maturity1         Covenants

                                £m            £m                      LTV Interest Cover      Sensitivity analysis – as at 31 March 2020

RCF                             215           170          4.3 yrs   1.75x   • LTV Covenant: Would require a c.22% reduction
                                                                                                in portfolio valuation
Term Loan                       165           165          4.3 yrs   1.75x
                                                                                              • ICR Covenant: Would require a c.66% reduction in
Bond                           300           300           7.9 yrs   1.5x     net property income
NRR Reported                   680           635           5.9 yrs   47%              3.8x

1. Assuming one-year extension options are bank approved
                                                                                                                                                   18
DEBT STRUCTURE & MATURITY

• No refinancing events required until 2023

                                                   £m
                                                   350

                                                   300

                                   £215m
                                                   250

        £300m
                                                   200

                                                   150

                                                   100

                           £165m                    50

                                                    0
                                                            2020         2021   2022       2023        2024    2025       2026        2027   2028

          Unsecured bond     Unsecured term loan         Unsecured RCF          Unsecured term loan (with       Unsecured RCF (with
                                                                                extension option)               extension option)
Community Pub Review – Hawthorn Leisure
HAWTHORN LEISURE
                                                                                                                            PUB REOPENING PLAN

                                            Team-based approach to building back revenues

            People                                Property                               Proposition                            Profitability

Managing safe return of head office
                                       Capex focused on smaller projects                                               Pub partner conditional support grant
   staff and field-based team                                                    Reopening guide for pub partners
                                          rather than transformations
                                                                                          and tenants
                                                                                                                       Enhanced financial modelling of pubs
   Risk and safety assessments
                                         Continue to see value-creating                                                             revenues
                                                                                Wet led and local community pubs
                                      opportunities for residential and other
                                                                                  set to bounce back quickest
                                              uses on surplus land
Personal protective equipment for
                                                                                                                               Credit control plans
    pub partners and tenants
                                                                                Switch supply chain back on having
                                       Identify non-core pubs for disposal
                                                                                maintained strong relationships with
                                      and those for conversion to operator                                             Plan to return to pre-COVID19 trading
High levels of goodwill generated                                                            suppliers
                                                    managed                                                                    levels within 12 months
within business during lockdown

                                           Well-placed for reopening of estate on 4 July 2020

                                                                                                                                                           21
OVERVIEW OF HAWTHORN LEISURE IN FY20

                                                                       Disciplined Stock Selection
Leveraging our platform
/ disciplined balance sheet                                            • Acquisition of Bravo Inns for £17.9m, NIY of 14.0%
                                                                       • Acquisition of 28 pub portfolio for £9.7m, NIY of 9.5%
• 720 pubs across England, Scotland and Wales
• Vast majority are wet-led community pubs
• Valuation performance –8.2% (pubs decline entirely
  related to COVID-19)

                                                                            Active asset management
                                                                            • EBTIDA per pub excluding month of March 2020
                                                                              was +5.9%; +2.3% (inc. COVID-19)
                                                                            • High pub occupancy of 97.0%
Profitable capital recycling                                                • Completed 82 capital investment projects at a
                                                                              cost of £4.3m
• £23.7m of sale proceeds in FY20
• 30 pub and land sales; £8.2m of disposal
  proceeds, 11% premium to March 2019 valuation
• 14 c-store sales; £15.6m of disposal proceeds, at
  a NIY of 5.2%                                        Risk-controlled development
• Investment market has remained liquid during
  lockdown, with continued investor appetite           • Completed one c-store development, bringing total to date to 26
                                                       • Continuing to review portfolio for further opportunities for c-store
                                                         and residential development
                                                       • Plenty of further value-creating opportunities

                                                                                                                                  22
DISCIPLINED STOCK SELECTION:
                                                                        ACQUISITION OF BRAVO INNS-£17.9M

• In December 2019, acquired Bravo Inns for £17.9m,
  representing an EBITDA multiple of 6.8x
• Bravo Inns owns 44 wet-led community pubs,
  predominantly located in North West England
• Portfolio is high-quality, well-managed and well-
  invested; highly complementary to existing portfolio
• Acquisition increases our exposure to the operator
  managed pub model
                                                         Chapel House, Burtonwood
• Operator managed model provides opportunities to
  drive higher returns through accretive capex and
                                                                                             Operator
  asset management initiatives, whilst providing a                44                         Managed
                                                                  community pubs
  higher degree of management control and oversight                                          model

                                                                                                        23
DISCIPLINED STOCK SELECTION:
                                                                      ACQUISITION OF 28 PUBS FROM MARSTON’S

• In January 2020, acquired a hand-picked portfolio of
  28 pubs from Marston’s in an off-market acquisition
• Acquisition price of £9.7 million, reflecting a net initial
  yield of 9.5%
• Opportunities to drive income returns from targeted
  capex projects
• Several sites include significant surplus land,
  providing development opportunities
                                                                The Freemasons Arms, Droitwich
• Current operating model provides flexibility in
  realising asset management and development
                                                                                                   Leased &
  opportunities at the assets                                            28                        Tenanted
                                                                         community pubs
                                                                                                   model

                                                                                                              24
ACTIVE ASSET MANAGEMENT: TARGETED CAPITAL INVESTMENT

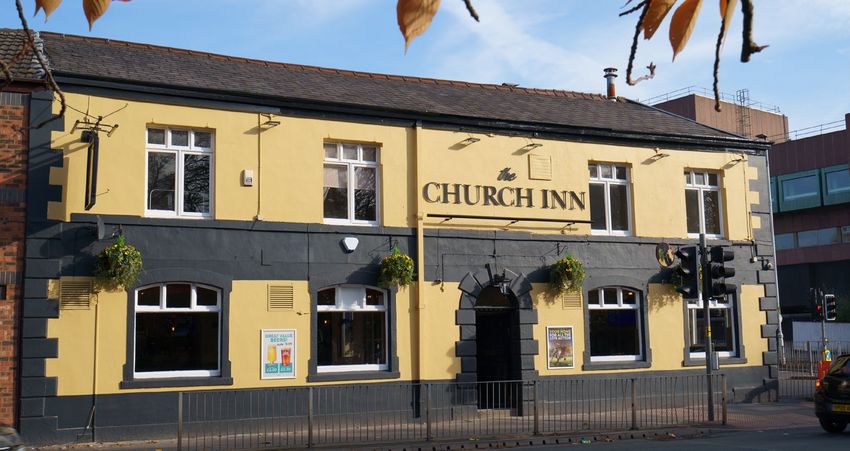
The Church Inn, Swinton, Greater Manchester

•   Popular community wet-led pub operating under operator managed model
•   £210,000 spent on refurbishment work, introducing new lighting and décor,
    pool tables and dart boards, and installing Sky and BT Sports
•   On completion, a new highly-experienced operator was appointed, and the
    pub has since delivered a Return on Investment of 74%
•   Plans well advanced for reopening at the beginning of July

The Goodrest Tavern, Worcester

•   Local community pub dating from 1940s, adjacent to NewRiver-built c-store
•   £100,000 spent on installing Sky and BT Sports, new widescreen TVs and a
    refurbished modern bar area, as well as a family games room
•   Outside has benefited from a new children’s play area and a heated
    outside seating area, which is open year-round
•   Community hub, supporting local charities during lockdown
                                                                                                                25
RISK-CONTROLLED DEVELOPMENT IN HAWTHORN LEISURE:
                                                                                  RESIDENTIAL DEVELOPMENT

•   The Wheatsheaf pub benefited from a large plot of
    land to the rear that was used as a caravan park
    and campsite

•   Following a change in tenant at the pub we were
    able to facilitate a surrender of the land back to
    Hawthorn Leisure at nil cost

•   The land was sold for £342,500 to a local housing
    developer, upon securing planning permission for
    the construction of nine new homes

•   Following the sale, we invested in a refurbishment
    of the pub to drive trade and enhance capital
    values

•   Further 116,300 sq ft of residential development in
    pub portfolio development pipeline                         Proposed development at The Wheatsheaf, Hatfield Peverel

                                                                                                                          26
Property Review - Retail
Allan Lockhart: Chief Executive
DIVERSIFIED INCOME STREAMS:
                                                                      FOCUSED ON ESSENTIAL GOODS AND SERVICES

• 1,800 leases with >850 occupiers                              Retailer
                                                                                   % NRR total rental   Number of
                                                                                             income        stores
• Focused on occupiers providing essential goods       1                                        2.3%            3
  and services, providing some insulation from         2                                         2.1%          12
  COVID-19 impact                                      3                                         1.7%          20

• Deliberately limited exposure to structurally-       4                                         1.7%          16

  challenges sub-sectors such as casual dining,        5                                         1.6%           8

  department stores and mid-market fashion             6                                         1.5%          17
                                                       7                                         1.4%           4
• Top 10 retailers account for just 16% of total       8                                         1.3%           8
  rental income, top 100 account for 5% of total rent            10                                        1.2%           4
  (Sainsbury’s currently 2.3%)                                  Subtotal                       16.0%
                                                       11-25   e.g.                             12.4%
• Affordable average retail rent of £12.66 per sq ft
                                                       26-100 e.g.                             19.4%
                                                                                               47.8%
                                                                                                                    28
VALUATION PERFORMANCE

31 March 2020        Valuation     Valuation       NEY          NEY           ERV
                                                                                                        COVID-19 Impact
                    NRR share     movement                  movement      movement

                           £m             %           %           bps            %
                                                                                       •   Across total portfolio 31% of -12.3% valuation
Shopping centres           620         (14.9)       8.4            78          (5.8)       movement attributable to COVID-19 lockdown:
Retail parks               224          (8.9)        7.4           27          (4.0)         •   Shopping centres: accounted for 20% of
                                                                                                 valuation decline
High street                  12        (17.0)       9.3            77          (4.5)
                                                                                             •   Retail parks: accounted for 26% of valuation
Pubs & c-stores            275          (8.2)        11.1             -            -             decline
Development                 66         (14.0)           -             -            -         •   Pubs: accounted for all of the decline

Total portfolio           1,197        (12.3)       8.9            68         (5.5)

Portfolio outperformed the MSCI-IPD Index across all key performance measures:

•   Total return: +480 bps outperformance, with result of –5.4%

•   Income return: +230 bps outperformance, with result of +7.8%

•   Capital growth: +240 bps outperformance, with result of –12.4%:

                                                                                                                                                29
ALTERNATIVE USE VALUATION

    Retail valuations underpinned by alternative uses1                       Shopping centres                       Retail parks
                   £916m
                 Development
                                            12%                                       AUV                                AUV

                                                                            8% below                           21% below
                   High street                              £803m
                                                                 Offices
                                                                              March 2020 valuation               March 2020 valuation
                 Retail Parks                                Logistics

                                                                                Residential                          Logistics
                                                                           Most common alternative use        Most common alternative use

                                                           Residential
                  Shopping
                   Centres

          March 2020 retail                            Alternative Use
          portfolio valuation                             Valuation

1. Alternative use valuation calculated internally by NewRiver                                                                              30
DISCIPLINED STOCK SELECTION:
                                                                                                          SPRUCEFIELD RETAIL PARK, LISBURN

•   In December 2019, acquired Sprucefield Retail Park in Lisburn
    for £40.0 million, representing a NIY of 8.7%

Acquisition rationale

•   One of Northern Ireland's leading out-of-town retail
    destinations, adjacent to the main junction of the M1 motorway
    and A1 road, connecting to the Irish Republic
                                                                                                                          Development sites
•   Anchored by Sainsbury’s and B&Q, with an average rent of
    £16.11 per sq ft with a WAULT of 7.5 yrs

•   Site includes 18 acres of development land, which can be sold
    in parcels

•   Average capital value of £19 per sq ft across entire site

Progress since acquisition

•   Signed a 10-year lease with B&M on vacant unit; currently on-
    site with fit-out works

•   Retail park has performed strongly during lockdown

•   Strong interest from logistics operators for surplus land        Site plan of Sprucefield Retail Park, Lisburn

                                                                                                                                              31
ACTIVE ASSET MANAGEMENT

• Completed 678,100 sq ft of new lettings and          Leasing activity consistent throughout the year (sq ft)
  renewals across retail portfolio in FY20, securing
                                                                                                             188,200
  £5.7 million of annualised rent
                                                        172,200
                                                                          165,700
• On average, long-term deals were signed 1.2%
                                                                                            152,000
  ahead of previous passing rent and 0.8% ahead
  March 2019 ERV

• Long-term deals had an average lease length of 8.6
  years

• Retail occupancy remained high at 94.8% (31 March
  2019: 95.2%)

• Reduced service charge budgets by 5% on average
  compared to the prior year; further reductions
  identified in response to COVID-19
                                                            Q1               Q2                Q3                Q4
                                                                                     FY20

                                                                                                                       32
RISK-CONTROLLED DEVELOPMENT

• 2.5 million sq ft risk-controlled projects, including 0.9                             2.5m sq ft
  million sq ft of planning consents                                         risk-controlled development pipeline
                                                                                        by end purpose
• 72% of pipeline relates to residential development             1.8

• Most projects will be developed in capital
  partnerships or sold with the benefit of planning

• For smaller projects with a lead time of less than 12
  months, we can deliver ourselves through
  experienced in-house development scheme

• Very limited committed capex across the
  development pipeline                                                        0.3
                                                                                           0.2
                                                                                                         0.1         0.1
RISK-CONTROLLED DEVELOPMENT PIPELINE:
                                                                                              PROGRESS DURING FY20

The Avenue Shopping Centre,                                                            Prospect Shopping Centre, Hull
Newton Mearns                                                                            • Planning approval for 58 residential units in
    • Progressed planning application                                                      vacant office space adjacent to the centre, to
      for 36 residential units, to be built                                                be sold to local housing developer
      adjacent to the centre; under offer
      to a local developer

                                                                                        Newlands Shopping Centre, Witham
Railway Street Retail Park, Dewsbury                                                      • Producing a masterplan for the centre
•    Signed an agreement for lease with                                                     including 129 new residential units
     Aldi to occupy a 19,000 sq ft space                                                  • Pre-application to be submitted in summer
     created by the expansion of a unit                                                     2020
     currently occupied by Next

                                                                                        Grays Shopping Centre
                                                                                          • First community planning engagement
Poole Retail Park                                                                           attended by hundreds of local residents
    • Agreed terms with a national retailer to                                            • Development would significantly reduce
      occupy a new 80,000 sq ft unit                                                        retail provision at the site, and deliver in
                                                                                            excess of 800 new residential units
                                                                                          • Feedback formed basis of pre-application
                                                                                            submitted to Thurrock Council in May 2020

                                                 Pre-planning   In planning   Planning granted
                                                                                                                                           34
COMMITTED TO OUR COMMUNITIES

   Corporate charity partnership with the Trussell Trust                             GRESB
                                                                                      • 13% improvement from prior year, and
                                                                                        94% improvement from first submission
                                                                                      • GRESB Green Star received for second
                                                                                        consecutive year

                                                                                     BREEAM
                                                                                      • Very Good certification achieved for Canvey
                                                                                        Island Retail Park
                                                                                      • Included a pedestrian and cyclist friendly site
The Trussell Trust supports over 1,200 food banks across the UK,                        design and exceeding regulatory energy
  and campaigns to ensure everyone can afford their own food                            performance

                          NewRiver’s contribution:

                                                                                     Supporting employment and opportunities
                                                                                      • We support over 15,500 jobs across the UK
                                                                                      • Participate in the UK Government’s
                                                                                        Apprenticeships scheme at head office and
Collection points       Staff      Use of assets for   Corporate   Board 30% and
 across centres     volunteering     storage and       donations   ExCo 10% salary      asset-level
                    programme        recruitment                       waiver

                                                                                                                                          35
SUMMARY

• FY20 a year of robust financial and operational performance

• Strong cash and liquidity position

• Portfolio positioning has insulated us from some COVID-19 headwinds

• Well advanced in rent collections and plans to rebuild retail and pub revenues in FY21

• Progress already made towards disposal target for FY21, enabling us to improve LTV in-line with guidance

• Opportunities to continue growth through capital partnerships, leveraging market-leading platform

                                                                                                                   36
Appendices
APPENDICES INDEX

Appendix title                                                Slide #   Appendix title                                                         Slide #
Background information                                                  Valuation
Presentation team                                                 39    Valuation performance                                                      56
Management track record                                           40    Valuation analysis for shopping centres and retail parks                   57
Performance track record                                           41   Alternative Use Valuation: Methodology and assumptions                     58
Our proven business model                                         42    Risk-controlled development
Our portfolio                                                     43    Risk-controlled development pipeline                                       59
Top 10 assets by value                                            44    Burgess Hill                                                               60
Financial information                                                   Cowley, Oxford                                                              61
Dividend track record                                             45    Grays                                                                      62
Revenue                                                           46    Community pub portfolio
Net rental income                                                 47    Community pub portfolio timeline                                           63
Retail lease profile                                              48    Pub operating models: overview                                             64
Reconciliation of IFRS (Loss)/Profit after taxation to UFFO       49    Leased & Tenanted model                                                    65
Adjusted Funds from Operations                                    50    Operator managed model                                                     66
Financial policies                                                 51
Financial polices and additional guidelines                       52
Loan to value                                                     53
Number of shares                                                  54
EPRA NAV per share                                                55

                                                                                                                                                     38
PRESENTATION TEAM

Allan Lockhart – Chief Executive, NewRiver
•   Co-founded NewRiver in 2009 as Property Director. Appointed CEO effective 1 May 2018

•   Started his career with Strutt & Parker in 1988 advising major property companies and institutions on retail investment and development

•   In 2002, Allan was appointed as Retail Director of Halladale plc and was responsible for the acquisition and management of over 20
    shopping centres and several profitable retail developments

•   Responsible for NewRiver’s property strategy including acquisitions, disposals, asset management and risk-controlled development

Mark Davies – Chief Financial Officer, NewRiver and Chief Executive, Hawthorn Leisure
•   Joined NewRiver as CFO at its inception in 2009. Assumed operational responsibility for the pub portfolio from 1 May 2018 and
    appointed Chief Executive of Hawthorn Leisure effective 1 October 2019

•   Mark is a Chartered Accountant and started his property finance career with Grant Thornton before joining PKF (now BDO LLP) as a
    partner and Head of Real Estate

•   Prior to joining NewRiver as Finance Director in 2009, Mark was CFO of Exemplar Properties and Finance Director of Omega Land, a
    £500m property JV with Morgan Stanley

•   Responsible for the capitalisation of the NewRiver balance sheet, including the raising of >£800m of equity and the move to an
    unencumbered balance sheet
                                                                                                                                              39
MANAGEMENT TRACK RECORD

                                                                                                      December 2014
1991
                                                                        June 2013                     £75m equity raise
Halladale plc established                                                                                                                                                                 May 2019
                                                                                                      to acquire
                                                                        £67m equity raise
                                                                                                      BRAVOs stake in                                                                     New Joint
                                                                        to finance
                                                                                                      first JV                                                                            Venture
                                                                        acquisitions
                 January 2007                                                                                                                                          March 2018         partnership
                                                                        cornerstoned by
                                                                                                                 June 2015                        July 2017                               with
                 Halladale plc sold to listed                           Invesco                                                                                        £300m debut        BRAVO
                 Australian group for significant                                                                £150m                            £225m                unsecured
                 premium                                                      November 2013                      equity raise                     equity raise         bond issued
                                            June 2011
                                                                              First pub portfolio                to fund                                               BBB+ issue
                                             £42.5m equity raise to                                              acquisitions                                          rating from
                                                                              transaction with
                                             finance acquisitions                                                                                                      Fitch
                                                                              Marston’s

                                                                                             January 2014              December 2015
                                                                                                                                                                                 Sep 2018
2001                                                                                         £85m equity raise         £150m equity                  August 2017
                                     March 2010                                                                                                                                  First 3rd party asset
                                                                                             supported by a            raise to fund                 £430m
Halladale plc lists on               Established a JV with                                                                                                                       management
                                                                                             number of new             acquisitions                  unsecured
London Stock Exchange                Morgan Stanley                                                                                                                              mandate signed
                                                                                             institutions                                            refinancing of
                                                                                             including:                                              bank facilities
                                                                                             Standard Life and
                                                                                                                                                                           May 2018
         September 2009                                                                      Deutsche
                                                                 December 2012                                                                                             Acquisition of
         NewRiver REIT established and                                                                                                 August 2016
                                                                 Established first JV with                                                                                 Hawthorn Leisure
         initial public offering on London
                                                                 BRAVO, who also took                                                  Obtained premium listing            for enterprise
         Stock Exchange
                                                                 an 8.7% equity stake in                                               on Main Market of                   value of £106.8m
         Newly established vehicle with                          the company                                                           London Stock Exchange
         no legacy issues

                                                                                                                                                                                                         40
PERFORMANCE TRACK RECORD

                                                             FY20         FY19        FY18               FY17        FY16
Annualised rent roll                                       £117.9m     £114.6m     £100.1m            £96.5m       £85.1m
Underlying FFO (‘UFFO’)                                     £52.1m      £55.1m     £55.5m              £47.1m     £37.9m
Underlying FFO (‘UFFO’) per share                            17.0p        18.1p      19.5p              20.1p       21.4p
Ordinary dividend per share                                  16.2p       21.6p       21.0p              20.0p       18.5p
Total dividend per share                                     16.2p       21.6p       21.0p              23.0p       18.5p
Total dividend cover (based on UFFO)                         105%         84%         93%                101%        116%

EPRA Net asset value per share                                201p        261p       292p               292p        295p
Total accounting return                                      -14.7%      -3.3%       +8.1%              +5.7%      +18.1%
Portfolio (NRR share)                                      £1,197m    £1,288m     £1,239m              £1,131m     £970m
Net debt                                                  £563.6m      £475.1m    £344.7m             £417.9m    £261.7m
LTV                                                            47%         37%        28%                 37%        27%
Cost of debt1                                                 3.4%        3.2%        3.1%               3.5%        3.7%
Interest cover ratio                                          3.8x        4.0x        4.7x               4.5x        4.3x
Debt maturity2                                            5.9 years   6.9 years   7.9 years          2.5 years   3.5 years

Retail occupancy                                             94.8%      95.2%       96.5%                97%         96%
Like-for-like retail net property income                     -6.0%       -2.0%      +0.9%               +1.2%       +2.4%
Average retail rent per sq ft                               £12.66      £12.52      £12.36             £12.45       £12.14

1. Assumes revolving credit facility is fully drawn
2. Assumes extension periods are exercised and approved
                                                                                                                         41
OUR PROVEN BUSINESS MODEL

Leveraging out platform                                                    Disciplined Stock Selection
/ disciplined balance sheet                                                We target high yielding assets with low risk characteristics in our key sectors of
                                                                           community shopping centres, conveniently-located retail parks and community pubs.
We leverage the scale and expertise of our platform, underpinned by
                                                                           We acquire these assets either directly or through joint ventures. Our significant
a conservative and unencumbered balance sheet, to drive further
                                                                           market experience and in-depth analysis enable us to price risk appropriately and buy
returns. This includes using our platform to manage assets owned by
                                                                           assets at the right prices.
third parties or which we own through joint ventures with third parties.

                                                                                                  Active asset management
                                                                                                  We enhance and protect income returns through our asset
Profitable capital recycling                                                                      management initiatives, which range from the deployment of
We regularly assess potential upside opportunities in                                             targeted capex to improve asset environments to measures to
disposing of assets and recycling capital into new                                                reduce occupational costs for occupiers. We draw on our in-
opportunities, and we have a track record of doing this                                           house expertise, a deep understanding of our market and
profitably. These disposals are typically of mature assets                                        strong relationships with our occupiers to achieve this.
where our estimates of forward looking returns are below
target levels, assets where we believe the risk profile has
changed, or assets sold to special purchasers.

                                                                                     Risk-controlled development
                                                                                     We create income and capital growth through our risk-controlled
                                                                                     development pipeline. Our in-house development team works with
                                                                                     stakeholders to obtain valuable planning consents, which we can develop
                                                                                     ourselves or sell to crystallise a profit. Our risk controlled approach
                                                                                     means that we will not commit to developments without securing
                                                                                     significant pre-lets or pre-sales.

                                                                                                                                                               42
OUR PORTFOLIO

33 Shopping Centres                                           720 pubs
Disposals in FY20:                                            Acquisitions in FY20:
•   Central Square, Erdington                                 •  Bravo Inns (44 pubs)
                                                              •  28 pubs acquired from Marston’s

25 Retail Parks                                               Completed developments in FY20
                                                              •  One c-store, at the Sea View Inn, Poole
Acquisitions in FY20:
                                                              Disposals
•  Kittybrewster Retail Park, Aberdeen (50%)
                                                              •   30 pub and land disposals
•  Telford Retail Park, Inverness (50%)
                                                              •   14 c-stores
•  Units at Kingsway East Retail Park, Dundee (50%)
•  Wakes Retail Park, Newport, Isle of Wight (50%)
•  Poole Retail Park (10%)
•  Sprucefield Retail Park, Lisburn

Disposals in FY20:
•   Daventry Retail Park

4 Asset Management Mandates
New in FY20:
•  Nicholsons Centre, Maidenhead (Owner: Areli Real Estate)
•  Kirkby Town Centre (Owner: Knowsley Council)

                                                                                                                       43
TOP 10 ASSETS BY VALUE

 Name                                                          Floor area    Gross rent   Occupancy    Key occupiers
                                                                ‘000 sq ft
Broadway Shopping Centre & Broadway Square Retail Park,                                                Sainsbury’s, M&S, Boots
                                                                531,000       £10.9m        99%
Bexleyheath                                                                                            Wilko

Abbey Centre, Newtownabbey                                      320,000        £5.9m        95%        Primark, Poundland, Next

Priory Meadow Shopping Centre, Hastings                         286,000        £5.0m        100%       Primark, M&S, Poundland, Boots

Sprucefield Retail Park, Lisburn                                231,000        £3.7m        100%       Sainsbury’s, B&M, B&Q, Argos

Templars Square Shopping Centre, Cowley, Oxford                 264,000        £3.2m        95%        Wilko, Co-op, Iceland, Poundland
                                                                                                       Primark, Superdrug, Home
Hillstreet Shopping Centre, Middlesbrough                       240,000        £4.1m        96%
                                                                                                       Bargains
                                                                                                       Primark, Next, JD Sports,
Cornmill Shopping Centre, Darlington                            245,000        £3.4m        95%
                                                                                                       Waterstones
Grays Shopping Centre, Grays                                    228,000        £2.0m        97%        Poundland, Wilko, Iceland
                                                                                                       Asda, M&S Simply Food, Boots,
The Avenue, Newton Mearns                                       199,000        £2.4m        98%
                                                                                                       Superdrug
Capitol Shopping Centre, Cardiff                                170,000        £2.3m        91%        Boots, Tesco, The Gym

Aggregate value of top 10 assets: £460 million, 38% of total portfolio

                                                                                                                                       44
DIVIDEND TRACK RECORD
                                                   3.0
                                                 Special
                                                                          Q4 dividend not paid due to
                                                                  21.6      COVID-19 uncertainty
                                                  20.0     21.0
                                                                            It is our firm intention to
                                                                         resume dividend payments as
                                          18.5                    5.4      quickly as possible, when
                                                           5.25
                                   17.0                                           conditions allow
                     16.0   16.0                  5.00

              15.0                        4.75
                                   4.25
                                                                  5.4                       5.4
                                                           5.25
                                                  5.00
                                          4.75
                                   4.25

                                                           5.25   5.4                       5.4
                                                  5.00
                                          4.50
                                   4.25

                                                  5.00     5.25   5.4                       5.4
                                   4.25   4.50

DPS (pence)   FY12   FY13   FY14   FY15   FY16    FY17     FY18   FY19                     FY20

                                                                                                          45
REVENUE

Accounting basis £m                 12 months to 31 March 2020            Annualised as at 31 March 2020
                                    Group     JVs & Funds        Total     Group    JVs & Funds            Total
Shopping Centres                     59.5             0.6         60.1      59.2            0.6            59.8
Retail Parks                           11.4           2.7         14.1       14.0           3.6             17.6
High Street                             1.7             -          1.7        1.6             -              1.6
Pubs & Convenience Stores             51.2              -         51.2      58.4              -            58.4
Development                            2.8              -          2.8        2.7             -             2.7
                                     126.6            3.3        129.9     135.9            4.2            140.1
Service charge income                16.9               -         16.9
Amortisation of letting and legal     (1.5)             -         (1.5)
Surrender premia                       1.0              -          1.0
Asset management fees                 0.9               -         0.9
Other sundry income                   0.9             0.1          1.0
Gross rental income                 144.8             3.4        148.2

                                                                                                               46
NET RENTAL INCOME

Accounting basis £m         12 months to 31 March 2020            Annualised as at 31 March 2020
                            Group JVs & Funds            Total     Group JVs & Funds             Total
Shopping Centres              47.7           0.4          48.1      47.5            0.4           47.9

Retail Parks                  10.4           2.6          13.0       13.0           3.6           16.6

High Street                    1.4             -           1.4        1.3             -            1.3

Pubs & Convenience Stores     24.4             -          24.4      25.5              -           25.5

Development                     1.1            -            1.1       1.1             -             1.1

Net rental income            85.0           3.0          88.0       88.4            4.0          92.4

Surrender premia               1.0             -           1.0
Asset management fees         0.9              -          0.9
Other sundry income           0.9            0.1           1.0
IFRS 16                        3.1             -           3.1
IFRS 9                        (1.1)            -          (1.1)
Net property income          89.8            3.1         92.9

                                                                                                      47
RETAIL LEASE PROFILE

          Passing rent of leases   ERV of leases expiring   Passing rent subject to    ERV of leases subject
                        expiring                                            review                 to review
                            £m                        £m                       £m                        £m
FY20                         7.1                     8.5                       6.4                      6.0

FY21                         7.1                     10.0                       4.1                      4.1

FY22-23                     16.0                     17.4                      10.1                      9.7

Total                      30.2                     35.9                      20.6                      19.8

                                                                                                           48
RECONCILIATION OF IFRS LOSS AFTER TAXATION TO UFFO

                                                                                                 FY20           FY19
                                                                                                   £m            £m

Loss for the year after taxation                                                                (121.1)        (36.9)
Adjustments
Revaluation of investment properties                                                             162.6          88.2
Revaluation of joint ventures’ investment properties                                               4.3            1.3
Revaluation of derivatives                                                                         2.8           3.2
(Profit) / loss on disposal of investment properties                                               1.8           (1.3)
Gain on bargain purchase                                                                              -         (7.0)
Deferred tax                                                                                       0.5               -
Exceptional cost in relation to Hawthorn Leisure and Bravo Inns                                    0.4           3.0
EPRA earnings                                                                                     51.3          50.5
Share-based payment charge                                                                            -          2.5
Depreciation of properties                                                                        0.8            0.8
Integration costs                                                                                     -           1.3
Underlying Funds From Operations                                                                  52.1          55.1
                                                                                                                     49
ADJUSTED FUNDS FROM OPERATIONS (AFFO)

                                                                                                                                                                     FY20                Restated FY19
                                                                                                                                                                       £m                          £m
Gross rental income (GRI)                                                                                                                                             129.9                        127.1
FFO before void costs for repairs                                                                                                                                     53.4                           56
Net contribution to R&M through service charge attributable to vacant units (A)                                                                                        (1.3)                       (0.9)
Underlying Funds From Operations (UFFO)                                                                                                                                52.1                         55.1
Essential capital expenditure undertaken outside service charge (B)                                                                                                   (0.9)                         (1.0)
Total maintenance capex incurred by NewRiver (A + B)                                                                                                                  (2.2)                          -1.9
Other adjustments (Rent free, Tenant incentives, L&L & Depreciation)                                                                                                  (0.2)                        (2.4)
Adjusted Funds From Operations (AFFO)                                                                                                                                 49.7                         50.8
Maintenance capex as percentage of UFFO                                                                                                                               4.2%                         3.4%
Maintenance capex as percentage of GRI                                                                                                                                 1.7%                        1.5%
Maintenance capex as a percentage of GAV                                                                                                                              0.3%                         0.2%

Analysis of capital expenditure                             FY20       Restated FY19     Criteria                                                                       Capitalised   Recoverable from
                                                              £m                 £m                                                                                                   tenants
Essential                                                      0.9                 1.0   Works required to maintain physical environment in state of good repair                            
Asset management                                              12.0                 8.6   Works planned, committed and undertaken linked to a future income stream                           
                                                                                         Capital expenditure linked to properties disclosed in the risk-controlled
Development capex                                              3.4                11.3                                                                                                      
                                                                                         development pipeline

 Total                                                        16.3                20.9

                                                                                                                                                                                                      50
CONSERVATIVE FINANCIAL POLICIES

                                                                                    Financial Policies             Proportionally consolidated

                                                                                                                 31 March 2020             31 March 2019
Net debt                                                                                                               £563.6m                       £475.1m
Principal value of gross debt                                                                                          £652.4m                       £510.0m
Weighted average cost of drawn debt1                                                                                       3.4%                         3.2%
Weighted average debt maturity of drawn debt1,2                                                                          5.9 yrs                      6.9 yrs
                                                                                             Guidance
FINANCIAL POLICIES AND GUIDELINES

 Financial Policies                                                     Policy          Reported
                                                               Guidance
LOAN TO VALUE

                                                                                  31 March 2020        31 March 2019

                                                                                            £m                   £m

Borrowings                                                                                628.6                502.7

Cash and cash equivalents                                                                 (80.8)               (27.1)

Net debt                                                                                  547.8                475.6

Equity attributable to equity holders of the parent                                       610.6                796.1

Net debt to equity ratio (‘Balance sheet gearing’)                                         90%                  60%

Share of joint ventures’ and associates’ borrowings                                         17.1                    -

Share of joint ventures’ and associates’ cash and cash equivalents                          (1.3)               (0.5)

Group's share of net debt                                                                 563.6                475.1

Carrying value of investment property and public houses                                  1,102.3              1,254.1

Carrying value of managed houses                                                           55.0                 26.9

Share of joint ventures’ and associates carrying value of investment properties            39.8                  7.4

Group's share of carrying value of investment properties                                 1,197.1             1,288.4

Net debt to property value ratio (‘Loan to value’)                                         47%                  37%

                                                                                                                    53
NUMBER OF SHARES

Number of shares (m)                                                          31 March 2020        31 March 2019

Weighted average – basic1                                                             305.9                304.0

Weighted average – diluted2                                                           306.2                304.5

Year end – basic3                                                                     306.2                304.8

Year end – diluted4                                                                   306.5                306.0

(1) For the purposes of Basic EPS, FFO and EPRA

(2) For the purposes of Diluted EPS and EPRA

(3) For the purposes of Basic Net Assets per share and EPRA NAV per share

(4) For the purposes of Diluted Net Assets per share and EPRA NAV per share

                                                                                                                   54
EPRA NAV PER SHARE (PENCE)

                                                                                PORTFOLIO REVALUATION: (54.4p)

                     16.8                  (21.6)

                                                                 (38.2)
   261

                                                                                     (6.9)
                                                                                                   (8.5)
                                                                                                                  (0.8)           (0.8)
                                                                                                                                              201

EPRA NAV     Funds From Operations Ordinary dividends paid   Shopping centres      Retail parks    Pubs      Development/other    Other     EPRA NAV
March 2019                                                                                                                                 March 2020

                                                                                                                                                        55
                                                                                                                                                        55
VALUATION PERFORMANCE

 As at 31 March 2020                                Valuation    Weighting         Valuation      Topped-up             NEY          LFL NEY          LFL ERV
                                                   NRR share     NRR share   surplus/(deficit)          NIY                         movement         movement
                                                          £m            %                   %              %               %              Bps                     %
 Regional shopping centres                               472            39               (17.6)           8.1             9.2             103                  (6.7)
 London shopping centres                                  148           12               (5.3)            5.8             5.9              22                  (1.8)
 Shopping centres                                        620            51              (14.9)            7.6             8.4              78                  (5.8)
 Retail parks                                            224            19               (8.9)            7.5             7.4              27                  (4.0)
 High street                                               12            1              (17.0)           10.1             9.3              77                  (4.5)
 Pubs & c-stores                                         275            23               (8.2)            11.1            11.1               -                     -
 Development                                              66            6               (14.0)               -               -               -                     -
 Total                                                   1,197         100              (12.3)            8.4             8.9              68                  (5.5)

                                                                                                      +480 bps
Outperformed the MSCI-IPD Index across all key return measures:                                                      MSCI-IPD Index1 outperformance in FY20

• Total return -5.4%: +480 bps outperformance
                                                                                                                           +230 bps              +240 bps
• Income return +7.8%: +230 bps outperformance

• Capital growth –12.4%: +240 bps outperformance
                                                                                                      Total return       Income return        Capital growth
1. Index includes monthly and quarterly valued retail                                                                                                              56
VALUATION ANALYSIS:
                                                                                                                      HIGH CASH YIELD, LOW AVERAGE LOT SIZE

                                     NewRiver Shopping Centres                                                                 NewRiver Retail Parks
                                      Average lot size: £20.2m                                                                Average lot size: £13.3m
                                            NEY: 7.4%                                                      18%
                                                                                                                                    NEY: 8.4%
                     18%

                     16%                                                                                   16%

                     14%                                                                                   14%

                     12%                                                                                   12%

                                                                                        Equivalent Yield
  Equivalent Yield

                     10%                                                                                   10%

                                                                        IPD1 EY: 8.2%
                     8%                                                                                    8%
                                                                                                                                                               IPD1 EY: 7.2%

                     6%                                                                                    6%

                     4%                                                                                    4%

                     2%                                                                                    2%

                     0%                                                                                    0%
                           0%   2%   4%      6%          8%       10%   12%       14%                            0%      1%                2%             3%           4%
                                           % NewRiver portfolio                                                                    % NewRiver portfolio

1. MSCI-IPD Quarterly Index, March 2020                                                                                                                                        57
ALTERNATIVE USE VALUATION:
                                                                                    METHODOLOGY AND KEY ASSUMPTIONS

• Valuation based on total site ownership rather than current building / massing

• Redevelopment assumes approximately 60% site coverage, with massing appropriate to site location

• Residential, industrial, office, hotel, miscellaneous/storage all reviewed, with use selected according to viability

• Assumes vacant possession (i.e. shopping centre not viable) and that planning has been achieved

• Demolition costs of redevelopment works are estimated at £10 per sq ft

• Costs allowance for external works assumed at 10% of construction cost, with an additional 5% contingency

• Construction costs are based on Building Cost Information Service (‘BCIS’) All-In Tender Price Index

• Residual Land Value is based on 15% profit on cost for redevelopment

• Residential sales prices use Land Registry price indices

                                                                                                                         58
RISK-CONTROLLED DEVELOPMENT PIPELINE: CONSOLIDATED

                           Shopping        Retail      Health &     Hotel    C-stores   Residential     Total    Retail &   Residential
                             Centre    Warehouse     Social Care                                                 Leisure      Pre-sold
                                                                                                                  Pre-let
                               sq ft         sq ft         sq ft     sq ft      sq ft         sq ft      sq ft         %             %

Completed in year/
                                   -        3,600              -   37,900      3,600         8,100     53,200        100             0
Under construction

Planning granted            266,300        12,000              -   49,800     10,700       549,100    887,900         57            29

In planning                        -             -             -         -     3,500        25,400     28,900        100             0

Pre-planning                       -      160,000        54,200          -     3,500      872,500 1,090,200           52             0

Near-term pipeline          266,300       175,600        54,200    87,700     21,300     1,455,100 2,060,200

Early feasibility stages           -             -             -   50,000           -     378,000     428,000

Total                       266,300       175,600        54,200    137,700    21,300     1,833,100 2,488,200
Additional residential
                                   -             -                       -          -      451,200
potential
Basingstoke Leisure Park    700,000              -                       -          -             -

                                                                                                                                          59
RISK-CONTROLLED DEVELOPMENT PIPELINE:
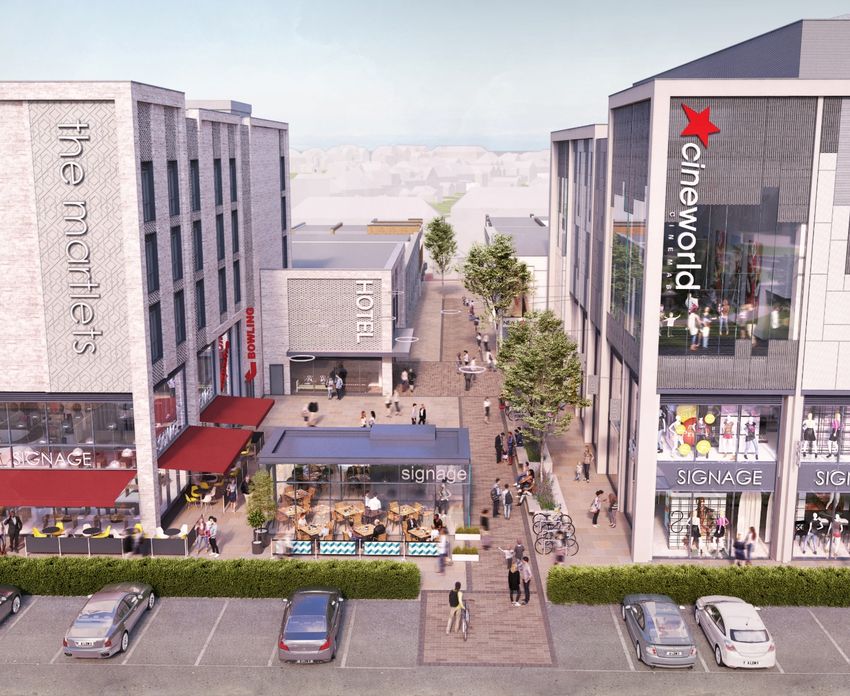
                                                                                 PLANNING GRANTED – BURGESS HILL

•   Earlier in the year, we submitted a revised planning application for
    the mixed-use regeneration of Burgess Hill town centre to Mid
    Sussex District Council.

•   Working closely with local stakeholders, we adjusted the design
    of the scheme to increase its residential provision, from 142 units
    to 172, and reduce space designated for retail, reflecting the
    changing nature of the retail market and needs of town centres.

•   The revised scheme will include a 16-lane bowling alley, a 10-
    screen multiplex cinema, and an 85-bed hotel with a new public
    café bar.

•   In addition, the development will provide a significantly improved
    public realm which would provide functional space for managed
    outdoor events.

•   COVID-19 has had an impact on planning committee schedules
    but we understand that the scheme remans a priority for Council
    to bring to committee over the summer.

                                                                                                              60
RISK-CONTROLLED DEVELOPMENT PIPELINE:
                                                                    PLANNING GRANTED – COWLEY, OXFORD

•   Acquired Templars Square Shopping Centre in Cowley,
    Oxford for £24.6m in December 2012

•   In July 2017, Oxford City Council approved plans for our
    major 236,000 sq ft mixed-use development to regenerate
    Templars Square Shopping Centre

•   The scheme will include 226 new residential apartments, a
    71-bed hotel, two new restaurant units, a modernised car
    park and major improvements to the public realm. The hotel
    and leisure element of the scheme is 82% pre-let

•   We are about to complete the Section 106 and Section 278
    Agreements at the site and are now identifying a delivery
    partner to advance the technical design and deliver the
    scheme

•   We are also exploring additional phases of development to
    unlock further mixed-use potential from the asset

                                                                                                     61
RISK-CONTROLLED DEVELOPMENT PIPELINE:
                                                                                                   PRE-PLANNING – GRAYS

•   We acquired Grays Shopping Centre in June 2018, as we recognised a
    significant value-creating opportunity for redevelopment at the site, which
    is located just 35 minutes from Central London by train.

•   We are currently working closely with Thurrock Council to bring forward a
    redevelopment plan that would reduce and repurpose existing retail
    floorspace, increase public open areas and facilitate an improved
    pedestrian flow through Grays town centre, as well as providing over 800
    new homes.

•   In February 2020, we held a Community Planning Weekend at the site,
    attended by hundreds of local residents and businesses who shared
    thoughts for the vision of a regenerated town centre.

•   The community input was collated and produced into a feedback report
    and conceptual layout which was presented to the public in the town
    theatre. The feedback vision document was then adapted to comprise a
    pre-application presentation which was submitted to Thurrock Council in
    May 2020. The outcome of the pre-app discussions will evolve the vision
    document further, which will then be presented back to the community
    prior to a formal planning application being prepared.

                                                                                                                     62
OUR PUB BUSINESS TRACK RECORD

                                        September 2015                                                                           October 2019
                                        Acquired 158 pubs from                                                                   Management team
December 2013                           Punch Taverns plc (the                                                                   changes and formation of
Acquired 202 pubs from Marston’s        ‘Mantle’ portfolio) yield of                                                             new Pub ExCo
PLC (the ‘Trent’ portfolio) under a     13.6%-£52.5M                             January 2018
four-year leaseback agreement yield                                              15th c-store        May 2018
of 12.5% for £90M                                                                handed over to      NewRiver acquires               December 2019
                                                                                 The Co-op           Hawthorn Leisure                Acquisition of Bravo
       April 2014                                                                triggering                                          Inns, including 44
       Deal signed with The                                                                          including 298 pubs,
                                                                                 performance         high quality platform for       pubs, for £17.9m, a
       Co-op to build c-stores                                                   receipts of £2.3m                                   yield of 14%
                                                                                                     £106.8M yield of 13.1%
       on excess pub land                            NEWRIVER

                                               HAWTHORN LEISURE
                                                                                                                          Jan 2019              Jan 2020
                       October 2014                                                                                       Completed             Acquisition of
                       Acquired 25 pubs from                                                                              integration of        29 pubs from
                                                                   May 2016
                       Nectar Taverns                                                                                     Hawthorn              Marston’s off-
                                                                   Acquired 11 pubs from
                                                                                                                          Leisure platform      market for
                                                                   JD Wetherspoon
                                                                                                                                                £9.7m, yield of
              June 2014
                                                                                                                   Dec 2018                     12%
              Acquired:
              275 pubs from Greene King                                                                            76 community pubs
                                                January 2016
              88 pubs from R&L Properties                                                                          acquired from Star
                                                Management of estate transferred onto
                                                                                                                   Pubs and Bars yield
                                                newly created platform based in
                                                                                                                   of 17%
   February 2014                                Birmingham
   Hawthorn Leisure established

                                                                                                                                                                  63
PUB OPERATING MODELS: OVERVIEW

                Leased & Tenanted                          Operator Managed                           Fully Managed

Number of NRR   •   589                                    •   126                                    •   5
pubs
Property        •   Occupational lease with Tenant         •   No landlord and tenant relationship    •   No landlord and tenant relationship
Interest                                                       established                                established

Employees and   •   Tenant is self-employed and            •   Operator employs all pub               •   NRR fully manages the pub and
pub                 employs all pub employees                  employees                                  directly employs all pub employees
management      •   Tenant incurs all operating costs of   •   NRR incurs all operating costs of      •   NRR incurs all operating costs of
                    running the pub                            running the pub, except for payroll        running the pub
                                                               which is borne by the Operator

Supply          •   Tied Tenants are required to           •   NRR sells all products for sale to the •   NRR supplies all drinks and food for
arrangements        purchase drinks from NRR and               Operator                                   sale at the pub.
                    lease machines from NRR approved       •   NRR retains ownership of products •        NRR retains ownership of products
                    suppliers                                  until sale to a customer                   until sale to a customer
Components of   •   NRR receives:                          •   NRR receives gross turnover            •   NRR retains all turnover generated
NRR income          1. Rental income                           generated by pub on a daily basis.         by the pub business
                    2. Margin between wholesale and            NRR then pays a management fee
                       sale price of drinks (if tied)          to Operator (on average c.20% of
                    3. A share of machine profits              net revenue)
                                                                                                                                               64
PUB OPERATING MODELS: LEASED & TENANTED

•   589 NRR pubs are leased &           Example tenant P&L                 £’000         Example NRR P&L                  £’000
    tenanted
                                        Wet income (Beer, wine, spirits)     280
•   Occupational lease in place with
    tenant, typically live above pub    Wet cost of sales                   (140)       Wet income to NRR                   140

•   Tenant is self-employed and         Net food income                       40        Wet cost of sales (from brewer)     (90)
    employs all pub employees           Total operating income               180        Net wet income                       50
•   Tenant incurs all operating costs   Machine income                         15
    of running the pub
                                        Machine income – share to NRR          (7)      Machine income (NRR share)            7
•   Tied tenants are required to
    purchase drinks from NRR and        Gross Profit                         188
    lease machines from NRR             Rent                                 (25)       Rental income                        25
    approved suppliers
                                        Direct operating costs               (110)
•   NRR receives rental income, a
    margin between wholesale price      Publican site profit                  53        Outlet EBITDA                        82
    and sale price and, a share of      Notional benefit of free
                                                                               12
    machine profits                     accommodation above pub

                                                                                                                              65
PUB OPERATING MODELS: OPERATOR MANAGED

•   126 NRR pubs are operator            Example NRR P&L                    £’000         Example operator P&L      £’000
    managed
                                         Wet income (Beer, wine, spirits)     477
•   NRR incurs all operating costs of
    running the pub, except for staff    Wet cost of sales                   (180)        Management fee from NRR      70
    costs which are borne by the
    Operator                             Net food income                          -       Staff costs                 (29)

•   NRR supplies all products for sale   Total operating income               297         Operator profit              41
    to the Operator
                                         Machine income                        20
•   NRR retains ownership of
    products until sale to a customer    Gross Profit                         317

•   NRR receives gross turnover          Management fee                       (70)
    generated by pub on a daily
                                         Direct operating & maintenance
    basis. NRR then pays a                                                    (117)
                                         costs
    management fee to Operator (on
                                         Outlet EBITDA                        130
    average c.20% of net revenue)

                                                                                                                        66
DISCLAIMER

The information in this presentation may include forward-looking statements, which are based on current expectations and
projections about future events. These forward-looking statements reflect the directors' beliefs and expectations and are
subject to risks, uncertainties and assumptions about NewRiver REIT plc (the “Company”), including, amongst other things,
the development of its business, trends in its operating industry, returns on investment and future capital expenditure and
acquisitions, that could cause actual results and performance to differ materially from any expected future results or
performance expressed or implied by the forward-looking statements.
None of the future projections, expectations, estimates or prospects in this document should be taken as forecasts or
promises nor should they be taken as implying any indication, assurance or guarantee that the assumptions on which such
future projections, expectations, estimates or prospects have been prepared are correct or exhaustive or, in the case of the
assumptions, fully stated in the document. As a result, you are cautioned not to place reliance on such forward looking
statements as a prediction of actual results or otherwise. The information and opinions contained in this document are
provided as at the date of this document and are subject to change without notice. No one undertakes to update publicly or
revise any such forward looking statements.
This presentation should also be read in the light of the Company’s results announcement for the 12 months ended 31 March
2020. No statement in this document is or is intended to be a profit forecast or profit estimate or to imply that the earnings
of the Company for the current or future financial years will necessarily match or exceed the historical or published earnings
of the Company.

                                                                                                                             67
NewRiver REIT plc
16 New Burlington Place
London
W1S 2HX
You can also read