The Alberni Valley's - Alberni Valley Community Foundation
←
→
Page content transcription
If your browser does not render page correctly, please read the page content below
The Alberni Valley’s
2018
Message from
                                                                                                                      Table of Contents

                                                                                                                      About the Vital Signs® Program    3
the Board Chair                                                                                                       Sustainable Development Goals
                                                                                                                      & Report Highlights               4
Once again, I am proud to serve on the board of the Alberni Valley Community Foundation, and proud to share
our 2018 Vital Signs® report with the community. In the three years since we released our first report, we have       Our Valley                        5
seen significant changes within the Alberni Valley. Issues that are impacting larger urban centres have cropped
up here, too – indeed, the opioid crisis, the need for adequate and affordable housing for all, and increased crime
have all made themselves known in the Alberni Valley. At the same time, important work has been done in the
                                                                                                                      Arts & Culture                    6
arenas of poverty reduction, reconciliation, and sustainability.
                                                                                                                      Belonging & Leadership            7
It can be difficult to make sense of the changes in our community and in our world. Much of how we perceive the
world is informed by the way an issue affects us or our loved ones, or what we read on social media. Vital Signs®     Children & Youth                  8
presents an alternative. Alongside community perceptions and opinions are indicators – discrete data points that
allow us to track change over time. We hope that the information in this report adds to your knowledge about the
Alberni Valley, and we hope that the data are used to inform planning and decision making in our community.
                                                                                                                      Environment                       9
Hugh Grist, Board Chair                                                                                               Food                             10
Alberni Valley Community Foundation
                                                                                                                      Getting Started                  11
                                                                                                                      Health & Wellness                12
Vital Signs team
Alberni Valley Community Foundation board members:                                                                    Housing                          14
                                                                                                                      Income Gawp                      16
                                                                                                                      Learning                         17
                                                                                                                      Recreation                       18
Hugh Grist    John Mayba     Olga Tardif   Peggy         Gillian        Ken Watson    Dave Jarrett   Robert Gunn
Chair                        Secretary     Hartman       Trumper
                                                                                                                      Safety                           19
                                           Treasurer

Research Facilitator: Maggie Hodge Kwan                                                                               Seniors                          20
The Alberni Valley Community Foundation would like to acknowledge that the geographical scope of this                 Work & Economy                   21
report is within the ancestral, traditional, and unceded territory of the Hupacasath and Tseshaht people.
                                                                                                                      Sources                          22
                                                                                                                      About the AVCF                   23
                                                                                       2
About The VitalSigns® Program
Vital Signs® is a community check-up conducted by community foundations across Canada. It measures the vitality of our
communities, identifies significant trends, and supports action on issues that are critical to our quality of life. For more information,
please visit www.communityfoundations.ca/vitalsigns.

Why a VitalSigns® report?                                                                    What is the Alberni Valley?
By compiling local information and tracking it over time, we will deepen our                 For the purposes of this report, the Alberni Valley is defined as the City of Port
community knowledge and provide a valuable tool for our foundation, residents,               Alberni, Alberni Clayoquot Regional District electoral areas B (Beaufort), D
elected officials, and other community groups, giving us a basis from which to               (Sproat Lake), E (Beaver Creek), and F (Cherry Creek), and the Tsahaheh 1,
develop innovative ideas that build a stronger Alberni Valley.                               Ahahswinis 1, Alberni 1, and Klehkoot 2 reservations. All efforts have been made
                                                                                             to obtain data for this geographic area, but occasionally different geographic
How is the report organized?                                                                 areas are measured. This will be noted.

The Vital Signs® report examines quality of life through a number of different               Community Foundations of Canada
lenses, or issue areas. In addition to the twelve issue areas we reported on in 2015,
we have added two more: Food and Recreation. We are committed to monitoring                  The Community Foundations of Canada (CFC) oversees the development of
and reporting on issues that impact life for all in our community. In each issue             all 191 community foundations across Canada. CFC also coordinates the Vital
area, several indicators are presented. Indicators act as measurement tools,                 Signs® program, and provides some of the data included in this report.
demonstrating how the Alberni Valley has changed over time. Where possible, we
have offered comparisons to historical data, other communities, and provincial
and/or national statistics.

Data and Indicators                           Indicator Selection
                                                                                                                                          Community Survey
Data                                          Indicators were selected and prioritized based on the following guidelines:
                                                                                                                                          Throughout May, we ran a survey to
Some of the data within this report was       Indicator Characteristics                      Data Selection                               better understand how local residents
collected by CFCs data partner, the                                                                                                       feel about the pressing issues in our
                                              • Perceived public interest                    • Understandable                             community. In total, 498 community
International Institute for Sustainable
                                                (informed by community survey and            • Measureable                                members participated in the survey.
Development (IISD). Where possible,             consultations)
it has been verified by local experts in                                                     • Ease of collection                         The demographics of survey
each issue area. Additional information       • Indicator’s ability to inspire action                                                     respondents were closely aligned to the
                                                                                             • Currency                                   demographics of the Alberni Valley. The
was provided by local agencies and            • Indicator reports on an issue or trend
organizations. All data sources are             that community members can do                • Frequency of collection in future          survey is statistically valid, but survey
                                                something about                                                                           responses are presented under the
listed on page 22.
                                                                                                                                          heading “Community Voices” and not
                                              • Indicator reveals a strength or
Note: Due to data limitations, some                                                                                                       with the indicator data.
                                                weakness of the Alberni Valley
indicators included in the 2015 report have
not been updated in the 2018 report.

                                                                                         3
The AVCF and the Sustainable Report
Development Goals            Highlights
Like many community foundations, the Alberni Valley Community Foundation
                                                                                                                     Our Valley - Page 5
supports the seventeen Sustainable Development Goals set by the United
Nations. The Sustainable Development Goals, or Global Goals, were created                                            While our total population is relatively
and ratified by all United Nations member countries in 2015, with the intention
of putting the world on a more resilient and sustainable path by 2030. More
                                                                                                                     unchanged, demographic shifts have
information about the goals is available at sustainabledevelopment.un.org.                                           taken place since 2015. Our Aboriginal
                                                                                                                     population is young and growing, while
The grants that we give in the Alberni Valley support the achievement of the
                                                                                                                     our population as a whole is growing
Sustainable Development Goals. Three recent projects are highlighted below.
                                                                                                                     older. Our median age has risen by 5
                                                                                                                     years over the last decade.

                                                  In 2018, our grant contributed to the purchase of a pump for       Housing - Pages 14 & 15
                                                  the Hupacasath First Nation community farm. The community
                                                  farm not only grows produce, but supports the development          Housing has emerged as a critical
                                                  of life and employment skills. SDG 2, Zero Hunger, and SDG         issue, with house prices rising quickly
                                                  8, Decent Work, are both impacted by this project.                 and half of renters paying so much
                                                                                                                     for housing that they are at risk of
                                                                                                                     homelessness.

                                                  In 2017, we supported the Alberni Valley Community                 Income Gap - Page 16
                                                  Stakeholders Initiative to End Homelessness in implementing
                                                  their strategic plan, “Still At Home in the Alberni Valley.” The
                                                                                                                     Poverty remains an issue, as the
                                                  plan is in favour of appropriate and affordable housing for all.   Alberni Valley experiences a higher
                                                  This work is linked to SDGs 10 and 11, Reduced Inequalities        rate of poverty than the provincial
                                                  and Sustainable Cities and Communities.                            average. Child poverty is an especially
                                                                                                                     prominent concern.
                                                                                                                     Belonging & Leadership - Page 7
                                                                                                                     Our community demonstrates its heart
                                                  In 2016, a grant to the Bread of Life helped the
                                                  organization to renovate the kitchen. The work of the Bread
                                                                                                                     through civic engagement – voting,
                                                  of Life contributes to SDG 2, Zero Hunger.                         donating, volunteering, and supporting
                                                                                                                     the many non-profits that make the
                                                                                                                     Alberni Valley such a caring community.

                                                                                        4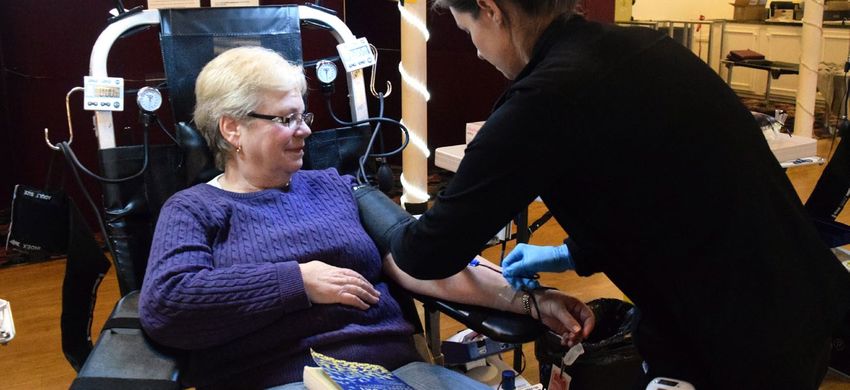
Our Valley
6.2%
5.6% 25,112 Population
4.7%
The population of the Alberni Valley was nearly
Nanaimo District
British Columbia
Alberni Valley
unchanged between 2011 and 2016. Census data
Comox Valley
shows a population of 25,112 people. Neighbouring
regional districts including Nanaimo Regional
District and the Comox Valley Regional District
grew by 6.2% and 4.7%, respectively, while the
Growth 2011–2016 provincial population increased by 5.6%.1,2
Employment – top industries1 Alberni Valley
50 British Columbia
49.6 Median age Sales and service
23.6%
The median age in the Alberni Valley continues to rise, 24.5%
up from 45 in 2006, to 47.3 in 2011, and to 49.6 in 2016. 45 Trades, transport, and equipment operators
Our community is older than the provincial median (43.0) 20.3%
and the national median (41.2).1,2 14.9%
2006 2011 2016
Occupations in education, law and social, community and government services
11.9%
11.1%
16.8% 16.8% Aboriginal identity Business, finance, and administration occupations
10.8%
More than 4000 Alberni Valley residents, or 16.8% of 15.3%
Alberni Valley the total population, identify as Aboriginal (First Nations,
Management occupations
Metis, or Inuit). This is an increase of 3.5 percentage
8.4%
points since 2011, indicating that the Aboriginal 11.3%
BC 5.9% population is young and growing. In British Columbia, Health occupations
5.9% of the population identifies as Aboriginal.1,2 8%
6.7%
Natural resources and agriculture
6%
$49,609 Median income of household, after tax 2.6%
Manufacturing and utilities
In 2016, Alberni Valley households reported
5.7%
a median income of $49,609, after taxes were 3.2%
deducted. This is an increase over 2011 Natural and applied sciences
($43,619). In both instances, the Alberni Valley
Canada
2.8%
lags behind the province – in 2016, the provincial 6.7%
BC
median was $61,280. Nationally, households Occupations in art, culture, recreation, and sport
reported an after-tax income of $61,348.1,2 2011 2016 2.5%
3.8%
5
Arts & Culture
9%
      4.7%

                          Arts & Culture
     Arts & Culture
                1.4%
20    21-30      31+

9%
      4.7%
              1.31.4%
                   %

        Arts & Culture
20    21-30      31+
                        Education in the arts      65.1+17.7+17.2
         Just over one in one hundred adults ages 25-64 in the Alberni
         Valley have post-secondary training in the arts (visual or
           1.3%% Across the1province, 2.1%65.1+17.7+17.2
         performing).                            of people ages 25-64

     Arts & Culture
           2.5
         have an arts education.                65.1+17.7+17.2
                           65.5%

                                 65.5%

              2.5%                                65.1+17.7+17.2
                      Employment
                    15.5%              in cultural occupations
                                    12.9%
                                              4.7%      1.4%
         The proportion15.5%
                         of residents working
                                          12.9% in arts, culture, recreation,
                      0 not 1-10
         and sports has       changed11-20    21-304.7%
                                        since65.5%
                                              2015.      31+
                                                      This is1.4%
                                                              lower than the
         provincial rate of 3.8% and the national rate of 3.1%.1

                                                                                                Community    Voices
                                                                               Arts & Culture
                           0      1-10    11-20    21-30     31+
     1.3+98.7                                                                                                       3
                                                    1.3%              1-10
                                65.5%15.5%             12.9% %                                65.1+17.7+17.2
                                                         1.3 0 4.7%
         7,506 Registered library
                             0
                                  borrowers
                                   1-10 11-20                       21-30
                                                                              1.4%
                                                                             31+
                                                                                                    65.1+17.7+17.2                  I can afford to participate in
     1.3+98.7                                      15.5%
         A total of 7,506 people, or 29.9% of the population
                                                                                                                                    local arts and culture events.
                                                    2.5%65.5%         1-10 11-20             65.1+17.7+17.2
         in the Alberni 15.5%
                         Valley, have a library
                                          12.9% card. In 2017,                                                                  65.1% Strongly agree and agree
         102,108 visits to the Port Alberni branch   were 1.4%
                                                  4.7%
                                                         2.5  %0
                                                                 12.9% % 21-40
                                                                     1.3                          65.1+17.7+17.2                17.7% Neutral
         recorded, or an average of 4 visits per resident.4           4.7%      31 +                                 65.1+17.7+17.2
                                                                                                                                17.2% Disagree and strongly disagree
                          0       1-10    11-20   21-30     31+            1.4%
                                                      15.5%
                                                                             11-20
                                                    65.5%
                                                         12.9%      21-40
                                                 1.3%                                                65.5%
                                                                                                                65.1+17.7+17.2
                                                             2.5 %
                                                              4.7%                                65.1+17.7+17.2How   many local arts and
         $30,000           Canada Council for the Arts grants      1.4%
                                                                                     31 +
                                                                                                                culture events have you
                                                                                                                  attended in the last 12 months?
         National arts and council grants are awarded each year to
         support local arts initiatives. In 2017, Alberni Valley artists were
                                              1.3+98.7                                      15.5%
         awarded two grants. Prior to this, no Canada  2.5Council
                                                             %     for the Arts
                                                                                                 65.1+17.7+17.212.9%        4.7%        1.4%
                                                                                                                 1-10
         grants have been awarded in Alberni since1.3+98.7
                                                        2012.  5
                                                                                             0        1-10       11-20          21-30   31+
                                                                                                             0           1-10

                                                                                     6           15.5%           0
                                                                                                                         11-20           %
Belonging                                Wor
                                                                                                                                                                   35

  Belonging                                 W
                                                                  71.7%              16.6%
                                                                                      2.5%                                                                   20

     Belonging & Leadership
                                                                                  16.1+18.4+65.5                                                              Single fa
      71.7%                 16.6%                                 65.1%         76.6  %

onging                                 Work &
                             2.5%
                  Sense of community belonging                                                Voter turnout – federal

Belonging                                Wor
      Nearly three-quarters of Central Vancouver Island residents, which        At 76.6% voter turnout in the 2015 federal election, the
      includes the Alberni
                       71.7Valley,
                               % reported a strong or
                                             16.6   % somewhat strong           Courtenay-Alberni riding had one of the highest rates in the
                                              2.5  %
      sense of community belonging in 2015-2016, a decrease of slightly         province. Nationally, 68.5% of eligible voters turned up at the
      more
       65.1than
             % seven percentage
                        76.6% points since 2013-2014. Provincially,             polls. In 2011, 61.1% of eligible voters cast their ballot.10
      71.6% of residents feel they belong, compared to 68.4% nationally.6

       16.6  %         Power of people
                       65.1%            76.6%
                  Percentage of tax filers making
        2.5%
                  charitable donations                                           100+ Women Who Care Alberni
      71.7
     Tax
            %
                           16.6
         filer data from 2016
                                   %
                              indicates
                            2.5  %      that 16.6% of Alberni Valley             The Alberni Valley has a long reputation as the “community with a heart,”
     residents made a charitable donation. This compares to 19.5%                and the local chapter of the 100 Women Who Care initiative cements that
                                                                                 status. Communities across North America have created 100 Women Who
     of British Columbia residents and 20.5% of all Canadians. In the
                                                                                 Care groups, asking 100 women to gather quarterly to award $100 each — or
     Alberni
   76.6  % Valley, the median amount donated was $270.8
                                                                                 $10,000 total – to a worthy local non-profit. This allows for charitably-minded
                                                                                 women to gather, quickly learn about local charities in the Alberni Valley, and
      65.1%             76.6%                                                    make a big impact with their combined donation. But they haven’t stopped
                                                                                 at 100 – at last count, the 100+ Women That Care Alberni was just over 200
                  Voter turnout – provincial                                     members. For more information, visit www.100womenalberni.com.
      The 2017 provincial election saw increased voter turnout over
      the 2013 election. Provincially, 61% of registered voters took
      to the polls in 2017, compared to 57% in 2013. The Mid-Island
      Pacific Rim riding, of which the Alberni Valley is a part, had a
      higher than average turnout of 65.1%.9

      80 Number of registered non-profits
      There are 80 registered non-profits in the Alberni Valley, or
      roughly one charitable organization per 314 residents. In 2015,
      there were 79 registered non-profits.7

                                                                            7
32%
                                                                                        %

      Children & Youth
                  Children & Youth
                                                            32%                    29.5                81.3%                   69%           62%

Children & Youth
                                                                                                Child poverty rate
                                                                                  In the Alberni Clayoquot Regional District, which includes the                       50
                                                                                  Alberni Valley, 29.5% of children and youth ages 0-17 years old
  5,095 Number of children and youth                                              live in a low-income family. Within city limits, 33.7% of children
                                                                                  and youth live in a low-income family. This is the highest
  There are more than 5000 children and youth 19 years     and
                                                        81.3+18.7                 municipal child poverty rate in the province. In British Columbia,
  younger in the Alberni Valley. Children and youth comprise                      one in five, or 20% of children and youth live in poverty.11
  20.3% of the population. Provincially, 20.4% of residents                                                                                         35
                                                                                                                                                                  37
  are under 19 years of age. Across Canada, 22.4% of the
  population is under 19 years old.1                                                                                                                 20
                                                                   32%
                                                                     %
                                         32%                   29.5                            69%
                                                                                  81.3% Youth self-rated62%
                              32  %
    32%                   29.5%            81.3%                69%             62%     mental health

 Youth
               Vulnerability rate                                                  When asked to rate their mental                                    Single family
                                                                               16.1+18.4+65.5
                                                                                   health, 81.3% of youth in Central
  The latest Early Development Instrument (EDI) data intimates
                                                                                  Vancouver Island, which
  that the vulnerability rate has increased, from 30% in 2011-2013
                                                                                  includes the Alberni Valley,
  to 32% in 2013-2016. An examination      of a child’s first five years
                                        81.3+18.7                                 chose “very good” or “excellent,”
  across five domains (physical health and well-being, social
    81.3+18.7 emotional maturity, language and cognition, and                     a slight increase over the
  competence,
                                                                                  provincial average of 79.1% and
  communication) demonstrates that, without additional support,
                                                                                  the national average of 77.6%.6
  32% of our youngest children may experience further challenges
  in both education and society.12

    69%         62%                                                                 Power of Philanthropy
                            Adults in the community                               STARS Program
                                                                                  “Skills That Achieve Readiness for School,” or STARS, is a program
  The Middle Years Development Instrument asks students in
                                                                                  developed by Outreach Therapy. Outreach Therapy has long provided
  Grade 4 and Grade 7 to reflect on their experiences at school,                  group intervention services to young children, but needed a way to reach
  at home, and in the community. One of the questions queries                     more children to share foundational fine and gross motor, cognitive, sensory,
  connectedness, and asks Grade 4 and 7 students to assess                        social and emotional skills to support school readiness. Thus, STARS was
  the quality of the relationships they have with adults in their                 born! The STARS curriculum is now offered in preschools and childcare
  neighbourhood or community. On this scale, 69% of Grade                         centres throughout the Valley and on the west coast. Through play, children’s
  4 students are thriving, or experiencing high well-being, and                   coordination is developed, alongside their social skills and self-confidence.
                                                                                  This program is made possible thanks to a number of funders, and the Alberni
  62% of Grade 7 students are as well. Both responses exceed
                                                                                  Valley Community Foundation is proud to support it.
  the provincial average.13

                                                                           8
Power of people
               Environment                                                Cycling to School
                                                                          Many local organizations came together
9.9ug/m        3
                   Air quality                                            to secure funding to purchase a fleet
                                                                          of bikes that are used to teach Wood
One measure for air quality is concentration of fine particulate          Elementary School students cycling skills
                                                                          that may support them in cycling for health
matter (PM 2.5). Fine particulate matter is a public health risk,         and leisure and, as they get older, to
causing lung and heart problems. Canada’s Ambient Air Quality             support bicycle commuting. 125 students
annual standard for PM2.5 is 10.0ug/m3, or 10.0 micrograms per

                                                                 Environment
                                                                          participated in the Bike to School program,
cubic metre. In 2017, the Alberni Valley’s annual average was             cycling 1-2 times per week for 6 weeks. In
9.9ug/m3, as measured at the Alberni Elementary weather station.14        total, 200 students participated in some sort
                                                                          of cycling program. Teachers reported that
                                                                          students who participated in the cycling
                                                                          program had increased attention in class,
530L Daily water consumption per capita                                   and demonstrated strong communication
                                                                          and collaboration skills. Cycling also
Metered water usage in the Alberni Valley is provided by the              supports mental and physical health.
City of Port Alberni, Beaver Creek Water System, and the Cherry

                                  Environment
Creek Waterworks District. Daily average water consumption per
capita was 530 litres in 2017, an increase over 2014’s daily per
capita average of 449.7 litres.15,16,17                                         Community Voices3
                                                                                                        The Alberni Valley has adequate options
75.7kg Household recycling                                                                              for getting around, including public
                                                                                                        transportation and active transportation.
The Alberni-Clayoquot Regional District collects household
recycling from residents living in the City of Port Alberni, Beaver                                     34.8% Strongly agree and agree
Creek, Tseshaht, and Hupacasath. In 2014, each household in                                             35.6% Neutral
these communities averaged 81kg of recycling per year. In 2017,                                         29.6% Disagree and strongly disagree
the household average decreased to 75.7kg per household.16

                                                                                                        Our natural resources (air, water
2,069mm Average annual precipitation                                                                    sources, forests) are well managed.
In 2016, the most recent year with comprehensive weather                                                26.7% Strongly agree and agree
reports, 2,069mm of precipitation fell in the Alberni Valley. This                                      26.7% Neutral
was an increase over 2014 (1,781mm), and higher than the 10
year average of 1,796.3mm.14
                                                                             34.8+35.6+29.6             46.6% Disagree and strongly disagree

                                                                      9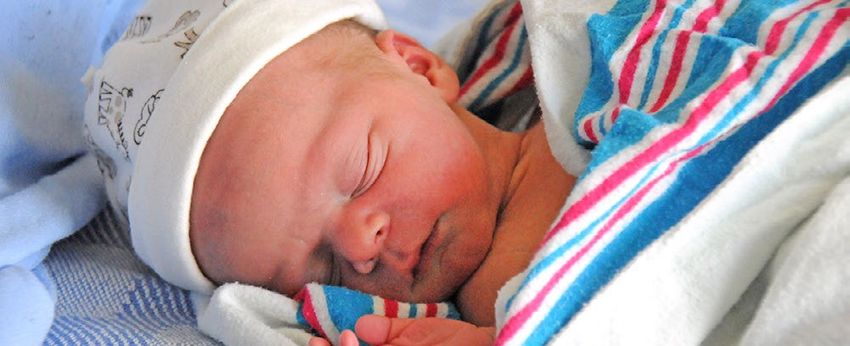
Food                                                                         36 Number of1.7farms producing
                                                                                                                              50.4%
                                                                                                                                       and selling food

d                                                                                                                                                                    Senio
                                                                                                                         %
                                                                                                   There are 36 food producing farms in the Alberni Valley producing
                                                                                             50.4+91fruits and vegetables, meat, eggs, grains, and more. Of these,2030
       $1029 Cost of healthy eating                                                                sell their goods on-site, by appointment, and/or with set hours.
       The Provincial Health Services Authority monitors the monthly
       cost of healthy eating for a family of four in BC. Their most recent                        Free and subsidized meals consumed, 201721
       report shows that a family living in Central Vancouver Island
       pays $1029 to eat healthy meals each month. This is an increase37                            ADSS Breakfast Club [2017-2018 school year]*                         72,000
       over 2015, when Central Vancouver Island families paid $983  35
                                                                                                    Alberni Valley Community School Lunch Program**                      42,625
       each month. Similarly, the provincial cost of healthy eating has                             Alberni25
                                                                                                           Valley Neighbourlink Society Read & Feed                      25,862
       risen from $974 in 2015 to $1019 in 2017.18            20
                                                                                                    Bread of Life                                                        33,000
                                                                                                    Canadian Mental Health Association,
                                                                                                                                 7      Port Alberni branch 16,000
                                                                                                    2                 2          4                3
                                                                                                    EJ Dunn Backpack Program [2017-2018 school year]***                  1,368
          77%            74%                                                                        Grace Point Church Downtown Hope                                     4,160
16.1+18.4+65.5                                                            Single family               Multi-family       Renovations and
                                      Meals with adults at home                                     Island Health Lunch Club Program
                                                                                                                              additions                                  1,800
                                                                                                    Jericho Road Mobile Outreach                                         1,600
       77% of Grade 4 students and 74% of Grade 7 students in the
                                                                                                    KUU-US Crisis Line Society****                                       4,076
       Alberni Valley eat meals with their parents or adult family members
                                                                                                    Port Alberni Friendship Centre                                       23,250
       5 or more times per week. 15% of Grade 4 students and 14% of
       Grade 7 students eat 2 or fewer meals with parents or adult family                           Port Alberni Shelter Society                                         30,631
       members each week.19                                                                         Salvation Army*****                                                  11,896
                                                                                                    Vincent de Paul***                                                   639

                                                                                                    TOTAL                                                                268,907
6           Power of Philanthropy                                                                  *With breakfast served for an hour before          ****Includes 1,074 meals and 3,002 food
                                                                                                   classes start and bagels, fruit and granola        hampers provided during weekend outreach.
                                                                                                   bars available at “grab ‘n go” stations
       An innovative grant from Community Foundations of Canada and administered                                                                      ***** Includes 574 Christmas food hampers and
                                                                                                   throughout the school, ADSS students
       by the Alberni Valley Community Foundation is bringing greater coordination to                                                                 40 recipients of the baby formula program.
                                                                                                   accessed food approximately 72,000 times in
       the delivery of non-profit food services in the Alberni Valley. Through the Alberni
                                                                                                   the 2017 – 2018 school year.
       Valley Transition Town Food Group, stakeholders will be brought together to                                                                    Note: Canadian Mental Health Association
       develop a more cohesive method of food provision and distribution. Given the                ** There is a cost per meal and families are       also provides small food hampers to people in
       number of charitable organizations providing groceries or meals to those in                 encouraged to pay what they feel they can          need, but a database error made 2017 statistics
       need, identifying and creating efficiencies is essential. By supporting greater             afford.                                            unavailable.
       alignment in service delivery, we hope that our caring non-profits will have more
       time and energy to focus on the many other needs that they serve.                           *** This is the number of food hampers/            Our apologies if we have missed any of the free
                                                                                                   grocery bags provided, not the total number        or subsidized food programs in the Valley. Every
                                                                                                   of people fed by this program.                     effort was made to be thorough.

                                                                                              10
Getting started
Getting Started in Our Community
9.0
345 Net migration Getting started
Between 2015 and 2016, 345 more people moved to the
Alberni Valley than left the Valley. These newcomers comprise
50.4+91
1.4% of the total population. When we last looked at this
indicator, net migration was negative.1
37
35
25
20
ted
38 Languages spoken New residents1
New residents, 2015
In addition to English and French, Alberni Valley residents speak 2
36 languages at home. The most frequently spoken non-official 70% From within the province
languages are Punjabi, German, Dutch, Italian, and Spanish. 16.1+18.4+65.5
1
25% From another Canadian Single family
province Multi-fam
4% From outside of Canada
4.8%
Visible minority New residents, 2010 – 2014
The proportion of residents that belong to a visible minority has 78% From within the province
increased from 3.5% in 2015 to 4.8% today. The largest visible 17.6% From another Canadian province
minority groups in the Alberni Valley are South Asian and 4.4% From outside of Canada
Chinese. Provincially, 30.3% of residents belong to a visible
Power of people
minority, up from 27.3% in 2014.1
Note: Visible minority data does not include Aboriginal people.
34.8+35.6+29.6
47+37.5+15.5
The Alberni Valley has welcomed many newcomers in the last few years – mostly
Community Voices3 from within the province, but from across the country and internationally as well. A
net increase in migration coupled with a significant increase in the visible minority
population makes us ask: How can we welcome new residents to our community?
34.8+35.6+29.6
If someone new moves onto my street, they • Deepen personal connections by getting to know newcomer neighbours
are welcomed into the neighbourhood. • Share helpful hints with new residents on your street, such as information about
47% Strongly agree and agree 47+37.5+15.5 4.8+95.2
local services like the post office, recreation facilities, hospital, and library
37.5% Neutral • Ensure that new residents to the community know about local celebrations
15.5% Disagree and strongly disagree and events
11
4.8+95.2Health & Wellness
79.02 Life expectancy 26 Number of general practitioners
Life expectancy, or the number of years a person can expect to There are 26 general practitioners serving the Alberni Valley,
live, is a key measure of wellness. Someone born in Local Health working from one of the medical, community, or walk-in clinics.
Area 70 (Alberni) in 2016 can reasonably expect to live to 79.02 This is a net positive increase of 4 physicians since 2014.
years old. This is lower than the provincial life expectancy of 82.6 Additionally, there are 10 specialist practitioners serving the
years, but an increase over 2014’s life expectancy of 78.67.24 area. Across Central Vancouver Island, which includes the
Alberni Valley, 10.9% of the population was without a medical
doctor in 2016, an increase over 2014’s 5.9%.26,6
Note: Central Vancouver Island includes Nanaimo, Oceanside, the Alberni Valley,
10.1
18.2%
Birth rate %
14.8 18%
and the West Coast.
This is slightly higher than both the Island Health birth rate (8.4
per 100,000) and the provincial birth rate (9.6 per 100,000).25
10 of 11 Chronic disease prevalence rate, higher
than provincial average
65.4%
Breastfeeding rate Rates of chronic prevalent disease in Local Health Area 70
(Alberni) are higher than the provincial average in 10 categories:
At West Coast General Hospital, 65.4% of the 247 babies born heart failure, chronic kidney disease, Alzheimer’s disease and
in 2015/2016 were fed breast milk exclusively while in hospital. other dementia, diabetes, Chronic Obstructive Pulmonary
This is a decrease from 2013/2014, when 73.2% of babies born Disease (COPD), osteoarthritis, asthma, hypertension,
at WCGH were breastfed.22 depression, and mood and anxiety disorders. The only disease
that appears less frequently in Alberni than in the province is
ischemic heart disease.25
300.7 Mood and anxiety disorders
In Local Health Area 70 (Alberni), 300.7 per 1,000 residents have
a diagnosed mood or anxiety disorder. This is lower than the
Island Health rate of 302.4 per 1,000 residents, and higher than
the provincial rate of 267.0 per 1,000 residents.25
12Welness
Average annual
14.4L alcohol sales
Residents of Local Health Area 70
(Alberni) ages 19 years and older
consume 14.4 litres of alcohol, or 835
standard drinks, per year. This is higher
than both the Island Health consumption
(10.9 litres, or 632 standard drinks) and
provincial consumption (9.0 litres, or 522
standard drinks).23
18.2% 14.8% 18%
Perceived life stress
ath &Helath
Welness
& Welness
In 2016, 18.2% of Central Vancouver 18.2% 14.8% 18%
Island residents, which includes the Smoking rate 18 Overdose deaths
Alberni %
65.4 Valley, reported perceiving
The smoking rate for the population 12 In 2016 and 2017, there were 18
that most days in their life were quite
years and older in Central Vancouver overdose deaths in the Alberni Valley.
a bit or extremely stressful. This is
Island has decreased every year since In 2017, British Columbia saw 1,450
a decrease from 2014, when 22.6%65.4%
2007-2008. The most recent rate, from overdose deaths. Illicit fentanyl was
reported the same. Provincially, 19.7%
2015-2016, is 14.8%. Provincially, the detected (alone or in combination with
of British Columbians report quite a bit
rate is 14.1% and nationally it is 17.4%.6 other drugs) in 84% of overdose deaths
or extremely stressful days.6
in the province.27, 28
+35.6+29.6
Community Voices3
In the Alberni Valley, there are adequate I have the financial resources necessary
supports in place for promoting wellness. to meet my current health care needs.
38.9% Strongly agree and agree 70.0% Strongly agree and agree
31.4% Neutral 11.3% Neutral
29.7% Disagree and strongly disagree 18.7% Disagree and strongly disagree
13Housing
using $294,900 Benchmark%home price %
9.0 26.7
The benchmark sale price of a single-family home in summer
2018 in the Alberni Valley was $294,900 – still the most
13.1%
affordable city on Vancouver Island, but $100,000 more than in
summer 2015. On Vancouver Island, the average single-family
home increased from $338,700 in summer 2015 to $507,700 in%
summer 2018.29 1.7% 50.4
9.0% 26.7% 13.1%
50.4+91 Renter households
Of the 11,360 households in the Alberni Valley, 3,030 or 26.7%
109 New housing units by dwelling type 15 are renter households. This is a negligible increase, from
26.6% in 2011. The remainder are owned. Provincially, 31.8% of
1.7 %
households 50.4 %
are renter households.1
ng
2015
37 2016
35 50.4+91
2017
20
25
$701, $749 Median monthly shelter costs
7 Median monthly shelter costs include mortgage or rent
2 2 4 3 payments, electricity, heat, water, and other municipal services.
37 In the Alberni Valley, homeowners pay a median monthly shelter
Single family Multi-family 35
Renovations and cost of $701, while renters pay $749.1
additions 25
20
% 7 Proportion of homeowners spending more
9.0% 26.7% 13.1% 9.0% 26.7% 2 13.1
4 3
Proportion of units requiring major repair
2
than 30% of their income on housing
5 Single family Multi-family Renovations
Households thatand
spend more than 30% of their income on
Between 2011 and 2016, the proportion of Alberni Valley
additions
housing are at risk of homelessness. In the Alberni Valley,
housing units requiring major repair decreased from 11.9% to
9.0%. Across the province, there has%also been a decrease, from % 13.1%
50.4 of%homeowners spend more than 30% of their income on
1.7%in 2016.50.4
7.2% in 2011 to 6.3% 1
1.7 housing, compared to 20.7% of homeowners in BC and 16.6%
across Canada.1
50.4+91 50.4+91
147% 50.4% Proportion of renters spending more Housing
than 30% of their income on housing
Community Voices 3
There is affordable housing for all
Households that spend more than 30% of their income on
income levels in the Alberni Valley.
Housing
housing are at risk of homelessness. Half of the rental
households in the Alberni Valley spend more than 30% of their 16.1% Strongly agree and agree
income on housing, compared to 43.4% of homeowners in BC 18.4% Neutral
and 40.0% across Canada.1 65.5% Disagree and strongly disagree 9.0%
12 Number of beds in emergency shelter The Alberni Valley has a variety of hous- 35
7 The Port Alberni Shelter Society operates the emergency shelter ing options to meet community needs.
3 3
in the Alberni Valley. It has 12 beds year-round, and may offer 15 20
21.4% Strongly agree and agree
additional beds during periods of extreme weather (November
novations and
1 – March 31 of each year).32
15.7% Neutral 50.4+91 20
additions 9.0
62.9% Disagree and strongly 26.7
%
disagree
%
13.1%
16.1+18.4+65.5 Single fa
147 Homeless count 16.1+18.4+65.5 Homelessness is taken seriously in Single
the Alberni Valley. 35 37 % 50.4%
The Alberni Valley’s homeless population was counted in April 1.7
2018. Preliminary results demonstrate that there are at least 147 21.1% Strongly agree and agree 25
% homeless
26.7% people in the
13.1 % valley. Because the 2018 methodology 23.7%50.4+91
Neutral 20
differed from the methodology used in the November 2016 55.2% Disagree and strongly disagree
homeless count, the results are not directly comparable.31
2
1.7% 50.4
Rental
%
16.1+18.4+65.5 Power of Policy
35
37
Single family Multi-family
vacancy rate The Alberni Valley will be the recipient of one
25 of many housing
20
investments currently being made across the province, as 30
The rental vacancy rate in the
units of supported housing and 5 shelter units (that can house up
Alberni Valley has decreased 7
to 4 individuals each) are constructed on 8th Avenue, near 4 the
every year since 2011. It 2 2 3
existing Port Alberni Shelter Society site. Supported housing units
is currently 1.7%. British offer 24/7 supports to residents, including life and employment
Columbia’s rental vacancy 16.1+18.4+65.5
rate is Single family Multi-family
skills training and health and wellness services.
Renovations and
1.3%, while Canada’s is 3.0%.30 additions
1535.5% Canada Pension Plan and/or
Quebec Pension Plan
transfers
Governm
26.5% Old Age Security pension and
10.0% Guaranteed
Employment Insurance Income Supplement
(EI) benefits
Income Gap
Government
21.1% 35.5%
Child Benefits Canada Pension Plan and/or
Quebec Pension Plan
$37,632 Median income of lone
transfers
10.0% Employment Insurance (EI) benefits
parent families, after tax
or Getting star
20.3% 21.1% Child Benefits
Overall poverty rate The median income of Alberni Valley lone
parent families has increased since 2014, when
Using the low-income measure, after-tax, 20.3% of Alberni Valley residents live
it was $30,400. The province’s median income
in poverty. This is an increase
20.3 % of two percentage points since 2013. In British
of lone parent families (after tax) is $46,668 and
Columbia, the overall poverty rate is 15.5%, and in Canada, 14.2%. The national
the country’s is $48,856.1
and provincial poverty rates have not changed significantly since 2013.1
6 Alberni Valley 2011
2016 British Columbia 2011 Alberni Valley 2016
British Columbia 2016
Income Sources for Population Aged 15 After-tax income of households, by decile1
Years
Alberni and
Valley Older1
2016
British Columbia 2016
Alberni Valley 2011
British Columbia 2011 Alberni Valley 2016
$17.56 Living wage
65.7% Employment income
30% British Columbia 2016 The living wage in the Alberni
income
Market
28.5% Investment income
Valley has increased from
24.0% Private retirement income $17.22 per hour in 2014 to
Rich
Rich and and poor
poor
20% $17.56 per hour in 2018. The
13.5%
10.8%
22.0%
16.4%
18.5%
15.7%
14.4%
13.6%
10.6%
11.2%
10.5%
12.0%
21.8%
9.0%
26.5% Old Age Security pension and living wage is the amount of
Guaranteed Income Supplement
money a family of two parents
Government
10% and two children needs to earn
+
Canada Pension Plan and/or
99
99
99
99
99
5k
35.5%
k
+
99
99
5k
12
99
,9
,9
,9
,9
,9
25
Quebec Pension Plan
99 13.5%
10.8%
99 022.0%
16.4%
99 18.5%
15.7%
99 14.4%
13.6%
9 10.6%
11.2%
10.5%
12.0%
21.8%
99transfers
to provide for a bare bones
k
19
39
59
79
99
12
,9
-$
5k 9.0%
,9
25
$1
79
99
-$
-$
-$
-$
-$
-$
$1
k
quality of life. For comparison,
-$
00
-$
10.0% Employment Insurance (EI) benefits
$0
k
0k
k
k
k
0
60
0
,9 $1
k
$2
$4
,9 $8
0k
10
the 2018 living wage in the
60
$
$8
$
+
21.1% Child Benefits
9
k
Comox Valley is $16.59 and the
+
99
99
9
5k
12
99
,9
,9
,9
9
25
99
k
19
39
59
79
99
12
9
,9
-$
,9
25
$1
,
,
,
Cowichan Valley is $19.05.33,34
79
9
59
99
-$
-$
-$
-$
-$
39
-$
$1
$1
k
-$
-$
00
-$
-$
$0
0k
0k
0k
0k
k
Community Voices3
00
$1
0k
0k
$2
$4
$6
$8
0k
0k
$1
$6
$4
$8
$2
65.7% Employment income 65.7% Employment income
income
income
Market
Market
The gap between the rich and poor 28.5% Investment income As a community, 28.5% we are generating local
Investment income
solutions to ensure that residents have
is closing in the Alberni Valley 24.0% Private retirement income 24.0% Private retirement income
suitable work.
5.7% Strongly agree and agree 26.5% Old Age Security pension and 26.5% Old Age Security pension and
11 8.7% Strongly agree and agree
Guaranteed Income Supplement Guaranteed Income Suppleme
2011
21.4% Neutral
Alberni Valley 2016 25.3% Neutral
Government
Government
72.9% Disagree and strongly disagree Canada Pension Plan and/or
British Columbia 2016
35.5%
Quebec Pension Plan
66.0% Disagree and35.5%
Canada Pension Plan and/or
strongly disagree
Quebec Pension Plan
transfers
transfers
10.0% Employment Insurance (EI) benefits 10.0% Employment Insurance (EI) be
16
21.1% Child Benefits 21.1% Child BenefitsLearning 74.0% 56.0% 13.2% 44.7%
Education in the trades
60.9%
In the Alberni Valley, 13.2% of the population ages 15 and over
74.0% 70.1+19.3+10.6
56.0% 13.2 %
44.7 % 60.9% has an education in the trades. This is significantly higher than
High school completion rate the province, at 8.8%, and the country, at 9.8%.1
60.9+39.1
Data from the British Columbia Ministry of Education
demonstrates that the six-year high school completion rate has
remained nearly unchanged, from % 74.3% in 2013-2014 to 74.0%%
60.9+39.1 74.0 56.0 %
in 2016-2017. This compares to 84.0% provincially. 35 13.2 60.9%of population
44.7% Percentage
with post-secondary
0% 56.0% 13.2% 44.7 % 60.9% In the Alberni Valley, 44.7% of the population 15 years and
70.1+19.3+10.6 Aboriginal high school completion rate older has post-secondary education. This is an increase
from 2015’s rate of 43.9%. This indicator has been increasing
60.9+39.1
The six-year high school completion rate for Aboriginal students
every year since 2001. Provincially, 55.0% of the population
has increased, from 41.7% in 2013-2014 to 56.0% in 2016-2017.
15 years and older has post-secondary.1
This compares to 66.0% provincially.35
% 60.9%
Transition to post-secondary Average annual cost of
$4261
LearningLearning
The post-secondary transition rate provides the proportion undergraduate university tuition
of high school graduates that transition to a post-secondary
Vancouver Island University is the closest public university.
institute within three years of graduation. 60.9% of School District
Tuition has increased since our last report: it was $4095 in 2014-
#70 students who graduated in 2011/2012 transition to post-
2015, and was $4261 for the 2017-2018 academic year.36
secondary, compared to 59.9% provincially.35
Community Voices3
In the past year, I have increased my own There are adequate opportunities
well-being and life satisfaction by learning for learning in the Alberni Valley
70.1% Strongly agree and agree 45.6% Strongly agree and agree
19.3% Neutral 32.0% Neutral
10.6% Disagree and strongly disagree 22.4% Disagree and strongly disagree
17Recreation Community Voices3
We asked Alberni Valley residents how
85,341 they use their leisure time. In the last
12 months...
Admissions to recreation facilities
In 2017, 85,341 visits to recreation facilities
were recorded by the City of Port Alberni.
85.4%
Visited a park or recreation centre
That’s 3.4 visits per person in the Alberni
Valley. In 2014, City recreation facilities saw
67.8%
94,592 visits.37
Visited a farmer’s market
66.5%
Donated to a cause
140+ Trail, in km
60.5%
There are at least 140km of trail in the Provided unpaid help to a non-family member
Alberni Valley. Trails have been built on land
owned by the City of Port Alberni, the Alberni 55.8%
Clayoquot Regional District, and on private Volunteered time to an organization
and industrial land.38
53.7%
Visited the library
52 Sunshine Club activities offered 52.8%
Visited a heritage site
The Sunshine Club is a social club for people
50 years and greater. Members, who pay an 48.1%
annual due of $70, can participate in any of the Participated in a sports or hobby group
52 activities that are regularly scheduled.37
41.6%
Signed a petition
5 Number of registered non-profits dedicated to recreation 37.8%
There are 5 registered non-profits in the Alberni Valley that focus on recreation, including Attended a cultural or ethnic event put on by a
the Alberni Athletic Association, the Port Alberni Gymnasium Association, and the Port different cultural or ethnic group than their own
Alberni Youth Centre Society.7
18Safety Crime severity index,
6,009.8 Property crime rate,
Canada
Canada
Safety
per 100,000 population
per 2017
2017
- 6006.3
100,000- 6006.3
population
The crime severity rate reflects both 2012
2012 - 6458.8
- 6458.8
Overall crime rate, the number and relative seriousness of Property
2007 crime
2007 rates in the Alberni Valley
- 7707.2
- 7707.2
per 100,000 population39 crimes reported to the police.39 have2002
been
2002 increasing
- 8314.7 since 2014, when
- 8314.7
it was 4,844. In 2017, the Port Alberni
24k
24k 200
200 municipal
British
Britishproperty
Columbia
Columbiacrime rate was 6,009.8
per 100,000
2017
2017 -population,
- 8262.8
8262.8 while Port Alberni
18k
18k 150
150
rural2012
was
20122,030.5.
- 9061.8 Across
- 9061.8 BC, the rate has
Safety
stayed
2007 relatively
2007 - 11752.7stable since 2014, and in
- 11752.7
2017 the
2002
2002provincial
- 12640.4
- 12640.4rate was 4,814.5.39
12k
12k 100
100
6k6k 5050
Community VoicesPort
PortAlberni
Alberni
2017
2017
- municipal
- municipal
- 12772.9
- 12772.9
3
2012
2012- 14334.5
- 14334.5
The Alberni Valley is a safe community.
2007
2007- 20975.3
- 20975.3
2002
2002 2007
2007 2012
2012 2017
2017 2002
2002 2007
2007 2012
2012 2017
2017
2002
2002- 18774.3
- 18774.3
32.5% Strongly agree and agree
23.2% Neutral
Safety
Port
Port
Alberni
Alberni - rural
- ruralDisagree and
44.3%
British Columbia Canada Port Alberni - municipal Port Alberni - Rural 2017
2017- 5882.4
- 5882.4 strongly disagree
Port
PortAlberni - municipal
Alberni - municipal 2012
2012- 5492.6
- 5492.6
British Columbia
British Columbia 2007
2007- 7915.6
- 7915.6
Canada
Canada There are-adequate
2002
2002 - 8504.6 crime prevention
8504.6
measures in place here.
115.5 Sexual assault rate, per 100,000 population
Port
PortAlberni - Municipal
Alberni - Municipal
20.6% Strongly agree and agree
In 2017, the Alberni Valley’s sexual assault rate was 115.5, compared to 56.2 for British 23.7% Neutral
Columbia and 67.2 for Canada. Caution should be taken, though: the majority of sexual 24k 55.7% Disagree and 200
assaults are not reported, so obtaining an accurate number is difficult.39 strongly disagree
18k 150
The Alberni Valley is prepared for a
large-scale emergency, such as an
12 Number of beds in women’s and children’s transition house 12k
earthquake or a tsunami. 100
There are 12 beds for women and children in the transition house operated by the 46.9% Strongly agree and agree
Alberni Community and Women’s Service’s Society. In the 2017-2018 fiscal 24k
year, the 6k 26.3% Neutral 50
200
Transition House provided 1,737 nights of bed stays for women and children at risk of or 26.8% Disagree and
fleeing domestic violence.40 strongly disagree
18k 2002 2007 2012150 2017 20
19
12k 10024.1% 13.9% 27.4%
Seniors 2 Senior-specific physicians
There are 2 senior-specific physicians in the Alberni Valley:
a gerontologist and a geripsychiatrist. This has not changed
since 2015.41
13.9+86.1
24.1% 13.9% 27.4%
Senior population
Nearly one-quarter of the Alberni Valley’s
Lorem ipsum
population, or 24.1%, is comprised of
seniors ages 65 years and greater. This 197 Residential care beds 35
3.9+86.1 is20.1%
a significant increase from 2011, when
of the population was 65 years
There are 197 residential care beds in the Alberni Valley, an
increase of 5 beds since 2015. Residential care provides 20
and greater. Provincially, 18.3% of the 24-hour professional supervision and care.42
population is 65 years and greater.1
24.1% 13.9% 16.1+18.4+65.5
27.4 % Single fa
Percentage of senior population living alone
100% increase Senior population projection As in our 2015 report, 27.4% of the senior population lives
alone. Seniors who live alone often report higher rates of social
Over the next 20 years, the population 75 years old and greater isolation than seniors who live with someone else. Across BC,
is predicted to double, from 2,505 to more than 5,000.25 25.7% of seniors live alone.25
13.9+86.1
4.1% 13.9%
27.4%
Senior poverty rate
Power of People
Intergenerational programs are those that include children, youth,
Senior poverty rates are increasing across the province, and seniors. These programs allow kids and seniors to develop fun,
and the Alberni Valley is no exception. Currently, 13.9% of meaningful relationships. One such program is the Treasure Our
seniors have after-tax income below the low-income measure. Young Ones Childcare Centre (?iiḥmisuk t̓aatn̓a?is), run by the Port
Interestingly, 16.9% of senior women live in poverty in the Alberni Friendship Centre. The program integrates two Elders into
Alberni Valley, compared to 10.8% of senior men. Across the the childcare setting, and the Elders share their knowledge and
province, 14.9% of seniors live in poverty.1 teachings as well as the Nuu Chah Nulth language. The program is
Note: This is not directly comparable to the data in our 2015 report, which uses a beneficial for the children, who meet caring adults, and for the Elders,
different measure of poverty. We have opted to use the low-income measure, after-tax, who are able to share their life experiences and language. Win-win!
in all of our reporting about poverty
2032%
%
Work & Economy
48.2%
%
10.2%
%
Employment and
unemployment rates
There has been little change in employment or unemployment rates
since 2011. Data from the 2016 census notes that the employment
rate has risen from 46.0% to 48.2%, and unemployment has
decreased from 10.4% to 10.2%. Provincially, the employment rate
is 59.6% and the unemployment rate is 6.7%.1
474 Annual average EI benefits beneficiaries 1,400 Number of self-employed individuals
In the Alberni Valley, an average of 474 people received
There are 1,400 self-employed individuals in the Alberni Valley,
Employment Insurance (EI) benefits per month in 2017, a
comprising 12.4% of the labour force. Provincially 13.9% of the
slight decrease from 480 in 2015. This represents 4.2% of the
labour force is self-employed, and 11.8% of the national labour
Work
Work & &
Econom
Econ
labour force. In British Columbia, 2.1% of the labour force
force is self-employed.1
& Economy
also received EI benefits in 2017.43
Community Voices
$49,479 Median employment income
3
The median full-time, full-year employment income in the Alberni Ample entry-level job Ample professional job
Valley is $49,479, with men earning nearly $10,000 more, at opportunities exist in the opportunities exist in the
$58,340, and women earning $8000 less, at 41,310. In British Alberni Valley. Alberni Valley.
Columbia, the median employment income is $53,940, or $61,004
for men and $47,039 for women.1
9
93 58
58 78*
Number of new
business licenses44
17.6% Strongly agree and agree 12.0%
*2018 data is for January – June 27.8% Neutral 22.1%
due to publication deadlines. 2016 20
54.6% Disagree and strongly disagree 65.9%
2016 2017 2018 *2018 data is for Ja
publication
*2018 data is for January – June due to
publication deadlines.
21
17.6+27.8+54.617.6+27.8+54.6
17.6+27.8+54.6Sources
1. Statistics Canada, Census 2016 – Port Alberni [Census Agglomeration], British Columbia, 24. BC Stats, Vital Statistics, Local Health Area 70 (Alberni)
and Canada
25. Island Health, Local Health Area Profile 70 (Alberni), 2015
2. Statistics Canada, National Household Survey 2011 – Port Alberni [Census
Agglomeration], British Columbia, and Canada 26. Port Alberni Divisions of Family Practice (personal correspondence)
3. Alberni Valley Community Foundation, 2018 Vital Signs Survey 27. City of Port Alberni, City Council Meeting Minutes, February 13, 2017
4. Vancouver Island Regional Library (Personal correspondence with Branch Manager) 28. British Columbia Coroners Service, Illicit Drug Overdose Deaths in BC, 2008-2018
5. Canada Council for the Arts, Grant and Prize Recipients – All, https://canadacouncil.ca/ 29. Vancouver Island Real Estate Board, Market Statistics May 2018
about/public-accountability/proactive-disclosure/grant-recipients/recipients-all
30. Canadian Mortgage and Housing Corporation, Primary Rental Market Data
6. Statistics Canada, Canadian Community Health Survey, 2013-2016
7. Canadian Revenue Agency, Charities Listing, July 2018 31. Province of British Columbia, Preliminary Data Report: 2018 Homeless Count in BC, 4.8
Port Alberni
8. Statistics Canada, Financial Data and Charitable Donations, 2016
32. BC Housing, Homelessness Services, Emergency Housing Map
9. Elections BC, Provincial General Elections, Provincial Voting Results 2017
10. Elections Canada, Report on the 42nd General Election of October 19, 2015 33. Living Wage for Families, Living Wages in BC and Canada
11. First Call BC, First Call’s 2017 BC Child Poverty Report Card and BC Child Poverty Maps 34. Canadian Centre for Policy Alternatives, Working for a Living Wage 2018
12. University of British Columbia, Human Early Learning Partnership, Early Development 35. British Columbia, Ministry of Education, District Reports, Alberni (70)
Instrument Wave 6 (2013-2016), School District #70
36. Universities Canada, Facts and Stats, Tuition fees by university
13. University of British Columbia, Human Early Learning Partnership, Middle Years
Development Instrument, 2017-2018 School District #70 37. City of Port Alberni (Personal correspondence with Parks, Recreation and Heritage staff)
14. Environment and Climate Change Canada, Historical Weather Data, Port Alberni 38. Valley of Trails Short, Medium, Long Trails
15. City of Port Alberni (Personal correspondence with Development Services staff) 39. Statistics Canada, Uniform Crime Reporting Survey, Canada, British Columbia, Port
16. Alberni Clayoquot Regional District (Personal correspondence with Environmental Alberni – municipal, Port Alberni – rural
Services Coordinator)
40. Alberni Community and Women’s Services
17. Cherry Creek Waterworks District (Personal correspondence with Administrator)
41. West Coast General Hospital
18. BC Centre for Disease Control (2018). Food Costing in BC 2017: Assessing the
affordability of healthy eating. Vancouver, B.C.: BC Centre for Disease Control, Population 42. Island Health, Home and Community Care, Residential Care
and Public Health Program
43. Central 1, BC Employment Insurance Trends, May 2018
19. University of British Columbia, Human Early Learning Partnership, Middle Years
Development Instrument, 2017-2018 School District #70 44. City of Port Alberni (Personal correspondence with Economic Development Assistant)
20. Alberni Valley Transition Town Society, Alberni Valley Farm Directory Photo sources
21. Personal correspondence with ADSS Breakfast Club Coordinator (Mel Burton can
Cover: Charmead Schella
be reached at 250-723-6251 x.2430), Alberni Valley Community School Coordinator,
Alberni Valley Neighbourlink Society Read & Feed Coordinator, Bread of Life Operations Pages 6, 12, 13, 21: Alberni Valley News
Manager, Canadian Mental Health Association - Port Alberni branch Executive Director ,
EJ Dunn Backpack Program volunteer, Grace Point Church Pastor, Island Health, Jericho Pages 5, 7, 18: Erica Watson
Road Mobile Outreach volunteers, KUU-US Crisis Line Society Executive Director, Port Page 8: Alberni Valley Early Years Centre
Alberni Friendship Centre Early Years Program Coordinator, Port Alberni Shelter Society
Executive Director, Salvation Army Captain, Vincent de Paul volunteer Page 9: Tanner McIntyre
22. Island Health (Personal correspondence with Community Nutritionist) Page 11: Literacy Alberni Society
23. University of Victoria, Canadian Institute for Substance Abuse Research, 2016 Pages 14, 15: Susie Quinn
All other images provided by the Alberni Valley Community Foundation.
22When
About the Alberni Valley The Foundation was formed in 1995 with contributions from MacMillan
Bloedel, the Vancouver Foundation, and local donors. In 1997, the first
community grants were funded. In 2018, the Foundation holds approximately
Community Foundation $1,000,000. The income that this money generates is distributed to
community charities annually. Please visit www.albernifoundation.ca for
granting information.
Who Where
The Alberni Valley Community Foundation (AVCF) is one of 191 community The AVCF serves the entirety of the Alberni Valley, including lands
foundations across Canada. Community foundations act as community administered by the City of Port Alberni, the Alberni Clayoquot Regional
bank accounts, investing donated funds, allowing the principal to grow in District, and First Nations.
perpetuity, and donating the interest earned annually to the community.
The AVCF is governed by a board of eight, who are appointed by a local
committee representing municipal and First Nations government, education,
business, and labour. Why
The AVCF exists to satisfy the community and our donors.
Community
What Organizations apply for grants to help fund local projects. The Foundation has
The Alberni Valley Community Foundation: established broad and flexible criteria, enabling it to support a wide array of
community needs.
• Invests in the future of the community by creating and managing funds. All
gifts from donors go into permanent endowments.
Donors
• Provides grants to local charities to improve our shared quality of life.
People want to be sure that their dollars are used wisely, where they can do
• Addresses community needs and opportunities.
the most good. Donors may choose to support a favorite cause or they may
• Ensures the integrity of funds and the wishes of donors are respected. ask the Foundation to distribute the income according to emerging needs.
23THANK YOU CONTACT
Thank you to all of the survey respondents, photo contest Alberni Valley Community Foundation
entrants, subject matter experts, and other individuals that 3100 Kingsway Avenue
contributed to this report. You are deeply appreciated. Port Alberni, BC V9Y 3B1
Phone: 250-724-4503
Email: info@albernifoundation.ca
Website: albernifoundation.caYou can also read


