COMMUNITY NEEDS ASSESSMENT - February 2021 - Early Learning ...
←
→
Page content transcription
If your browser does not render page correctly, please read the page content below

COMMUNITY NEEDS ASSESSMENT
         February 2021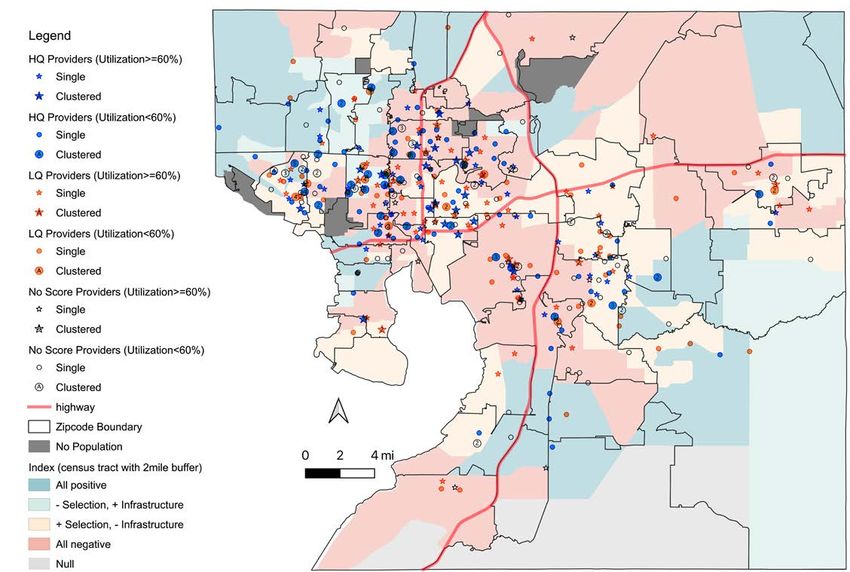
TABLE OF CONTENTS
                                       Who We Are —             3

                     Why Early Learning Matters —               4

                                        Our County —            5

                           Local Data in Real Life — 10

                               COVID-19 Impacts — 11

                                    Who We Serve — 12

                         Impact of Local Funding — 18

                 The Early Childhood Community — 19

 Early Learning Disparities in Hillsborough County — 22

                          Our Recommendations — 30

                                      Attachments — 33

                                         References — 37

                              ELCHC Community Needs Assessment 2021 | Page 2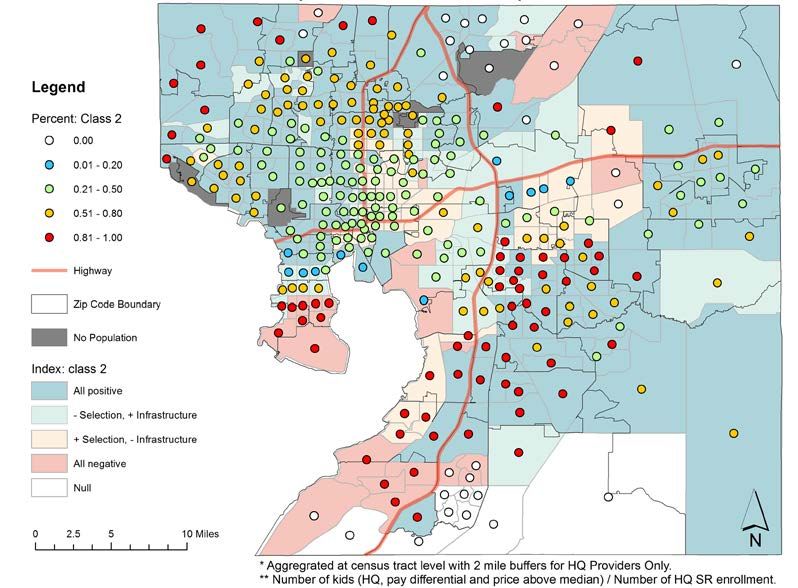
WHO WE ARE
THE EARLY LEARNING COALITION OF HILLSBOROUGH COUNTY...
is a 501-C3 organization that specializes in the funding and delivery of quality early child care, education,
after-school programs and services to the children and families of Hillsborough County. We believe all
children should have a quality early learning experience, which is essential in building a successful future.
The mission of the Early Learning Coalition of Hillsborough County (ELCHC) is to provide children, birth
to 5 years, high quality, equitable and inclusive early learning experiences preparing them for success
in school and life through the collaboration of families, educators and the community. Our vision is that
all Hillsborough County children will grow up in a safe, supportive, and nurturing environment where
their physical, social, emotional and intellectual health is a primary focus of attention at home and in the
community; their families are supported in ways that promote good parenting; and their families and
caregivers are supported in promoting each individual child’s well-being and readiness to succeed in school
and life.
PURPOSE
The ELCHC will use the community needs assessment to determine local priorities related to eligibility for
the School Readiness Program, which is a program that offers subsidized child care to working families
for children birth to 13 years old. The community needs assessment will also be used to determine the
optional need for contracted slots for child care in high-poverty areas and waivers to child care providers.
Specifically, the team will use the community needs assessment to:

       •   Assess the demographic make-up of children/families who are eligible for subsidized childcare,
           as well as unique populations within the county
       •   Review data regarding the education and social service needs of eligible children and their
           families
       •   Review data regarding the education and social service needs of children with disabilities and
           special needs
       •   Assess resources in the county that could be used to address the needs of children and their
           families including assessment of their access to these resources
       •   Determine the use of contracted slots for eligible children and families within the county
       •   Provide recommendations for prioritizing school readiness eligibility
       •   Provide data to develop criteria for waivers to child care providers whose composite score fall
           below the contract minimum, but who provide care to children in high-needs areas.
       •   Assess the need for enhanced quality child care infrastructure in high-needs areas
       •   Assess county demographics as related to kindergarten readiness

In May 2018, a team of community agencies was formed to discuss the local resources needed to compile
the prior community needs report. Those agencies are as follows: Bay Area Legal Services, Champions
for Children, Children’s Board of Hillsborough County, Early Childhood Council, ELCHC, Healthy Start
Coalition Hillsborough, Hillsborough Community College, Hillsborough County Head Start/Early Head
Start and Hillsborough County Public Schools. This report is an update of the 2018 assessment of
available data within the community. Data resources used in this report have been updated as more
current data has been made available.

                                                          ELCHC Community Needs Assessment 2021 | Page 3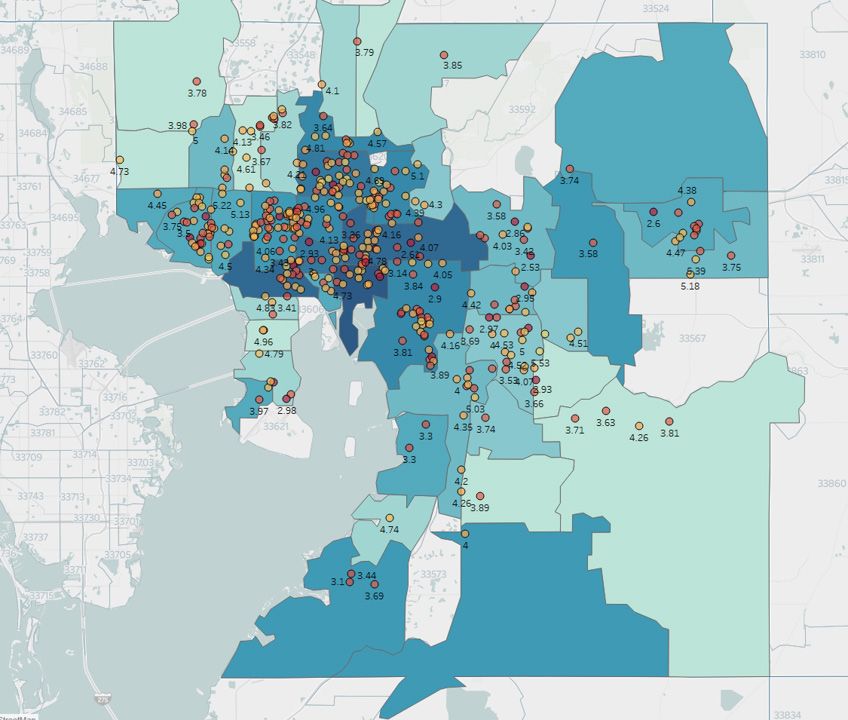
WHY EARLY LEARNING MATTERS
Why does early learning matter, and how does it affect our community?

We know from national studies and research that high-quality early education experiences can
profoundly increase a child’s development and trajectory in life. Children from disadvantaged families are
less likely to have access to high quality early education programs. This limited access directly impacts
future education and career success. A positive experience in the first 5 years can help reduce the
opportunity gaps that many children of disadvantaged families encounter. High-quality early education
is not just increasing the rate at which children experience school success, it is also a major return on
investment for society. James J. Heckman, Professor of Economics at the University of Chicago, conducted
research that determined there is a 13% return on investment on high quality early education for birth
to 5-year-olds. Investment in early education continues to be one of the highest-reaping benefits to a
community.

In order to reduce or eliminate barriers of access to quality early education programs, systemic changes
in the way we utilize resources should occur. Research has validated the call to action regarding
utilization of resources, however, we continue to see children from disadvantaged situations attending
low quality early education programs, which may adversely impact their opportunities in life. The
narrative to our community is clear, we must act to use our resources to increase the quality of child care
in Hillsborough County so that all children have the same access to future success.
Source: Heckman: The Economics of Human Potential

                                                        ELCHC Community Needs Assessment 2021 | Page 4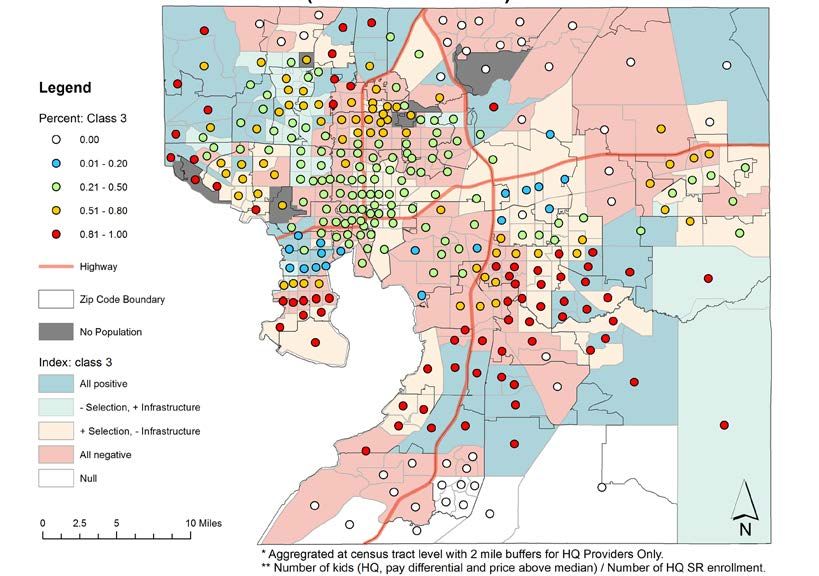
OUR COUNTY
DEMOGRAPHIC COMPOSITION
Hillsborough is growing — a lot.

Hillsborough County is on Florida’s west coast midway down the peninsula and home to 1.4 million
people, with 6% of residents under 5 years old. Hillsborough County covers a geographic area larger
than Rhode Island and is home to the seventh largest school district in the nation. Hillsborough County
is diverse. The largest racial/ethnic groups are White (48%) followed by Hispanic (29.7%), Black/African
American (18%), and Asian (4%), according to the U.S. Census Bureau. Approximately 2.9% identify as two
or more races. Of the more than 160,000 homes with children, 28% have a single female as head of the
household. The gender breakdown shows slightly more females (51.2%) than males (48.8%). Hillsborough
County is largely urban and suburban, but also has rural citrus, cattle, and produce farm areas. The
county lacks sophisticated public transportation, with local buses being the only option for families
without their own vehicle. The population of children ages birth through 12 years old mirrors the general
demographics, however, available data reveals that this population group are exposed to risk factors
such as poverty, homelessness.
Figure 1: Population Growth of Hillsborough County, Florida

                  Base: April 1, 2010                              Estimates between 10-year Census
                         Census                                    2015                              2019
                        1,229,226                               1,350,904                       1,471,968
       Source: U.S. Census Bureau, QuickFacts 2019 est.

Figure 2: Hillsborough County Cities Population

                                         Location                         Population Estimate 2019
                         Tampa                                                    399,700
                         Plant City                                                39,744
                         Temple Terrace                                            26,639
                       Source: U.S. Census Bureau, QuickFacts 2019 est.

                                                                      ELCHC Community Needs Assessment 2021 | Page 5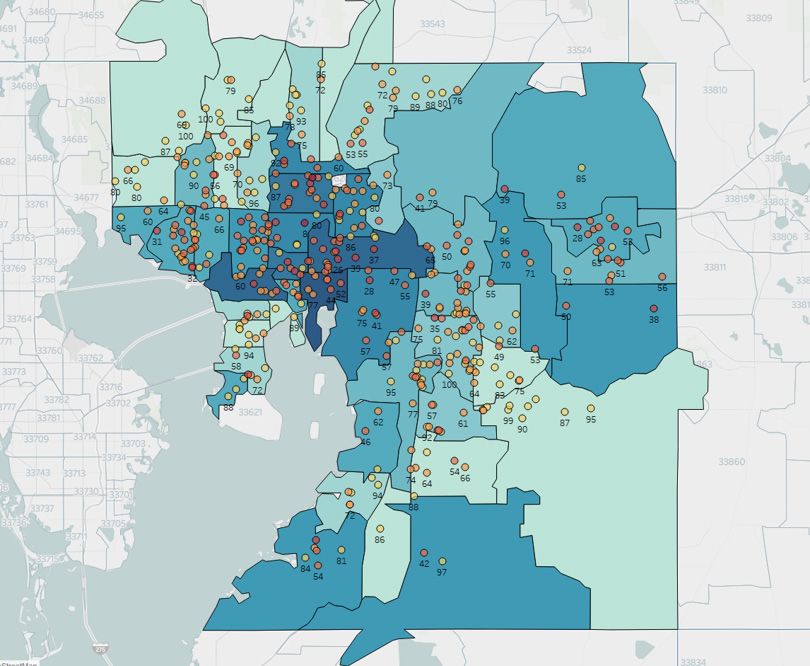
Income and Employment

The American Community Survey for 2014-2018 estimates 665,406 people are employed in Hillsborough
County. A further breakdown can be seen in Figure 3. Specializations in employment include finance
and insurance, agriculture, real estate and administrative and support services. The most common
industries in Hillsborough County are healthcare and social assistance (93,014), retail trade (82,167),
and professional, scientific, tech services (63,236). The highest paying industries are utilities ($75,431),
management of companies & enterprises ($61,691), and professional, scientific & tech services ($57,802).
The median household income in Hillsborough County is $58,480, which is less than the median annual
income of $61,937 in the United States (2018) but more than the Florida state median income ($55,660).
However, Hillsborough County pays the highest average salaries in the state, according to the Tampa Bay
Economic Development Council.

                                Figure 3: Hillsborough County Employment Status
                                                   Location                          Total
                                   Civilian Labor Force 16 years and older          1,099,131
                                                                   Employed         665,406
                                                                         Male       346,152
                                                                       Female       319,254
                                                                Unemployed           43,489

                                Source: 2018: ACS 5-Year Estimate 2014-2018

Local Workforce

According to research conducted by CareerSource Tampa Bay in its 2020-2024 Local Workforce Services
Plan, the Tampa Bay area is seeing a shift in the kinds of industry most in-demand for employees.
Growth is occuring for high-skilled industry such as tech and STEM related fields. According to the report,
Hillsborough County reached its lowest unemployment rate in more than 20 years at 2.7% in November
2019.

Despite the demand for employees in STEM and tech-related work, the top three industries in 2019 were
restaurants and dining, education and hospitals, and local government. However this demand for STEM
and tech skills could lead to an increase in workers seeking higher education for those industries.

The Regional Competitiveness Report (RCR) is a document created by the Tampa Bay Partnership
Foundation that analyzes the Tampa Bay Region’s standing in comparison to other like communities. The
2020 report mirrored similar statistics to the CareerSource Plan.
However, according to the RCR report, the average annual wage in the Tampa Bay area may be closer
to $48,304. In addition, the RCR report breaks down average wage even more. With the service sector
being the third largest employment industry — including accomodation and food services as well as
administrative services — the average annual wages for employees in this industry is closer to $27,588.
The average annual income of the lowest 20% of household earnings is $13,124; all are lower than the
national averages.
Sources: 2020-2024 Local Workforce Services Plan; Regional Competitiveness Report

                                                                        ELCHC Community Needs Assessment 2021 | Page 6
Families in Poverty

According to the 2020 Florida Child Well-Being Index for Hillsborough County, 20.1% of children under 18
years old live at or below the federal poverty line. Of these children, 36.9% live in a single parent home
and 13.5% of these children live in high poverty areas. Of the 3-year-old and 4-year-old children, 51.6%
are not enrolled in school or early education program. Figure 4 shows Hillsborough County’s highest
poverty ZIP codes, according to the American Community Survey, as well as the number of the estimated
populations under 18 years old and the number of school Readiness children served in those counties.
Overall, we serve 9,016 children in these ZIP codes; this represents 48% of our overall children served.
   Figure 4: Families and Child Data
       Zip Codes with             Estimated
                                                      Percentage of children below    Number of children receiving
     highest percentage           Population
                                                        poverty level 0-18 years      School Readiness 0-13 years
        poverty level             0-18 years
             33605                   4,171                        51.62%                          440
             33610                   13,384                       44.08%                         1,859
             33607                   4,461                        42.23%                          484
             33603                   4,461                        40.51%                          580
             33612                   11,906                       39.01%                         1,622
             33613                   5,443                        35.99%                          310
             33604                   7,753                        33.99%                          818
             33617                   10,402                       32.49%                         1,082
             33619                   9,345                        32.10%                          949
             33527                   3,616                        31.66%                          68
   Source: 2018: ACS 5-Year Estimate 2014-2018, ELCHC June 2020

Living in Hillsborough County

According to DataUSA, the median property value is $232,500, 1.01 times higher than the national
average, but the homeownership rate is 58.1%, which is nearly 5% lower than the national average.
The Comprehensive Housing Market Analysis for the Tampa-St. Petersburg-Clearwater Area was
completed by the U.S. Department of Housing and Urban Development in March 2018. This study
examined in detail different factors related to housing in the Tampa Bay region, called the Housing
Market Area (HMA). This study says the overall vacancy rate is 6.8% for the HMA. In the Tampa area,
the average highest rent in 2017 was $1,625 per month, which included the downtown area. The lowest
average was $910 in the University area, but that was a 3% increase for that area since 2016. The overall
average rate was $1,125 per month. These monthly rent averages do not include utilities or concessions.

DataUSA also estimates that the average commute time to work is 26.3 minutes, and that a majority of
the workforce commute in a single car alone to work. An estimated 45% of the Hillsborough households
own two cars; 28.3% own one car and less than 3% do not own a car, meaning that many people in our
community have the added expenses of car payments, insurance, gas and maintenance due to a lack of
alternative public transportation options.

Child Care in Hillsborough County

As of Dec. 28, 2020, Hillsborough County had a total of 1,318 child care providers: 756 child care centers
and 562 family child care homes. The ELCHC contracts with 868 providers. Attachment A on Page 33 lists
ELCHC contracted School Readiness providers by ZIP code and type.

Between July 2019 and June 2020, 39 Class I violations were issued by local child care licensing.

Hillsborough County Child Care Licensing, Dec. 2020

                                                                      ELCHC Community Needs Assessment 2021 | Page 7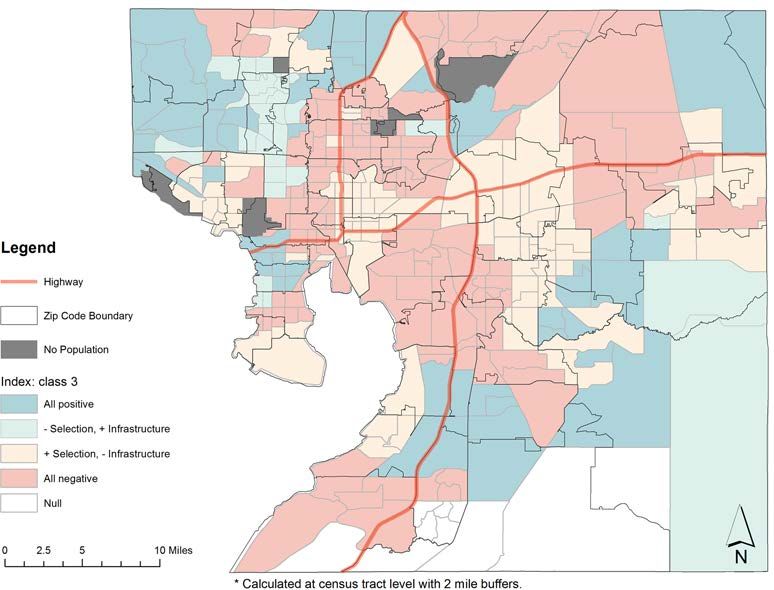
Cost of Child Care in Hillsborough County
The annual average cost of child care in Hillsborough County greatly impacts the type and quality of care
received. Each Coalition reports to the Office of Early Learning on local market rate for child care costs
within that area. The following four charts offer a look at the 2020 daily market rate for center-based
and family child care homes within Hillsborough County.
Definitions of the charts are as follows:
• Gold Seal — indicates a provider has voluntarily joined a program that designates quality standards
higher than required minimum licensing standards
• Mean or Average — the sum of the total rates divided by the total number of rates collected.
• Maximum — the highest rate in the set of rates.
• Minimum — the lowest rate in the set of rates.
• Median — the middle rate in the set of rates.
• Most Frequent — the most frequently occurring rate in the set of rates.
• Percentile is a rate where a certain percentage of rates fall below that rate. For example, the 75th
Percentile rate is $40.75 for an Infant at a Non-Gold Seal Center, that means, it was higher than 75
percent of other rates.
Figure 5: Average Cost of Full Time Child Care for Non Gold Seal Private Centers in Hillsborough County – 2020 (Provider
Reported)
School Readiness
Market Rate (Private Pay Rates)
Care Reimbursement Rate
Level Most
75th Average SR
% of 75th
Average Minimum Maximum Median Percentile Reimbursement
Frequent Percentile Rate
Rate Rate
INF 37.25 28.00 57.20 36.50 35.00 40.75 31.19 76.53%
TOD 33.61 19.80 60.00 33.50 30.00 36.35 26.42 72.68%
2YR 31.00 17.00 54.00 30.00 26.00 33.29 20.19 60.65%
PR3 28.57 17.00 50.00 27.50 27.00 31.00 18.74 60.44%
PR4 26.15 17.00 50.00 25.82 22.00 30.00 19.10 63.65%
PR5 26.82 17.00 50.00 28.00 20.00 30.75 19.08 62.03%
SCH 19.95 10.00 40.00 20.00 16.00 27.00 15.92 58.95%
Figure 6: Average Cost of Full Time Child Care for Non Gold Seal Family Child Care Homes in Hillsborough County – 2020
(Provider Reported)
School Readiness
Market Rate (Private Pay Rates)
Care Reimbursement Rate
Level Most
75th Average SR
% of 75th
Average Minimum Maximum Median Percentile Reimbursement
Frequent Percentile Rate
Rate Rate
INF 31.62 23.00 55.00 31.00 30.00 33.75 26.51 78.53%
TOD 29.11 21.85 50.00 29.00 30.00 31.50 25.54 81.08%
2YR 27.46 19.80 45.00 27.00 26.00 29.75 20.22 67.95%
PR3 26.45 18.60 40.00 26.00 26.00 28.75 19.03 66.19%
PR4 25.84 18.00 40.00 26.00 26.00 28.00 19.32 68.98%
PR5 25.06 16.00 40.00 25.00 20.00 27.00 19.20 71.11%
SCH 22.41 13.00 56.00 21.50 24.00 25.00 16.77 67.08%
ELCHC Community Needs Assessment 2021 | Page 8
Figure 7: Average Cost of Full Time Child Care for Gold Seal Private Centers in Hillsborough County – 2020 (Provider
Reported)

                                                                                             School Readiness
                                     Market Rate (Private Pay Rates)
                Care                                                                       Reimbursement Rate
                Level                                              Most
                                                                              75th         Average SR
                                                                                                           % of 75th
                          Average   Minimum   Maximum   Median              Percentile   Reimbursement
                                                                 Frequent                                Percentile Rate
                                                                              Rate            Rate

                 INF       47.34     35.00     60.00    48.60    44.00       52.00          36.69          70.56%

                 TOD       41.24     30.00     58.24    40.80    33.00       46.00          31.42          68.30%

                 2YR       37.91     23.76     56.80    36.00    27.00       43.88          24.15          55.04%

                 PR3       35.07     22.08     52.00    35.00    25.00       40.00          22.45          56.13%

                 PR4       34.38     22.00     52.00    34.00    25.00       40.00          22.91          57.28%

                 PR5       33.92     22.00     52.00    32.00    25.00       39.69          22.93          57.77%

                 SCH       28.57     13.00     43.00    29.00    20.00       33.00          19.43          58.88%

Figure 8: Average Cost of Full Time Child Care for Gold Seal Family Child Care Homes in Hillsborough County – 2020
(Provider Reported)

                                                                                             School Readiness
                                     Market Rate (Private Pay Rates)
                Care                                                                       Reimbursement Rate
                Level                                              Most
                                                                              75th         Average SR
                                                                                                           % of 75th
                          Average   Minimum   Maximum   Median              Percentile   Reimbursement
                                                                 Frequent                                Percentile Rate
                                                                              Rate            Rate

                 INF       35.45     26.00     44.00    33.56    35.00       39.25          32.64          83.16%

                 TOD       32.65     22.00     39.00    33.00    32.00       35.25          30.79          87.35%

                 2YR       30.42     20.00     39.00    30.00    30.00       33.50          25.17          75.12%

                 PR3       29.40     18.00     39.00    29.00    29.00       33.00          23.25          70.45%

                 PR4       28.34     17.00     39.00    28.50    29.00       31.50          23.13          73.41%

                 PR5       27.45     17.00     39.00    27.50    28.00       31.00          24.16          77.92%

                 SCH       23.53     12.40     33.00    22.50    24.00       25.00          20.57          82.26%

              Source: ELCHC, June 2020

                                                                    ELCHC Community Needs Assessment 2021 | Page 9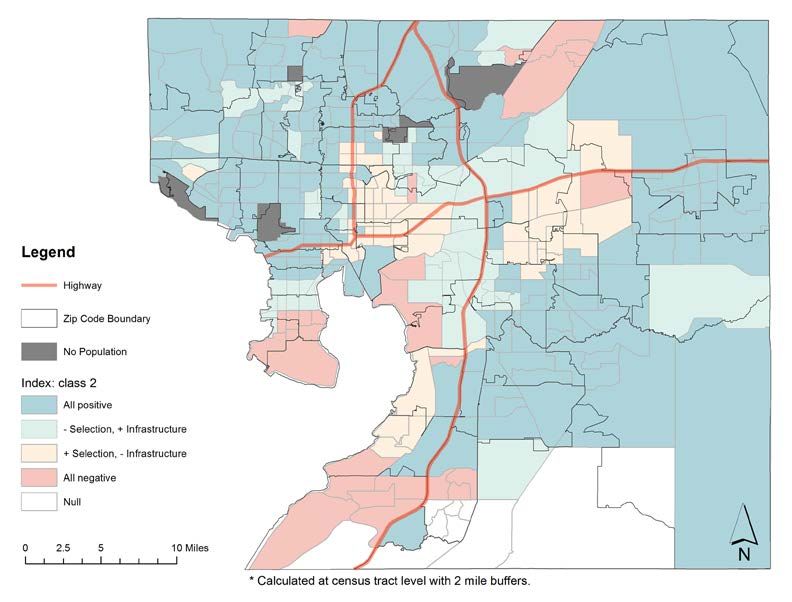
LOCAL DATA IN REAL LIFE
What do all these numbers really feel like for
Hillsborough County families?
Median household income — $ 58,480
39% households earn an income at or less than — $ 45,000
Average annual cost of rent without utilities— $ 13,500
Working days in 2020 (exluding weekends) — 262
Percentage of households with at least one car— 74%
Minimum wage — $ 8.46
INCOME:
INCOME: $58,480
$22,737
RENT: RENT:
$10,920 $13,500
CHILD CARE: CHILD CARE:
$8,908 $18,940
A single parent of two children making $12.50 A two working-parent household making the
per hour and working full time would make median income of $58,480 with children aged 2
$22,737 after taxes. If the children were 2 and and 4 years old, paying the average cost for child
4 years old, and the minimum daily rate of care care at a Gold Seal center would spend around
was chosen at a non-Gold Seal center, the parent $18,940 annually on child care. If they paid the
would pay $8,908 annually, and rent would cost average in rent, they would spend $13,500 in
$10,920 annually (if rent was $910) — leaving less rent annually, without utilities. That would leave
than $3,000 to distribute amongst utilities, food, less than $27,000 to distribute amongst utilities,
transportation, taxes and other expenses for a food, transportation, taxes and other expenses
household of three. for a household of five.
It is clear that for many individuals living in Hillsborough County, the cost
of living is financially unsustainable, considering the average employment
opportunities and household demographics presented.
ELCHC Community Needs Assessment 2021 | Page 10COVID-19 IMPACTS
Spring 2020 was an unprecedented time at every level of life due to the COVID-19 global pandemic.
Because of both local and state declarations of emergency, the ELCHC closed its physical locations to the
public on March 18, 2020, through the end of the 2019-2020 fiscal year. However, with the adaptation of
IT services and programs, the ELCHC continued providing service during this period and moved to virtual
assistance to both families and providers during traditional work hours. Training and coaching moved
to virtual platforms during the pandemic to
provide professional development to child care
teachers and directors.
The ELCHC also participated in the First
Responder and Health Care Workers Initiative,
which opened up School Readiness funding to
the children of essential workers. As of June 30,
more than 735 children were enrolled through
this initiative.
The ELCHC conducted live webinars on a monthly or as-needed basis for child care providers to assist
providers with new policies and changes related to COVID-19. The ELCHC distributed $3,580,000 as of
June 2020 of child care provider grants made possible through the CARES Act Emergency Funding Grants.
As of December 2020, the ELCHC had distributed an additional $2,918,774.
During Spring 2020, the ELCHC experienced 808 provider temporary closures. The closures are shown in
the graph above.
During this time, contracted providers were paid the School Readiness rate based on enrollment, not
attendance, as providers saw a steep drop in children attending their programs. Below is a series of maps
showing children in attendance vs children enrolled. As seen in April 2020, School Readiness children in
attendance hit the lowest rate thus far during the pandemic.
Source: OEL, 2020 ELCHC Community Needs Assessment 2021 | Page 11WHO WE SERVE
The ELCHC facilitates two main programs, which are funded through the Florida Office of Early Learning.
Voluntary Prekindergarten (VPK) is an early learning program available to 4-year-old Florida children,
regardless of family income. It is free to parents. The ELCHC also supports supplemental programs aimed
at addressing other needs in the community.
School Readiness is the second program; it reimburses child care providers who contract with the Early
Learning Coalition for children it enrolls in the program. Parents can apply for School Readiness financial
assistance, but eligibility is restrictive. A parent must be working but earning at a level that is 150% or
less below the poverty line; be enrolled in school at the high school or secondary level; or be receiving
disability assistance. Parents still pay a reduced co-payment at most facilities.
Within the School Readiness program, Early Learning Coaltions are required to priorize funding to
ensure at-risk populations are receiving assistance to increase their chances of success.
Voluntary Prekindergarten Program (VPK)
VPK was implemented in 2002 to give all of Florida’s 4-year-olds access to a quality prekindergarten
experience. VPK is designed for children entering kindergarten through school-year program that
consists of 540 instructional hours, or a summer program, consisting of 300 instructional hours. VPK
includes quality standards, approved curricula, advancement requirements for personnel and lower
classroom ratios during VPK instructional hours. VPK programs are also available for children with special
needs through the Specialized Instructional Services (SIS). The ELCHC administers and monitors the VPK
program for Hillsborough County.
Figure 9 illustrates the VPK enrollment for Hillsborough County in the past three years.
Figure 9: VPK Enrollment By Year
July 1, 2017-June 30, 2018 July 1, 2018- June 30, 2019 July 1, 2019-June 30, 2020
13,712 12,906 13,323
Source: ELCHC, 2019-2020
ELCHC Community Needs Assessment 2021 | Page 12School Readiness (SR)
The ELCHC’s School Readiness Program can help working parents with the cost of child care (frequently
called a child care subsidy). These services include extended-day, extended-year, and school age care for
children to support parents in becoming financially self-sufficient. A family’s gross income (income before
taxes, insurance, and any other deductions are subtracted) is used to determine eligibility.
Depending on the family income, the family will pay a fee for each child who receives financial assistance.
The co-payment is based on family income and family size. Parents are expected to make their
co-payment directly to the child care provider.
For a list of children served in School Readiness by ZIP and provider type, see Attachment B, page 34.
Figure 10: 2019-2020 School Readiness Children Served by Provider Type
Family Child Large Family
Center Charter Private School Public School Total
Care Home Child Care Home
16,028 25 983 347 51 1,481 18,915
Figure 11: 2019-2020 School Readiness Children Served by Care Level
Infant Toddler 2 Yr. 3 Yr. 4 Yr. 5 Yr. School Age Special Needs Total
732 1,712 2,353 2,607 2,491 1,850 7,161 9 18,915
Source: ELCHC, 2019-2020
School Readiness Eligibility Priority Categories
A child younger than 13 years old from a family that includes a parent who is receiving
TANF Recipients
temporary cash assistance under chapter 414 and subject to the federal work requirements.
At-Risk An at-risk child younger than 9 years old.
A child from birth to the beginning of the school year for which the child is eligible for admission
to kindergarten in a public school under s. 1003.21(1)(a)2. who is from a working family that is
economically disadvantaged, and may include such child’s eligible siblings, beginning with the
Economically
school year in which the sibling is eligible for admission to kindergarten in a public school under
Disadvantaged
s. 1003.21(1)(a)2. until the beginning of the school year in which the sibling is eligible to begin 6th
grade, provided that the first priority for funding an eligible sibling is local revenues available to
the coalition for funding direct services.
Priority shall be given next to a child of a parent who transitions from the work program into
Transitional employment as described in s. 445.032 from birth to the beginning of the school year for which
the child is eligible for admission to kindergarten in a public school under s. 1003.21(1)(a)2.
An at-risk child who is at least 9 years old but younger than 13 years old. An at-risk child whose
sibling is enrolled in the School Readiness program within an eligibility priority category listed in
At-Risk (School Age)
paragraphs (a) and (b) and subparagraph 1. shall be given priority over other children who are
eligible under this paragraph.
Economically A child who is younger than 13 years old from a working family that is economically
Disadvantaged disadvantaged.
(School Age)
Priority shall be given next to a child of a parent who transitions from the work program into
Transitional (School Age)
employment as described in s. 445.032 who is younger than 13 years old.
A child who has special needs, has been determined eligible as a student with a disability, has a
current individual education plan with a Florida school district, and is not younger than 3 years
Special Needs old. A special needs child eligible under this paragraph remains eligible until the child is eligible
for admission to kindergarten in a public school under
s.1003.21(1)(a)2.
A child who otherwise meets one of the eligibility criteria in paragraphs (a) and (b) and subpara-
Enrolled in Head Start &
graphs 1. and 2. but who is also enrolled concurrently in the federal Head Start Program and the
VPK
Voluntary Prekindergarten Education Program.
Added in July 2019, this category is not an eligibility priority but funding from local partners for
Local Funding the School Readiness program.
ELCHC Community Needs Assessment 2021 | Page 13Looking Deeper into the Categories
Risk Factors
Florida Kids Count monitors the well-being of children and families throughout the state and at the
county level. Some risk factors include high poverty, maltreatment, and more. This data helps to inform
policy makers about the quality of life for Florida’s children under 18 years old.
Figure 12: Children with Risk Factors in Hillsborough County
Risk Factor Number Percent
Children in single parent families 101,916 36.9%
Children living in high poverty areas 42,719 13.5%
Children with verified maltreatment 2,379 6.8%
Source: 2020 Florida Child Well-Being Index, Hillsborough
Families Receiving TANF/SNAP Benefits
According to the Office of Family Assistance (June 2020), statewide there were 66,261 TANF child
recipients in June 2020. Approximately 15.2% of all Hillsborough County households, or about 217,817
people, received food stamps (Supplemental Nutrition Assistance Program, or SNAP) during 2020.
Temporary Assistance to Needy Families (TANF, formerly known as “welfare”) is another source to assist
children and families in need.
Figure 13: School Readiness Children receiving TANF by Age Group in Hillsborough County
INF TOD 2YR PR3 PR4 PR5 SCH Total
32 31 32 29 28 12 106 270
Source: ELCHC 2019-2020
The program goals for TANF/Welfare Transition (WT) emphasizes work, self-sufficiency and personal
responsibility in a program structured to enable participants to move from welfare to economic self-
sufficiency. To accomplish this, the Florida Legislature, using federal and state funds as well as statutory
requirements, developed a comprehensive program structured to meet the following goals:
a) Provide assistance to families in need so that children may be cared for in their own home or
in the homes of relatives.
b) Develop opportunities for families to provide for their own needs, enhance their wellbeing,
and preserve the integrity of the family free of impediments to self-reliance.
c) End the dependence of families in need on government assistance by emphasizing work,
self-sufficiency and personal responsibility while meeting the transitional needs of program
participants who need support to achieve independent, productive lives and gain the
responsibility that comes with attaining self-sufficiency.
d) Take full advantage of the flexibility provided under state and federal law that allows for
providing job preparation and intervention programs to enable welfare applicants and
recipients and transitional participants to move from welfare to work.
e) Provide oversight and policy direction to the program and to ensure cooperation and
accountability among state agencies and service providers to deliver needed services
Statutory rules require that Temporary Cash Assistance (TCA) Services recipients participate in work or
alternative plan activities. The state limits recipients to a lifetime cumulative total of 48 months as an adult
and may be eligible for child care services. The following categories of work activities, based on federal
law and regulations, may be used individually or in combination to satisfy the work requirement for a
participant in the Welfare Transition program.
a) Unsubsidized employment.
b) Subsidized private sector employment.
ELCHC Community Needs Assessment 2021 | Page 14c) Subsidized public sector employment.
d) On-the-job training.
e) Community service programs.
f) Work experience.
g) Job search and job readiness assistance.
h) Vocational educational training.
i) Job skills training directly related to employment.
j) Education directly related to employment.
k) Satisfactory attendance at a secondary school or in a course of study leading to a graduate
equivalency diploma.
The Welfare Transition program places great emphasis on transitional benefits and recognizes them
as the cornerstone of Florida’s efforts to support families as they move toward full self-sufficiency.
Transitional clients are former recipients of TCA who are working or actively seeking employment are
eligible to receive employment-related education, training and related support services, such as child
care, to continue working and training or to upgrade skills for up to two years after the family no longer
receives assistance.
The Regional Workforce Board provider authorizes child care for the hours of work activity or
employment plus a reasonable time to travel to and from the child care facility and the place of work
activity/employment and return. Each family must contribute to the cost of child care through a parent
co-payment, using the fee schedule established by the local School Readiness Programs or Early Learning
Coalitions.
According to CareerSource, between July 2019 and June 2020 there were approximately of 1,822 cases
that received TANF, and 218 became Transitional. Out of the 1,822 cases:
• 1,930 cases closed
• 1,090 cases were reopened.
Source for Narrative: TEMPORARY ASSISTANCE FOR NEEDY FAMILIES STATE PLAN RENEWAL October 1, 2017 -September 30, 2020, Economic
Self-Sufficiency Program Office; CareerSource, 2019-2020
Children with Special Needs
The ELCHC and partnering agencies identify and/or serve children with special needs through a variety of
methods:
• Early Childhood Council (ECC) – ECC is contracted to provide inclusion supports for VPK children and
non-SR children served by the ELCHC. In fiscal year 2019-2020, ECC provided five inclusion trainings
to child care providers. Ninety-three early childhood settings received technical assistance and
consultation to ensure children with special needs could be maintained in their child care setting.
ECC received 101 Warm Line calls.
• Hillsborough County Public Schools (HCPS) School Readiness Inclusion and Intervention –
In the 2019-2020 year, HCPS provided oversight of the Ages and Stages Questionnaire (ASQ) tool that
is administered by individual childcare providers for the SR children at their sites. Staff from HCPS
follows up with any provider for children whose ASQ falls outside typical development scores. In fiscal
year 2019-2020, HCPS staff provides follow-up services for 2,055. Fifty-four of those children were
referred to Child Find for an Individualized Education Plan (IEP). Beginning July 1, 2020, the ELCHC took
on Screening & Assessment Services for School Readiness.
• Hillsborough County Public Schools (HCPS)- The Local Education Agency (LEA) for Hillsborough
County is HCPS. Under the Individuals with Disability Education Act (IDEA), the LEA is recognized as the
administrative agency for purposes related to the provision of special education and all other related
services. HCPS works with the Florida Diagnostic and Learning Resource System (FDLRS) to deliver
child and parent services. This coordination aids in identifying and initiating services to all children
ELCHC Community Needs Assessment 2021 | Page 15with disabilities, who are not enrolled in public school. FDLRS works in partnership with HCPS and ECC
to provide free developmental screenings for children 0 to 5 years old.
• The Primary Exceptional Education Program Services (PEEPS) and Community Primary
Exception Education Program Services (C-PEEPS) are programs that service children 3 years old
to kindergarten entry. Under IDEA, the HCPS offers early intervention to children that have a current
IEP through PEEPS and C-PEEPS. C-PEEPS programs are traditionally served in child care programs,
with a HCPS interventionist visiting the child care center weekly to facilitate special needs services in
the least restrictive environment for the child. Figure 15 represents the five most common categories
of disability or delay in childen 3 to 5 years old documented in an IEP for fiscal years 2019-2020 and
2020-2021 within HCPS.
Figure 14: HCPS Categories of Disability or Delay
Top 5 Disability or Delay Categories FY 17-18 FY 18-19 FY 19-20 FY 20-21*
Developmentally delayed 1,218 296 1,529 1,346
Speech impaired 560 534 435 185
Language impaired 509 419 359 167
Austim Spectrum Disorder 214 204 82 24
Intellectual disability 53 55 20 2
Grand total 2,554 1,508 2,425 1,724
Source: ELCHC/HCPS, FY 2019-2020, *FY 2020-2021 estimates
Unemployment and Homelessness
The unemployment rate for the Tampa-St. Petersburg-Clearwater Region in June 2020 was 9.0%, however
this was largely due to the economic impacts of the global COVID-19 pandemic. In January and February
2020 the rate was between 3 and 4%, before the virus had its greatest economic impact; by October
2020, the rate was showing signs of reduction at an estimated 5.6%, according to the Bureau of Labor
Statistics. This region was slighly higher than statewide the unemployment rate for January and February
2020, which was 2.8%; but lower than the state’s October 2020 estimate of 6.5%.
Additionally, affordable housing is in short supply.
According to the 2020 Council on Homelessness Annual Report, Hillsborough County Public Schools
identified more than 4,000 students who met the definition of homeless in the 2018-2019 school year.
As of June 30, 2020 there were 24 children that have been identified as homeless and receiving School
Readiness funding, however there may have been more who transitioned out of homelessness before
the end of the fiscal year.
ELCHC Community Needs Assessment 2021 | Page 16Families with Domestic Violence
In 2019, a report from the Florida Department of Law Enforcement stated that Hillsborough County had
6,730 reported cases of domestic violence or a rate of 465.8 per 100,000 population. This compared to
a state-wide average rate of 496.5 cases per 100,000. Hillsborough’s rate is a decrease of 3.1% from the
2018 report of 6,775 cases. In these reports, offenses classified as domestic violence include murder,
manslaughter, rape and attempted rape, assault, stalking, threat or intimidation, and forcible fondling.
The ELCHC offers School Readiness for children under Protective Services, which falls under the At-Risk
category.
Source: Florida’s Uniform Crime Reports, Domestic Violence, Florida Department of Law Enforcement, 2019
Figure 15: School Readiness Children in Protective Services
INF TOD 2YR PR3 PR4 PR5 SCH Total
279 481 549 554 507 291 1,145 3,806
Source: ELCHC 2019-2020
Economically-Disadvantaged Families
In addition to other categories, the ELCHC’s largest population served is within the economically-
disadvantaged categories. Families can be eligible to receive child care assistance through the School
Readiness program under the economically-disadvantaged priority if they are at or below 150% of
the federal poverty line or making less than 85% of the State Median Income. A single parent must be
employed at least 20 hours per week or pursuing eligible education; two-parent households must work
40 hours combined per week or pursuing eligible education. Exceptions include exemption from work
requirements due to age or disability. Children of these families are eligible birth through 12 years old,
however the prioritization of School Readiness eligibility is further broken down by the child’s age.
Figure 16: Economically-Disadvantaged Category by Care Level
INF TOD 2YR PR3 PR4 PR5 SCH Total
366 1,088 1,632 1,888 1,812 1,411 5,583 13,780
Source: ELCHC 2019-2020
ELCHC Community Needs Assessment 2021 | Page 17IMPACT OF LOCAL FUNDING
Local Funding and State Match
Through our community partnerships the ELCHC receives local funding to serve families and children
below 200% of FPL. Local funds have the potential to be matched 1:1 by state dollars which helps to
reduce the number of children on the School Readiness waitlist. Children served under this program are
accounted for both in the economically disadvantaged and local funding category.
Families 150% Above the Federal Poverty Line
ALICE is a United Way acronym for Asset Limited, Income Constrained, Employed. ALICE represents
those who work and are above the federal poverty level, but due to high costs of living expenses and
factors often beyond their control, must live paycheck to paycheck. For many, a small emergency can
quickly become a major financial crisis for families, such as car repairs and health care emergencies that
may drive these working families into poverty and financial challenges. When this happens, families,
employers, and our economy suffer. In response to this need, the ELCHC created the ALICE > 150 Local
Initiative to help families enter the School Readiness program to receive quality subsidized childcare at a
cost that does not place them deeper into poverty when financial crises arise.
Using local funds and matching state funds, the ALICE > 150 Local Initiative allows entry to the School
Readiness program for the population marginally >150% of the federal poverty line. Children ages infant
up to age 13 are eligible.
In the 2019-2020 fiscal year, the ELCHC served 1,215 School Readiness children in this local funding
initiative.
Children are transferred into another funding priority when eligible. Figure 17 shows our local funding
partnerships through the July 2019-June 2020 Fiscal Year and children served through the year.
Figure 17: Local Funding and School Readiness children served in 2019-2020
Local Funding Served FY 19-20
Caspers Company Match & Local 60
Children’s Board of Hillsborough County 4 Plus, Local, Match & Metropolitan Ministries 3,256
City of Tampa Match 425
Hillsborough County BOCC Match 1,046
Hurricane Maria United Way Local 46
Hurricane Maria Community Foundation Local 42
Robles THA Match & Local 16
SouthShore Community Foundation Match & Local 209
United Way Match & Local 166
Source: ELCHC 2019-2020
ELCHC Community Needs Assessment 2021 | Page 18THE EARLY CHILDHOOD
COMMUNITY
Hillsborough County has many community partners working together for
children and families in our community. The following summaries of these
other organizations captures each scope and area of service.
Head Start/Early Head Start
The Board of County Commissioners (BOCC) of Hillsborough County Purpose:
operates Head Start/Early Head Start programs for Hillsborough Hillsborough County Board of
County Commissioners Head
County. Head Start enrollment is based on eligibility.
Start/Early Head Start is an
Head Start families must be 100% below the federal poverty level, exemplary childhood program
but don’t have to be employed. There are additional program that partners with families
requirements for eligibility. and the community to build a
The 2018-2019 enrollment eligibility breakdown is shown in the pie foundation for self-reliance.
chart. We provide quality educational
Hillsborough County’s Head Start program is one of the largest in the opportunities
for ALL children and their
southeastern United States. In fiscal year 2018-2019, Hillsborough families in a safe and nurturing
County Head Start was funded to serve 3,474 children and pregnant environment. We employ
women. This includes 3,071 Head Start children, 343 Early Head Start qualified and
infants and toddlers, and 24 pregnant women. caring staff committed to the
Several program options were offered: social, emotional, and physical
• Full-day (10.5 hours)/full-year center-based Head Start for well-being of all children.
parents who are working or enrolled in an education or job
training program in 19 county-operated facilities and four
contracted child care partners (Easter Seals, R’ Club, Kings Kids, and Bible-Based)
throughout Hillsborough County. This option
served 1,295 children.
• Full-day (6 hours)/part-year center-based Head
Start for 1,812 children in a delegate agency,
Hillsborough County Public Schools (HCPS), in 60
elementary school sites.
• Full-day (10.5 hours)/full-year center-based
Early Head Start for 167 children in five County
operated facilities and two contracted child care
partners, Bible-Based and King’s Kids Academy.
• Full-day (10.5 hours)/full-year family child care
home- based Early Head Start for 200 children in
two delegate agencies (Lutheran Services Florida
and Tampa Metropolitan Area YMCA).
• Expectant Parent Program.
Source: Hillsborough County Head Start/Early Head Start 2018-2019 Annual
Report
ELCHC Community Needs Assessment 2021 | Page 19Champions for Children
Champions for Children is a nonprofit agency that serves families and
Purpose: children in the Hillsborough County community. Their mission is to
to build stronger build stronger families in the Tampa Bay region through its child abuse
families in the Tampa prevention and family education programs. They carry out their mission
Bay region through its through family education and prevention programs, such as home visiting,
child abuse prevention training and networking courses. The Champions for Children 2019-2020
and family education Impact Report details the scope of the agencies reach in the county.
programs. During the 2019-2020 year, 11,658 children and adults were served in
classes and individualized support; 4,641 individuals participated in parent-
child educational programs; and 2,048 family members received child
development home visiting services. Also, 25,661 community members
received education on child abuse and bullying prevention. Champions
for Children offers a variety of support program for families and children.
Some of their programs include:
• Talk Read Sing Tampa Bay — Community awareness campaign
focused on educating Tampa Bay residents, especially parents,
about the importance of developing a child’s brain by talking,
reading, and singing beginning at birth
• Positive Parenting Partnership (P3) — classes for parents
designed to positively influence marriage and couple stability,
healthy relationships, financial health, and parenting confidence.
• Nurturing Dads — a program offered to fathers and soon-to-be
fathers to get crucial parenting skills needed to nurture and care
for their first baby.
Source: 2019-2020 Champions for Children Impact Report https://cfctb.org/need/community-impact/
Children’s Board of Hillsborough County
The Children’s Board of Hillsborough County was established in 1988 by
Purpose:
voter referendum. According to the 2019 Children’s Board Annual Report,
to grant funding to
the organization awarded $32 million in grants to 113 programs during
programs so they may
the fiscal year. From that, 183,000 individuals received services through
provide high quality
the Children’s Board and other agencies funded by its grant programs.
services to children and
families in Hillsborough.
Source: Children’s Board of Hillsborough County 2019 Annual Report
Healthy Start Coalition of Hillsborough County
The mission of The Healthy Start Coalition Hillsborough County is to
Purpose: improve the health and well-being of pregnant women, children and
to improve the health families in Hillsborough County. The agency does this through several key
and well-being of programs. Some of the highlights of its programs are featured within its
pregnant women, 2020 Annual Report. Those highlights include the Healthy Start Program
children and families in delivered services to 8,287 women and 11,957 newborns; the Safe Baby
Hillsborough. Plus program trained 750 professionals in Safe Baby Training; the Nurse
Family Partnership conducted 4,139 home visits; and Healthy Families
Hillsborough served 1,938 children during 2020.
Source: Healthy Start Coalition of Hillsborough County 2020 Annual Report
ELCHC Community Needs Assessment 2021 | Page 20Elementary Education
Hillsborough County Transformation Schools & Graduation Rate Goals
According to the National Center for Education Statistics (NCES), the national graduation rate for public
high schools in the 2017-2018 school year was 85%, up from 79% in 2010-2011. Former President Barack
Obama’s administration set a goal of a 90% graduation rate by 2020; In 2015, Hillsborough County Public
Schools (HCPS) set the same goal for its high schools for 2020. In the 2018-2019 year, HCPS reported a
86.2% rate.
Since 2018, HCPS re-organized a plan that was once called Achievement Schools, now called
Transformation Schools. The goal of the Transformation Network is to close the achievement gap
through concentrated, high quality instruction at 28 schools which have scored under a C rating.
These schools are Title 1: 23 elementary, three middle and two K-8 Schools. They serve a culmulative
14,000 students. Figure 18 identifies the Transformation Schools and ZIP Codes.
Figure 18: Transformation Schools
School Name ZIP Code
Adams Middle 33612
Broward Elementary 33603
Burney Elementary 33563
Cleveland Elementary 33604
DeSoto Elementary 33605
Dunbar Elementary Magnet 33607
Folsom Elementary 33592
Foster Elementary 33610
Giunta Middle 33578
James Elementary 33610
Jennings Middle 33584
Kenly Elementary 33619
Kimbell Elementary 33617
Lockhart Elementary Magnet 33610
Mango Elementary 33584
McDonald Elementary 33584
Miles Elementary 33612
Mort Elementary 33613
Oak Park Elementary 33605
Pizzo K-8 33617
Potter Elementary 33610
Robles Elementary 33610
Shaw Elementary 33612
Sulphur Springs K-8 33604
Tampa Heights Elementary Magnet 33610
Temple Terrace Elementary 33617
Thonotosassa Elementary 33592
Witter Elementary 33612
Source: HCPS; National Center for Education Statistics
ELCHC Community Needs Assessment 2021 | Page 21EARLY LEARNING DISPARITIES
IN HILLSBOROUGH COUNTY
INTRODUCTION
Over the past year, the ELCHC has been studying the early education landscape of the county, through work
titled “Early Education Disparities in Hillsborough County.” This work was undertaken with the help of the
reseach team at the University of Florida Anita Zucker Center for Excellence in Early Childhood Studies. The
impetus for this work was a revision to Rule 6M-4.741, F.A.C., which became effective in May 2020. This revision
increased the contract minimum threshold composite score that providers must achieve in order to be a part
of the School Readiness program. This minimum score to contract increased from a 2.51 to a 3.50 in the 2020-
2021 year and to a 4.0 in the 2021-2022 year. An exception the 2020-2021 threshold was given to existing
providers who scored between a 3.00 and 3.49. If a provider scored between a 3.0 and a 3.99 in the 2020-2021
year, they will be placed on a quality improvement plan. As of February 2021, this rule is being revised by the
Office of Early Learning.
IMPACT TO HILLSBOROUGH’S SCHOOL READINESS COMMUNITY
Composite scores can change on a daily basis as providers receive their annual observations.
However, based on current numbers, the ELCHC has approximately 88 providers below a 3.5 and 116 below
a 4.0 — affecting a potential 2,731 children or 6,464 children, respectively. It would also negatively impact
child care employment. With so many providers potentially falling below the minimum threshold, the ELCHC
was concerned that the rule change could create “child care deserts” for School Readiness families as well as
disrupt the continuity of care for at-risk children.
SUMMARY
To look further into the needs of our community both related to the rule change and other areas of need, the
ELCHC entered into an agreement with the University of Florida to collaborate on an analysis.
Lead Research Scientist Herman Knopf analyzed School Readiness providers at all composite CLASS score levels
along with other socioeconomic demographics.
The ELCHC and UF teams’ research results are highlighted in the following tables, maps and graphs with
the purpose of informing the ELCHC leadership team of the potential impacts of increased contract score
requirements and guide discussion on what, if any, accommodations should be made to maintain or increase
access to child care services throughout Hillsborough County. In addition, ELCHC staff developed an additional
series of maps to overlay socioeconomic conditions in Hillsborough County to more clearly show the
communities in the county which will be hit the hardest from the restriction of access to early learning programs.
ELCHC Community Needs Assessment 2021 | Page 22THE CLASSROOM ASSESSMENT SCORING SYSTEM
The Classroom Assessment Scoring System (CLASS) tool by Teachstone was chosen by the state to assess
programs. CLASS measures the quality of teacher-child interactions, including emotional and behavioral
support, engaged support for learning, classroom organization, and instructional support for children
ages birth to Kindergarten entry. CLASS observations are conducted in half of the classrooms of each age
group (Infant/Toddler/Preschool). A Composite Score is given to each provider. Scores can range between
a 1.00 and a 7.00.
READING THE FLICCA MAPS
The follow sets of maps represent multiple Florida Index of Child Care Access (FLICCA) data points in one
map. The colors represent different scenarios in Hillsborough County:
Scenario 1 (S1) —Positive Selection and Positive Infrastructure
Given the School Readiness (SR) care available to parents, a greater proportion of parents are choosing
high quality care. There are a greater number of high quality child care slots than there are children
receiving subsidies in these areas. This is the preferred scenario.
Scenario 2 (S2) —Negative Selection and Positive Infrastructure
Given the SR care available to parents, a greater
proportion of parents are choosing low quality
care There are a greater number of high quality
child care slots than there are children receiving
subsidies. This indicates a need to improve parent
selection.
Scenario 3 (S3) —Positive Selection and
Negative Infrastructure
Given the SR care available to parents, a greater
proportion of parents are choosing to use
high quality care However, there are a greater
number of children receiving subsidies than
there are high quality slots. This indicates a need
for more high quality slots.
Scenario 4 (S4) —Negative Selection and
Negative Infrastructure
Given the SR care available to parents, a greater proportion of parents are choosing low quality care.
There are a greater number of children receiving subsidies than there are high quality child care slots.
This indicates a need for more high quality slots and a need to improve parent selection.
ELCHC Community Needs Assessment 2021 | Page 23CHILD CARE CHOICES IN HILLSBOROUGH COUNTY
Distribution of High Quality/Low Quality Providers
This map shows the distribution of High Quality (HQ) and Low Quality (LQ) providers using CLASS Scores
of 4.0 as the threshold for quality overlayed with the physical locations of child care providers plotted
using a detailed legend. Quality sites are plotted in blue, while lower quality sites plotted in orange.
Stars represent child care sites that serve a large proportion of school readiness children compared to
the number of private pay children served; specifically, greater than or equal to 60% school readiness
children. Circles represent child care sites that serve less than to 60% school readiness children. When
it comes to capacity of quality child care slots for school readiness families, blue stars representing high
quality/high utilization sites would be ideal.
Map 1: Distribution of HQ/LQ Providers & Index (Score >=4.0)
Map created by the research team at the University of Florida Anita Zucker Center for Excellence in Early Childhood Studies
S1 Preferred scenario S3 Need for more high quality slots
S2 Need to improve parent S4 Need for more high quality slots
selection and a need to improve parent
selection.
ELCHC Community Needs Assessment 2021 | Page 24Infrastructure and parent choices, CLASS Scores 3.5 & 4.0
Maps 2 and 3 show the geographic distribution of High Quality (HQ) and Low Quality (LQ) providers
within Hillsborough County. The FLICCA Matrix helps illustrate that when the quality threshold moves
from a 3.50 to a 4.00 CLASS Composite Score, the infrastructure of high-quality child care in the county
significantly declines. Areas that were once dark and light teal (S1 & S2) representing a preferred
scenario for quality infrastructure, turn into yellow and pink (S3 & S4) which indicates a need for more
high-quality slots. Areas of light teal and pink (S2 & S4) also indicate a need to improve parent selection
of high quality child care programs.
Map 2: Hillsborough FLICCA*, Score >= 3.5
S1 Preferred scenario
S2 Need to improve parent
selection
S3 Need for more high quality
slots
S4 Need for more high quality
slots and a need to improve
parent selection.
Map 3: Hillsborough FLICCA*, Score >= 4.0 Maps created by the research team
at the University of Florida Anita
Zucker Center for Excellence in Early
Childhood StudiesChild care costs and parent choices, CLASS Scores 3.5 & 4.0
These maps show the percentage of children enrolled in high quality child care services at CLASS
Score 3.5 (Map 4) and 4.0 (Map 5) within each Census Tract in Hillsborough County that are paying a
differential at price higher than the median price in Hillsborough County. By differential, we mean the
cost difference between the private pay rate and the rate paid for the subsidized School Readiness
services. The maps show parents are paying a higher differential in certain geographical areas of the
county regardless of the high-quality infrastructure in the region. The market rate for child care services
in certain geographical areas in the county are the driving force behind private pay rates.
Map 4: Percent** of SR Children that Pay Differential & Price Above/Equal Median
(Score >= 3.5)
S1 Preferred scenario
S2 Need to improve parent
selection
S3 Need for more high
quality slots
S4 Need for more high
quality slots and a
need to improve parent
selection.
Map 5: Percent** of SR Children that Pay Differential & Price Above/Equal Median
(Score >= 4.0)
Maps created by the research
team at the University of Florida
Anita Zucker Center for Excellence
in Early Childhood Studies
ELCHC Community Needs Assessment 2021 | Page 26POVERTY AND CHILD CARE IN HILLSBOROUGH COUNTY
Poverty + Kindergarten Readiness Rates
Map 6 illustrates poverty rates in Hillsborough County overlaid with VPK Providers and their performance
based on the VPK Program Provider Kindergarten Readiness Rate. Specifically, the darker the shade of blue,
the higher poverty rate of children under 18 years of age (2018 American Community Survey, U.S. Census
Bureau). Each plot on the map represents a VPK provider, the color of the plot & the adjacent number
represents the provider’s performance on their Readiness Rate for the 18-19 program year, which is a rating
up to 100. The darker shades of orange to red are the lower performing VPK providers.
The Readiness Rate given to VPK Providers is based on how VPK students perform on two measures:
• The Florida Kindergarten Readiness Screener, which is currently the Renaissance Star Early Literacy
assessment during the first 30 days of Kindergarten
• The VPK Assessment to show learning gains which is administered at the beginning & end of VPK by the
teacher (accounts for up to 10% of the rate)
• The minimum rate is set at 60% by the Office of Early Learning. Providers under this rate are considered
low performing providers.
Takeaways:
Notice how the higher poverty areas, typically have lower performing providers. This is a trend that is also
reflected with public schools and their 3rd-grade reading levels. This data shows the opportunity gap that
children from disadvantaged families experience in Hillsborough County, specifically when it comes to access
to quality VPK child care providers. Investing in more resources and instructional support for VPK programs in
higher poverty area could potential help minimize this gap.
Map 6:
Poverty and
Kindergarten
Readiness Rates
Map created by the ELCHC, 2020
ELCHC Community Needs Assessment 2021 | Page 27You can also read