A Case Study of a Community Affected by the Witch and Guejito Fires - NIST Technical Note 1635
←
→
Page content transcription
If your browser does not render page correctly, please read the page content below
NIST Technical Note 1635

    A Case Study of a Community
Affected by the Witch and Guejito
                            Fires

                       Alexander Maranghides
                                William Mell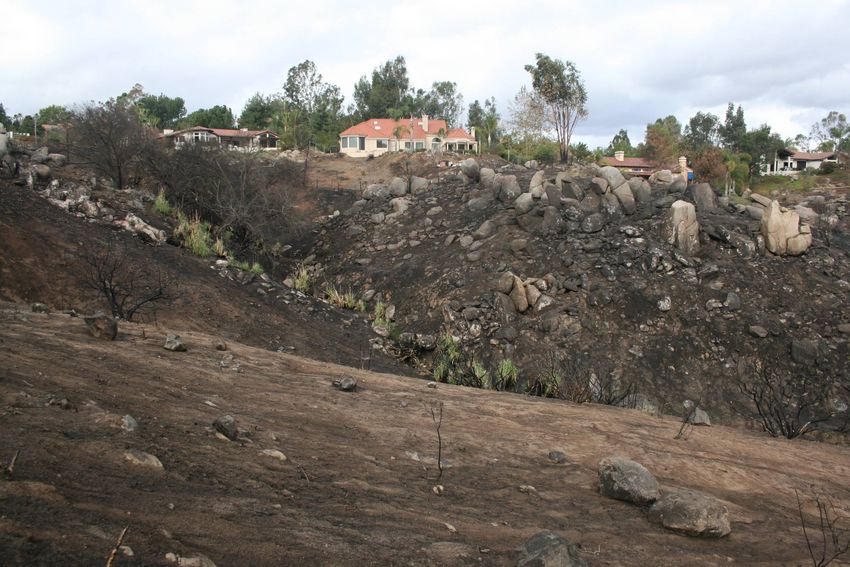
NIST Technical Note 1635

    A Case Study of a Community
Affected by the Witch and Guejito
                            Fires

                                    Alexander Maranghides
                                                William Mell
                             U.S. Department of Commerce
                                 Technology Administration
                      Building and Fire Research Laboratory
                              National Institute of Standards
                                            And Technology
                                   Gaithersburg, MD 20899

                                                  April 2009

                             U.S. Department of Commerce
                                    Gary Locke, Secretary

              National Institute of Standards and Technology
                        Patrick D. Gallagher,Acting Director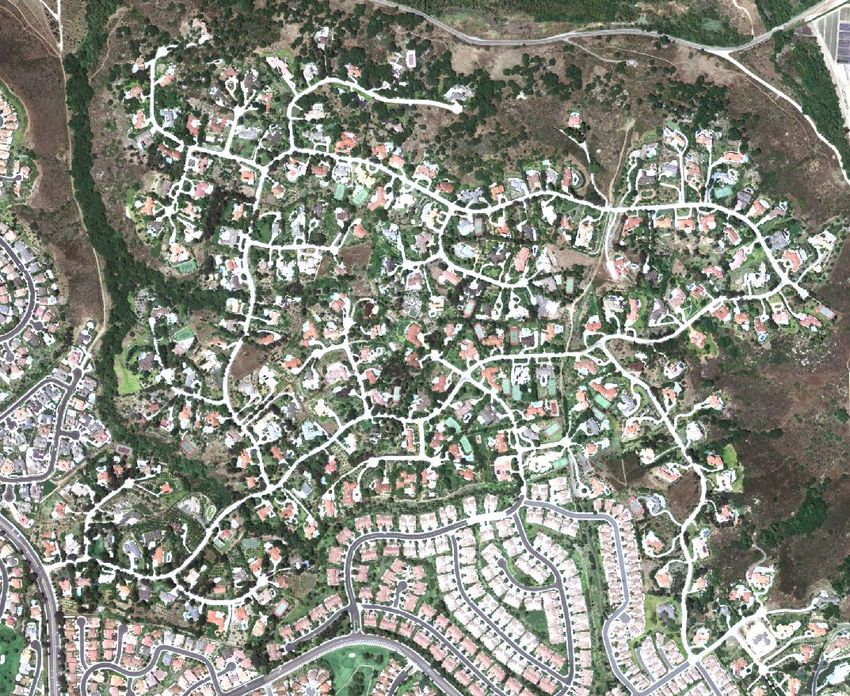
Certain commercial entities, equipment, or materials may be identified in this
                    document in order to describe an experimental procedure or concept adequately. Such
                           identification is not intended to imply recommendation or endorsement by the
                       National Institute of Standards and Technology, nor is it intended to imply that the
                       entities, materials, or equipment are necessarily the best available for the purpose.

                     National Institute of Standards and Technology Technical Note 1635
                     Natl. Inst. Stand. Technol. Technical Note 1635, 59 pages (June 2009)

Cover Page Photo: The Trails Monday 22 October 2007, Photo Courtesy of Mark Weir, Used by Permission

                                               ii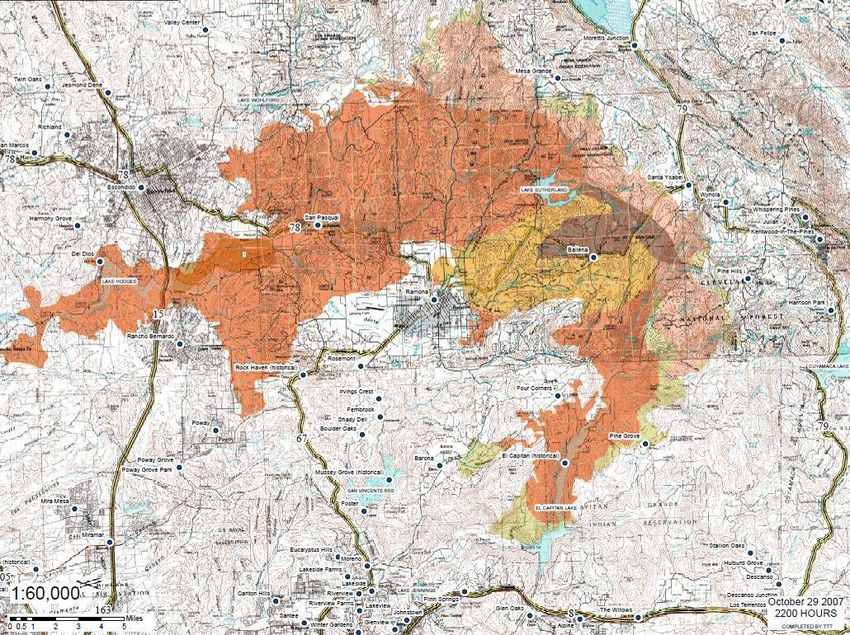
Table of Contents

List of Figures ................................................................................................................................ iv
List of Tables .................................................................................................................................. v
List of Tables .................................................................................................................................. v
Abstract ........................................................................................................................................... 6
1.0     Introduction ......................................................................................................................... 7
   1.1 Previous Case Studies ........................................................................................................... 8
2.0 Objective of Case Study............................................................................................................ 9
3.0 Area of interest – Rancho Bernardo, The Trails Community................................................... 9
4.0 Witch Creek and Guejito Fire Ignitions.................................................................................. 10
5.0 Weather ................................................................................................................................... 11
6.0 Data Collection ....................................................................................................................... 12
7.0 Wildland Fuel and Fuel Moisture ........................................................................................... 12
8.0 Fire Approach Timeline.......................................................................................................... 13
   8.1 Timeline within The Trails ................................................................................................. 13
   8.2 Fire Spread within The Trails ............................................................................................. 16
9.0 Structure Exposure to Fire and Embers .................................................................................. 17
10.0 Defensive Actions................................................................................................................. 18
   10.1 Timeline of actions ........................................................................................................... 19
11.0 Partly Damaged Structures ................................................................................................... 20
   11.1 Interior versus Perimeter Structural loses ......................................................................... 22
12.0 Structure Ignition Data.......................................................................................................... 22
13.0 Commonly held beliefs in light of these findings................................................................. 24
14.0 Summary of findings and discussion .................................................................................... 25
   14.1 General Fire Behavior....................................................................................................... 26
   14.2 Structural Loses and Defensive Actions ........................................................................... 26
15.0 Unanswered Questions.......................................................................................................... 26
16.0 Future Work .......................................................................................................................... 27
17.0 Acknowledgments................................................................................................................. 27
18.0 References............................................................................................................................. 58

                                                                         iii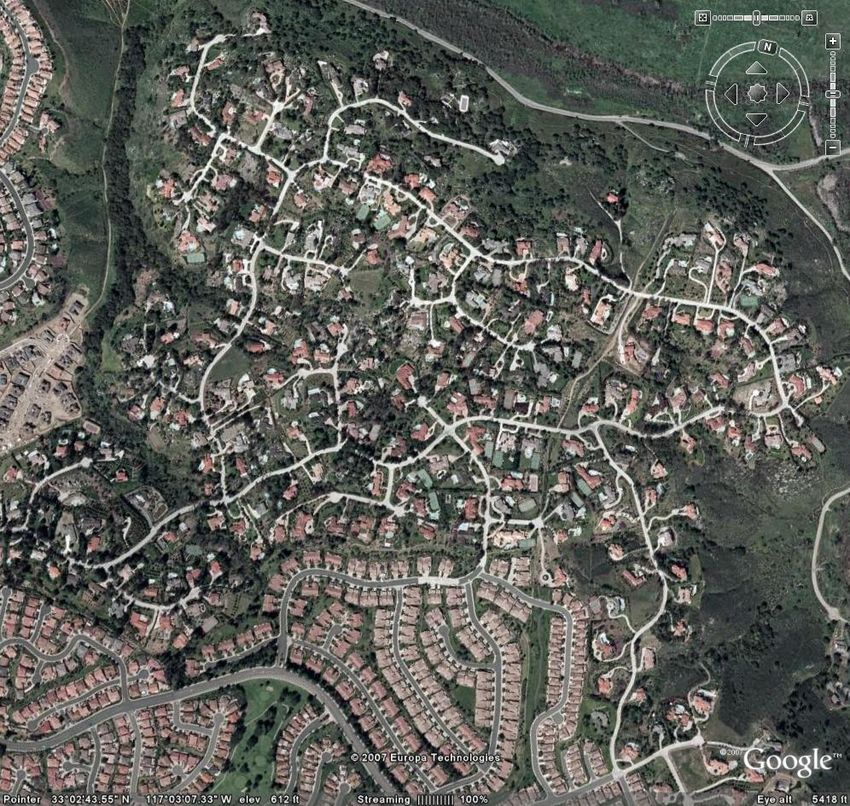
List of Figures

Figure 1: The Trails Community, Destroyed Homes (in Yellow) and Fire Perimeter after the
           Guejito and Witch Fires ............................................................................................... 29
Figure 2: Destroyed Structures in the vicinity of Rancho Bernardo, CA ..................................... 30
Figure 3: Structure Densities in Three Different WUI Settings ................................................... 31
Figure 4: Origins of the Guejito and Witch Creek Fires, the combined perimeter of both fires and
                  the locations of the weather stations used later in the report. (map Courtesy of
           CALFIRE).................................................................................................................... 32
Figure 5: Weather data from Ramona Airport.............................................................................. 33
Figure 6: Northwest Corner of The Trails .................................................................................... 34
Figure 7: North Side of The Trails................................................................................................ 35
Figure 8: East Corner of The Trails .............................................................................................. 36
Figure 9: Southeast Corner of The Trails – Sycamore Creek....................................................... 37
Figure 10: West side of The Trails ............................................................................................... 38
Figure 11: Southwest side of The Trails....................................................................................... 39
Figure 12: Angosto Way before October 22nd, 2007 (circa 2005)................................................ 40
Figure 13: Angosto Way after October 22nd 2007 ........................................................................ 41
Figure 14: Topographic mps of The Trails................................................................................... 42
Figure 15: The Trails - Fire approach........................................................................................... 43
Figure 16: Timeline of Structures Burning in The Trails ............................................................. 44
Figure 17: The Trails - Flame Spread and Needle Freeze ............................................................ 46
Figure 19: Golf Ball Providing Direction of Highest Heat Flux .................................................. 47
Figure 20: Fire Line progression within The Trails...................................................................... 48
Figure 21: Rock Outcrop Acting as a Fire Break ......................................................................... 49
Figure 22: The Trails Defensive Actions...................................................................................... 50
Figure 23: Impacts of the Defensive Actions Taken at The Trails............................................... 51
Figure 24: Damaged Structures. See Table 6 for further information on each house according to
           number on figure. ......................................................................................................... 52
Figure 25: The Trails - Ignition categories of destroyed structures and perimeter/interior outline
           ...................................................................................................................................... 53
Figure 26: Structure Ignition Category A Fire from the wildlands burns uninterrupted up to the
           structure........................................................................................................................ 54
Figure 27: Structure Ignition Category B ..................................................................................... 54
Figure 28: Structure Ignition Category C ..................................................................................... 55
Figure 29: Potential Structure Ignition Categories A, B and C .................................................... 56
Figure 30: House burning times, fire spread and fire jumps ........................................................ 57

                                                                        iv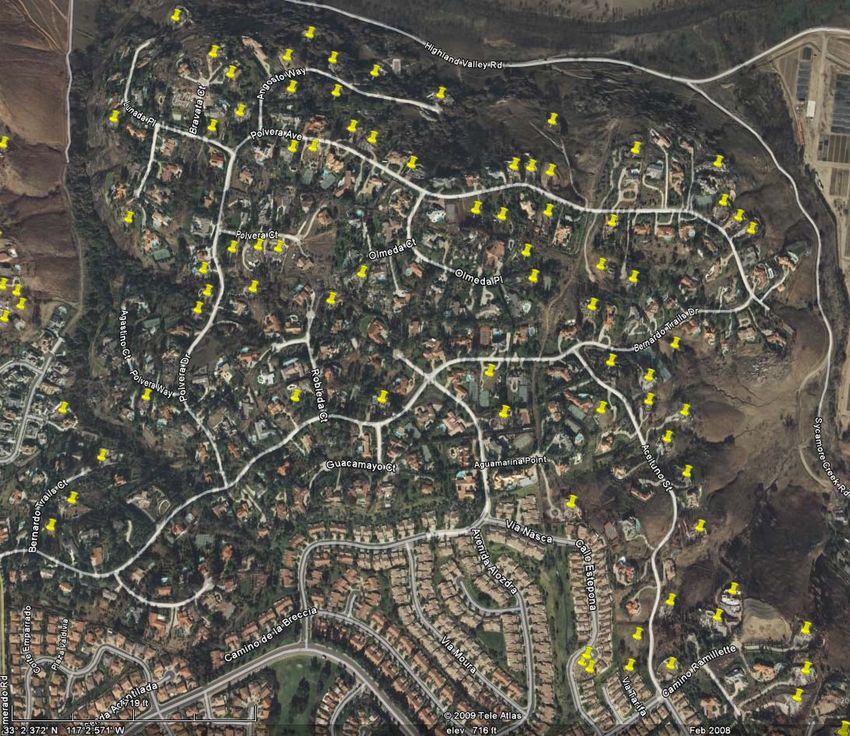
List of Tables

Table 1: Geographic Locations of Four Weather Stations ........................................................... 11
Table 2: Weather Summary .......................................................................................................... 11
Table 3: Timeline of Completely Destroyed Structures ............................................................... 15
Table 4: Timeline of Defensive Actions....................................................................................... 20
Table 5: Homes that were defended while burning ...................................................................... 20
Table 6: Damaged Structures and Defensive Actions .................................................................. 21
Table 7: Ignition Categories A, B, and C ..................................................................................... 23
Table 8: Homes Destroyed - Interior ............................................................................................ 24
Table 9: Homes Destroyed - Perimeter......................................................................................... 24
Table 10: Time Distribution of Potential Structure Ignition Categories A, B, and C .................. 24

                                                                  v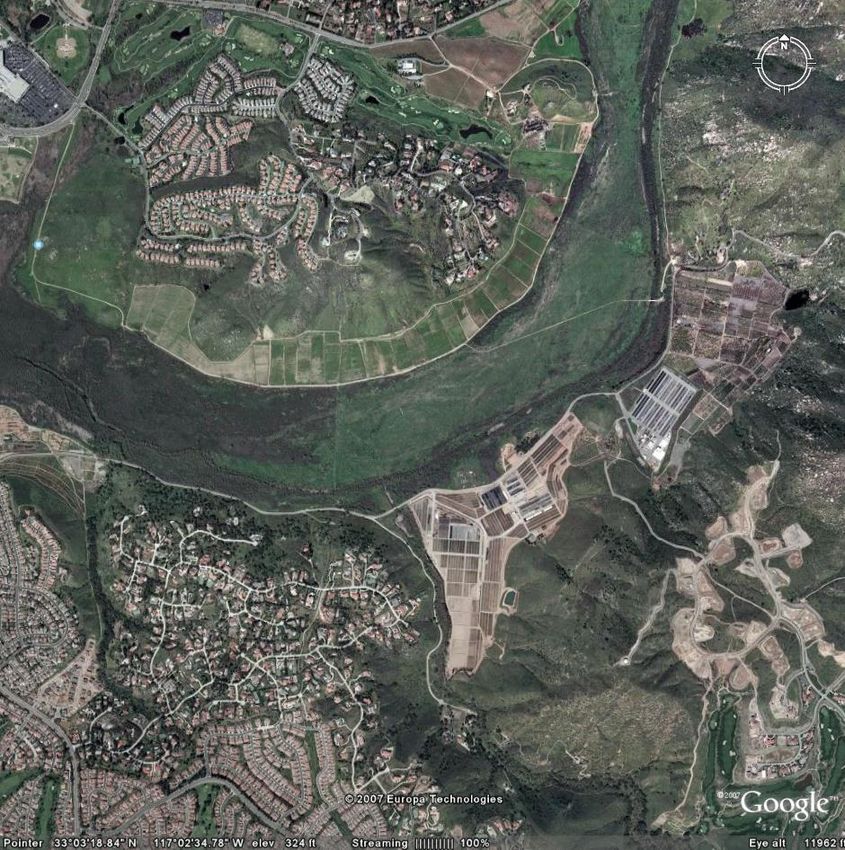
A Case Study of a Community Affected by the Witch and Guejito Fires
                                                by

                             Alexander Maranghides, William Mell

                                            Abstract

The National Institute of Standards and Technology (NIST) has a Reduced Risk of Fire Spread
in Wildland-Urban Interface (WUI) Communities research program. The program objective is
to develop, by the end of FY2013 first generation tools for improved risk assessment and risk
mitigation in WUI (wildland-urban interface) communities at risk from wildfires. These tools
will be developed and tested through a coordinated effort that includes laboratory and field
measurements, physics-based fire behavior models, and economic cost analysis models. The
NIST WUI Team was invited by CAL FIRE to collect post incident data from the California
October 2007 fires. Early on, the NIST WUI Team initiated a case study within the Witch Fire
perimeter. The case study is focused on The Trails development at Rancho Bernardo, north of
the City of San Diego. There were 274 homes in The Trails, with 245 within the fire perimeter
74 homes were completely destroyed and 16 were partly damaged. Field measurements included
structure particulars, specifically roof type, proximity of combustibles to the structure, and
damage to wildland and residential vegetation. Documentation included over 11 000 pictures.
The data collected and the data analysis to be conducted are divided into three initial papers.
This paper will address the event timeline reconstruction and general fire behavior observations.
The second paper will investigate the impacts of structure attributes, landscaping characteristics,
topographical features and wildland fire exposure on structure survivability. Lastly, the third
paper will investigate the use computer modeling as a tool to understand fire behavior at the
WUI.

KEY WORDS: Wildland Urban Interface, WUI, fire behavior, community, Witch fire, Guejito
     fire

                                                6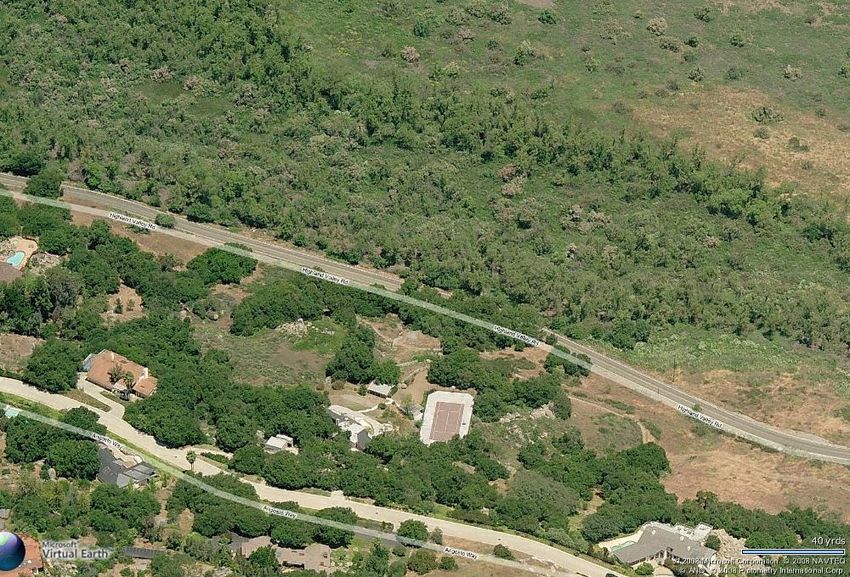
1.0 Introduction

The National Institute of Standards and Technology (NIST) has a Reduced Risk of Fire Spread
in Wildland-Urban Interface (WUI) Communities research program. 1 The program objective is
to develop, by the end of 2013 first generation tools for improved risk assessment and risk
mitigation in WUI communities at risk from wildfires. These tools will be developed and tested
through a coordinated effort that includes laboratory and field measurements, physics-based fire
behavior models, and economic cost analysis models.
Despite the increasing frequency and losses from WUI fires, there has been relatively little
research, compared to fires within structures, on WUI fire spread. This is due, in part, to the fact
that the subject of WUI fire research falls between traditional studies of building fires and forest
fires, non-overlapping areas that in the past have been the responsibility of different branches of
the government. Advances in measurement science are needed to effectively characterize and
identify the conditions and mechanisms that result in a high risk of structure ignition across a
range of WUI community types and conditions. Also, to date, no study that measures the
effectivenes of current risk mitigation practices, whether through wildland fuel treatments or
modification of residential fuels, has been conducted.
In this paper, the term WUI refers to locations where topographical features, vegetation types,
local weather conditions and prevailing winds result in potential for ignition of structures from
flames and embers of a wildland fire. 2 The WUI fire problem is gaining momentum across the
Southern continental US and is particularly severe across southern California. Between October
2003 and October 2007, seven California WUI fires destroyed a total of 8877 structures, 3 on
average over 2200 structures per year. These seven fires resulted in 29 deaths, and over 317 000
hectares (783 000 acres) burned. The 2003 Cedar fire and the 2007 California Firestorm are
among the top four fire incidents for the number of structures destroyed and acres burned. The
Witch fire, the largest of the fires that occurred during the 2007 California firestorm, burned
80 124 hectares (197 990 acres) and destroyed 1125 residential structures, 509 outbuildings and
239 vehicles. Additionally, 77 residential structures and 25 outbuildings were damaged.
Suppression costs were $18 million. The property damages for the 2007 California Fire Storm,
dominated by the Witch fire, are estimated at $1.8 billion 4 . The Witch Fire resulted in 45
firefighter injuries and two civilian fatalities. The Witch Fire started on October 21, 2007 at
12:35 pm at the Witch Creek area, east of Ramona in San Diego County.

The NIST WUI Team was invited by the California Department of Forestry and Fire Prevention
(CAL FIRE) to collect post incident data from the California October 2007 fires. Early on, the
NIST WUI Team initiated a case study within the Witch Fire perimeter. The case study is
focused on The Trails development at Rancho Bernardo, 40 km (25 miles) north of the City of
San Diego. There were 274 homes in The Trails, with 245 within the fire perimeter (Figure 1).
Seventy four homes were completely destroyed and 16 were partly damaged.

The NIST data collection effort was designed to provide the necessary information to
characterize the fire approach from the wildlands, the effects of fire within the community and
the defensive actions taken. The intent has been to collect sufficient information, not only to
characterize overall fire behavior in the WUI, but also to provide a foundation for future case
studies. In that light, the following data collection methodology was developed and followed:

                                                 7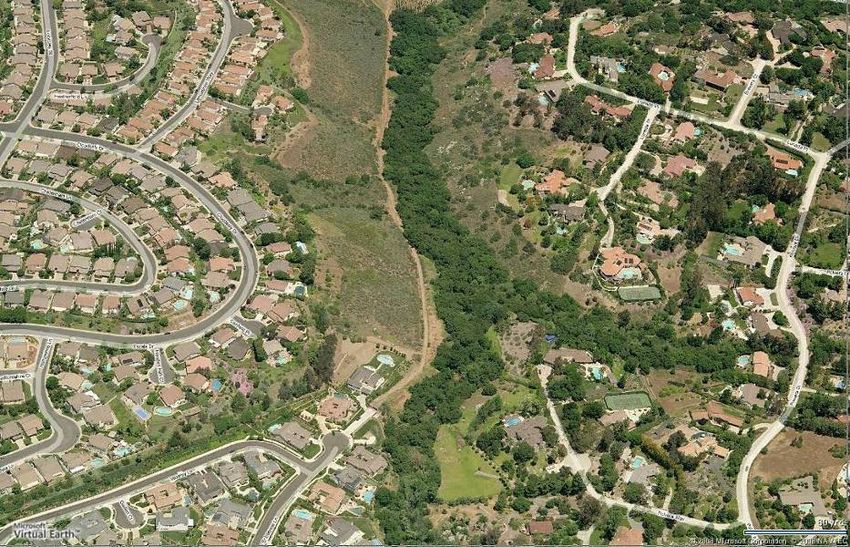
1. Immediately after the fire, the construction characteristics of the destroyed residences
      were documented as well as all the damage to residential vegetation. This was necessary
      in order to capture the information before it was lost during community reclamation/
      recovery efforts.
   2. Characteristics of the wildlands surrounding the community were then documented and
      data were collected on the direction and intensity of the wildland fire approach.
   3. Technical meetings were conducted with first responders to develop an event time line.
      At the same time, The Trails homeowners association provided critical input to the event
      timeline.
   4. The community was revisited to collect structure construction and landscaping
      particulars on all non-destroyed structures.

The field data collection effort took approximately 1300 person hours over 14 months. Field
data were collected by NIST personnel and CAL FIRE Fire Marshals with the support of
residents, and the San Diego Fire and Police Departments. Field measurements included
structure particulars, specifically roof type, proximity of combustibles to the structure, and
damage to wildland and residential vegetation. Documentation included over 11 000 digital
photo images. The data collected and the data analysis conducted are divided into three initial
papers. This paper will address primarily the event timeline construction and general fire
behavior observations.

The second paper (work in progress) will explore the response of structures within The Trails to
the WUI fire. Specifically, the second paper will “apply” different WUI hazard reduction
guidelines to the community and determine how well the guidelines match the observed
structure responses to the fire. The second paper will explicitly look at the structure construction
and ornamental vegetation impact of structure survivability. A third paper will then be
developed to compare the outputs of different fire models to the observed fire behavior and
structural fire responses in the community. It is the intent of the authors to make the post-fire
data set self-contained to enable its use by other fire researchers. The data set will be placed on
the NIST WUI website at www.fire.nist.gov/wui.

The NIST WUI research effort has three components: computer model development,
experiments and field data collection. All three components are interlinked and work together
towards reducing losses in the WUI. Fire behavior models are being developed to help
characterize and predict fire behavior in the wildlands and at the interface. At the same time, the
experimental work is being conducted, with input from the field data collection, to characterize
and quantify structure ignition vulnerabilities. Modeling and experiments will also be used to
assess the potential effectiveness of hazard reduction techniques. By implementing this
comprehensive methodological approach to studying communities burned by wildfires, the
effectiveness and reliability of such techniques may be better assessed. 5

       1.1 Previous Case Studies

A number of studies have been conducted after WUI fires. Nonflammable roofs were defined in
these cases as roofs made of non-combustible materials such as spanish type, cement, metal or
asphalt shingle. In 1973, Howard 6 observed a 95 % survival of homes with nonflammable roofs.
Foote 7 studied structural survival of the 1990 Paint fire and also observed over 80 % survival of
homes with nonflammable roofs and a clearance of 9 m (30 feet) or more. The 2007 USDA

                                                 8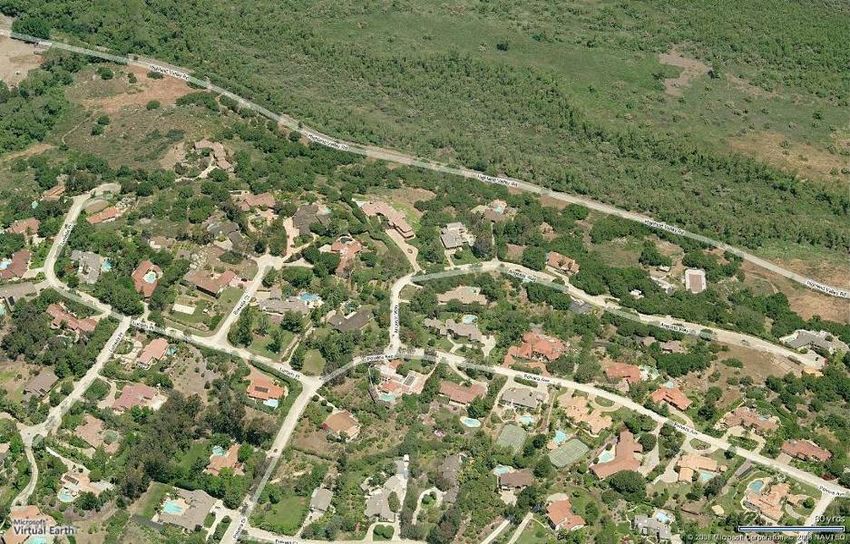
Angora fire study focused on assessing fuel treatments effects on fire behavior, suppression
effectiveness and structure ignition. 8 The report focuses on the wildland fuels treatments;
however, it provided little information on structure characteristics. The Home Destruction
Examination report of the Grass Valley Fire by Cohen and Stratton 9 has provided a very useful
time line reconstruction; however the report does not directly couple the defensive actions taken
to the individual structures. More recently, the Institute for Business and Home Safety (IBHS)
had conducted a study of the Witch Fire. 10 The IBHS study’s primary objective was to
determine the relative merits of property protection measures ranging from individual actions to
community-wide actions. Blanchi and Leonard 11 conducted an investigation of structure ignition
mechanisms after the 2003 fire in the Duffy community of Canberra, Australia 2003. The report
identified that 50 % of the ignitions were from embers only, 35 % were from embers and radiant
heat, while 10 % were from radiant heat alone. The report also included the comprehensive
survey form that was used in the data collection process. Although the survey has two questions
relevant to defensive actions, very limited information on defensive actions taken is presented in
the report.

The above listed case studies have in common the lack of linking defensive actions to individual
structures. Without factoring in the defensive and suppression actions taken by first responders
and homeowners, any conclusions on fire behavior and structure survivability are incomplete
and may be erroneous.

2.0 Objective of Case Study

To understand the fundamentals of fire behavior at the WUI, the study attempts to address the
following technical questions:
    - How far within a community did the fire spread?
    - To what extent did embers contribute to ignition of structures?
    - Why did the fire spread stop when it did?
    - Did all the structures ignite from the passage of the wildland fire front, or were some
       structures ignited later and why?

A timeline was developed for the event and the damage that occurred to structures, residential
vegetation and surrounding wildland vegetation was documented. Additionally, the fire fighting
and structure protection responses taken shortly before and during the fire event were also
documented. An analysis of the resident evacuation was outside the scope of this study. An
analysis of structure construction and landscaping particulars will be documented in the second
paper (work in progress).

3.0 Area of interest – Rancho Bernardo, The Trails Community

This study is focused on The Trails community at Rancho Bernardo. The community extent is
1.5 km (1 mile) from East to West and 1 km (0.6 mile) from North to South. Community
elevations range from 125 m to 200 m (415 feet to 660 feet) above sea level. The community
rests on a knoll and is surrounded by valleys on three sides. To the north is Highland Valley, at
elevations from 100 m to 110 m (330 feet to 365 feet). To the east is Sycamore Creek at similar
elevations while to the west is a ravine at elevations ranging from 100 m to 135 m (330 feet to

                                                9
445 feet). The community is 23 km (14 miles) east of the Pacific Ocean. The community
consists of 283 residential lots (Figures 1 and 2). Although some lots on the perimeter of the
community are larger, typical lots are approximately 6000 m2 (1.5 acres). At the time of the fires
there were 274 residences. Out of the 245 residences within the fire line, 74 were completely
destroyed and an additional 16 sustained various degrees of damage. Housing density is
approximately 116 homes per km2 (300 homes per square mile). Figure 3 illustrates three
different housing densities. The Trails is represented on the left, a community in Rancho Santa
Fe, California is shown in the middle and a low density housing area is shown on the right. Note
that the houses are not evenly distributed as the “density” becomes lower. The housing density
within The Trails is greater than the densities seen outside of Rancho Bernardo but lower than
the densities seen to the west of The Trails (Figure 2).
4.0 Witch Creek and Guejito Fire Ignitions
It was initially believed that The Trails community was impacted only by the Witch Creek Fire.
The After Action Report October 2007 Wildfires, City of San Diego Response 12 identified the
Guejito Fire as the main fire that hit The Trails. The Witch Fire 13 was ignited in the Witch Creek
area east of Ramona, California, about 27 km (17 miles) east of The Trails, at approximately
12:35 pm on October 21, 2007. The cause of ignition was determined as electrical line arcing.
The Guejito Fire 14 started, twelve and a half hours later, at 1:00 am October 22nd, 2007 at
Guejito Creek drainage, on the South Side of California State Route 78 and 0.4 km (¼ mile)
west of Bandy Canyon Rd, or 10 km (6 miles) northeast of The Trails. The cause of ignition was
identified as energized power lines contacted lashing wire. The following excerpt from the After
Action Report described the general progression of the Guejito Fire:
“The Guejito Fire spread rapidly along the river bottom area of the San Pasqual Valley
and southwest toward Highland Valley Road. SDFD strike teams engaged in numerous
firefights along the Highland Valley Road and Bandy Canyon Road areas, but in many
cases were forced to retreat by the wind-driven flames. It took just over two hours from
the start of the Guejito Fire for the first homes in northeastern Rancho Bernardo to be
destroyed by fire. The Guejito Fire spread west along Highland Valley Road, eventually
spotting across Interstate 15 and ultimately destroying hundreds of structures in West
Rancho Bernardo.”
Late Sunday night residents of Rancho Bernardo were informed through mass media that
the Witch Fire would be arriving at their communities around 11:00 am Monday morning. The
ignition of the Guejito Fire well to the west of the Witch Creek fire caused the anticipated
timeline for resident evacuation to be moved into early Monday morning. By approximately
2:16 am (one hour and sixteen minutes after ignition, the Guejito Fire was identified as posing a
significant threat to the Rancho Bernardo Community and the San Diego Fire Chief requested
the activation of the City’s Emergency Operation Center. Figure 4 contains a map illustrating
the origins of the Guejito and Witch Creek Fires, the combined perimeter of both fires and the
locations of the weather stations used later in the report. The combined perimeter encompasses
the total area burned by both fires.
105.0 Weather
Weather data was obtained from MESO West 15 operated by the University of Utah. Four
weather stations were used. The stations were selected for their proximity to either the study
area or the fire origin. Table 1 lists the particulars of the stations. Figure 4 shows the
geographical location of the stations, the fire origin locations for the Witch and Guejito fires,
and the location of The Trails community.
Table 1: Geographic Locations of Four Weather Stations
Station Name Station ID Latitude ° Longitude ° Elevation (m)
Poway NE1 SDPOY 32.9606 -117.0192 182
Ramona KRNM 33.0375 -116.9158 423
Airport
Escondido SPV CI153 33.0810 -116.9760 119
Julian JULC1 33.0756 -116.5917 1292
The Weather Station at Julian is 10 km due East from the Witch fire origin. It displayed a wind
shift from west to east early on the morning of October 21st 2007. The relative humidity ranged
between 30 % and 40 % prior to the wind shift and was reduced to 16% by noon. By 12:15 pm,
the sustained wind at Julian was recorded at 38 km/hr and gusting to 69 km/h. The Witch fire
ignited at 12:35 pm.
The Ramona Airport weather station is 13 km due east from The Trails. The station recorded a
dramatic drop in humidity while also recording a rapid increase in wind speed. Similar
behaviors were recorded by the Poway NE1station, located 10 km SSE of The Trails, and are
summarized in Table 2. Figure 5 displays wind speed, wind gusts, wind direction and relative
humidity at Ramona airport between October 20th and October 22nd.
Table 2: Weather Summary
Station Date and Time Wind Wind Gust Wind Direction Relative
Name Speed (km/h) Humidity (%)
(km/h)
Poway October 21st 0 22 North 90
NE1 00:45
October 21st 34 42 North 14
11:45
Ramona October 21st 0 0 East 94
Airport 00:45
October 21st 42 61 East North East 7
11:53
Escondido SPV is 2 km South West of the Guejito fire origin. Although the Escondido SPV
data was received by MESO West it did not have the MESO West Quality Check Flag ensuring
data reliability. The data displayed similar trends to the Ramona Airport data. On October 21st,
between 8:00 am and 10:00 am, the relative humidity dropped from 100 % to 15 % and the wind
11increased from 11km/h to 36 km/h. At the time of the Guejito fire ignition, station CI153
reported a relative humidity of 8 %.
Limited quantitative information is available for the weather conditions at The Trails during the
morning of October 22nd. Residents and Firefighters reported “extreme” winds and a residential
weather station on Polvera Avenue and facing Highland Valley registered 91km/h in the early
morning hours. Accounting for the possible amplification of the winds due to the Highland
Valley NE orientation and Northerly wind, it is estimated that wind speeds at the Trails were at
least as severe as those at Ramona or Poway.
6.0 Data Collection
Field data collection was initiated four days after the fire by NIST personnel and CALFIRE Fire
Marshals. Field measurements were initially focused on destroyed structures and extent of burn
damages through the community. This focus was necessary due to the short life span of that
data. Subsequent data collection was focused on the structures that survived the fire. Data
included structure particulars, including building construction and roof type, proximity of
combustibles to the structure, and damage to wildland and residential vegetation. The impacts of
construction type on structure survivability will be addressed in the second report on this study
(work in progress). Documentation included over 11000 pictures. San Diego Fire and Police
departments provided critical information for the development of the event timeline. Similarly,
The Trails Homeowners Association provided essential observations from residents. Additional
tools used during the study included CALFIRE generated wildland fuel maps, Google Earth,
Microsoft Virtual Earth and Pictometry information. 1
7.0 Wildland Fuel and Fuel Moisture
The CALFIRE Witch Incident Fuel Map 16 contains information on the Witch fire perimeter and
wildland fuel type. Thirteen different fuel types were involved within the perimeter of the
Witch Fire. The Highland Valley is covered primarily by Barren/Rock/Other (Fuel Model 99),
with Brush (Fuel Model 5) on the western side and Agricultural Lands (Fuel Model 97) on the
eastern side. The mount occupied by the Trails is surrounded by Hardwood/Longpole Pine (Fuel
Model 8) to the north and west. A small amount of Brush (Fuel Model 5) can also be found on
the western side of the mount and in the main ravine/chute on the northern side. The eastern side
is primarily Brush, with a couple of patches of Grass (Fuel Model 1). At the base of Sycamore
Creek, there is Barren/Rock/Other (Fuel Model 99) surrounding the Creek. Figures 5 through 11
show the inhomogeneities in wildland fuel on the slopes surrounding The Trails before the
Witch and Guejito fires. Wildland fuels surrounding The Trails vary in type as well as density.
Figures 12 and 13 show Angosto Way, which borders the northern edge of The Trials, before
1
Certain commercial entities, equipment, or materials may be identified in this document in
order to describe an experimental procedure or concept adequately. Such identification is not
intended to imply recommendation or endorsement by the National Institute of Standards and
Technology, nor is it intended to imply that the entities, materials, or equipment are necessarily
the best available for the purpose.
12and after the fires. The extent of damage to the canopy on the northern side of Highland Valley
road is clearly evident as is the lack of canopy damage up slope, near the structures. Just before
the fires reached The Trails, dead fuel moisture for 1 hour fuels is estimated at less that 10 %.
8.0 Fire Approach Timeline
The following timeline data for the flame spread of the Guejito and Witch fires on the morning
of October 22nd 2007 was collected from first responders 17 and community residents. 18 The
Guejito Fire started at 1:00 am. By 1:30 am the head of the Guejito fire met with Santa Isabel
Creek which bisects Guejito Creek, 3.2 km (2 miles) from its point of origin. This suggests an
average spread rate of 6 km/h (3.75 mph). Between 3:15 am and 3:20 am the head of the fire
turned southwest and started down Highland Valley. By 3:50 am, the fire front had reached the
intersection of Highland Valley road and Sycamore Creek, covering a distance of 4.5 km (2.8
miles) in a little over 30 minutes at a rate of 9.0 km/h (5.6 mph). At that time the fire had
reached the perimeter of The Trails. A high intensity fire (based on observations of crown
damage) was concentrated around the trees on the river bed to the north of The Trails, with
lower intensity burning along the valley floor.
At the time the Guejito Fire was moving southwest down Highland Valley, it was also spreading
towards the intersection of Bandy Canyon/Highland Valley Road. It reached that intersection by
3:30 am and homes there began to burn.
At the same time, the Guejito fire was moving towards The Trails, the Witch Creek fire was
advancing west. Because of the large magnitude of the Witch fire perimeter it has been difficult
to identify its exact location over time as it approached The Trails. The following data points
provide a general idea of its timeline. By 2:55 am the Witch Fire reached the San Pasqual
Academy 1 kilometer (0.6 miles) east of the Guejito origin and 23 km from its own point of
origin. At 6:00 am another part of the Witch Fire was making its way down Clevenger canyon 5
kilometers (3.0 miles) east of Guejito origin and 23 km from its own point of origin.
The Trails was assaulted by both the Guejito and the Witch fires. The main front of the Guejito
Fire reached The Trails at approximately 3:45 am Monday morning October 22nd and came from
the Highland Valley. It is estimated that the Witch Fire arrived at the southeastern part of The
Trails sometime around 6:00am. Figure 14 shows the topographic characteristics of The Trails
and Figure 15 illustrates the approach of the Guejito and Witch fires.
8.1 Timeline within The Trails
The following timeline includes ember exposure, burning vegetation, and burning structure
information. The chronological steps vary in duration to better capture the nature of the event. It
should be noted that the available data is partial and limited in the sense that the frequency of
reported observations is a function of number of the observers present, which was inconsistent
and decreased with time. The timeline reconstruction focuses on the destroyed structures, while
damaged structures are addressed in section 11.0, later in the document. Reported observations
of structures that were ultimately destroyed are divided in four categories: (1) some visible
flaming, (2) fully involved flaming, (3) almost completely burned out, and (4) destroyed with
13essentially no flames visible. In most cases, only one observation is available for a particular
structure.
In the following time reconstruction for destroyed structures, burning structures were reported
along with their degree of burning, when the observation was made (Figure 16). In that respect,
structures that are fully involved during a time interval and binned in one time step could
possibly have ignited during the previous time interval. There is therefore potentially a
significant temporal uncertainty associated with the actual ignition times of the structures. Even
though smoldering could had been present for hours before the flaming occurred, it is estimated
that initiation of flaming combustion can be estimated to within one hour. An attempt is made to
estimate structure ignition times and total number of homes burning during each time interval.
This is reported later in this section. Structure burning observations are documented in Figure
17.
2:00 am to 3:30 am
Embers appear on the perimeter of the community, from the burning wildland fuels as early as
2:30 am. The first vegetation ignitions are reported at 2:30 am and 2:45 am. These ignitions
were a result of spotting from the Guejito Fire which at 2:30 am was over 4.5 kilometers (2.8
miles) away. Vegetation began to burn in the interior of the community by 3:00 am. Three
structures were ignited and six vegetation ignitions are reported throughout the community by
3:30. All three structures were on the north-west side of the community adjacent to or within
150 m (500 ft) from the wildlands.
3:30 am to 4:30 am
The main fireline of the Guejito Fire reached the community between 3:30 and 4:00. Embers
were reported across the entire perimeter of the community as well as in the interior and there
are sixteen different vegetation fires. This was the period of highest reported structure burning
activity. Four additional homes were burning between 3:31 am and 3:50 am and sixteen more
between 3:55 am and 4:30 am. Out of the twenty-two new homes that were reported burning in
this time period, eleven were showing some flames visible, while the remaining nine were fully
involved.
4:30 am to 5:30 am
Active ember attack was still reported across the perimeter and the interior; however the total
number of ember observations was reduced to six. Vegetation burning observations were down
to two. Nine additional homes were burning in this time window. Seven were showing some
flames visible and two were fully involved.
5:30 to 6:30 am
An additional eight homes were reported burning in this time window, including two that were
almost completely consumed. An additional two homes were completely consumed and no
longer burning. It is during the end of this time interval that the Witch Fire likely arrived at The
Trails from the east. Four out of the ten additional burning homes reported in this time window
were on the eastern perimeter of the community.
6:30 am to 10:30 am
In this time window, five additional homes were burning. Additionally, there were three
previously unreported homes that were identified as destroyed and no longer burning.
1410:30 am to 12:30 pm
One new home burned in this window and eight previously unreported homes were identified as
completely destroyed and no longer burning.
12:30 pm to 3:15 pm
The last home was ignited and burned in this time window. In less than twelve hours after the
Guejito fire arrived at The Trails no homes were burning.
Table 3 lists the breakdown of destroyed structures as a function of time. The category, “No
longer burning” refers to structures that were already destroyed at the time of the first
observation. The category “Partial data” refers to structures where observations were made prior
to structure ignition, i.e.: subsequently destroyed home was not burning at the time of
observation. The data in the table shows that new structure burning observations peak at 22
structures / hour between 3:30 to 4:30 am. The fire spread very rapidly within the community
igniting over 50 % (41/74) of the destroyed structures within three hours after the first reported
ignition. After 6:30 am, the number of new structure ignitions dramatically tapers off from
eight, to one or two per hour. An expanded timeline table can be found in Figure 16.
To bound the estimate of number of homes burning in the community at any one time, the
following assumptions are considered:
- It takes two hours from flaming ignition of a house to no longer burning
- Reports of homes ignited with some flames visible can be used as surrogates for structure
ignition times.
- Reports of homes fully involved can be moved back one hour and used to approximate ignition
in the previous time interval.
- Reports of homes almost completely destroyed can be moved back two hours and used to
approximate ignition in the new time interval.
In Table 3, the rows labeled Estimated Structure Ignitions and Estimated Total Homes Burning
are created using the above assumptions.
Table 3: Timeline of Completely Destroyed Structures
Time window 2:30 3:30 4:30 5:30 6:30 10:30 12:30 Total
am to am to am to am to am to am to pm to
3:30 4:30 5:30 6:30 10:30 12:30 3:15
am am am am am pm pm
Ignited- some flames 3 12 7 2 1 1 0 26
visible
Fully involved 0 10 2 4 2 0 1 19
Almost completely 0 0 0 2 1 0 0 3
destroyed
New burning 3 22 9 8 4 1 1 48
New No longer 0 0 0 0 1 4 5
burning*
Total 3 22 9 8 5 5 1 53
Cumulative Total 3 25 34 42 47 52 53 53
Partial data** 2 7 3 3 15
15Unknown 6
Grand Total 74
Estimated Structure 13 16 12 4 1 1 1 n/a
Flaming Ignitions
Estimated Total 13 29 26 16 5 2 2 n/a
Homes Burning
n/a – not applicable
* Only data available
** Partial data: destroyed structures were not burning at the time of observation
8.2 Fire Spread within The Trails
Different tools were used to document fire spread within The Trails. The extent of burned
vegetation was documented along with the locations the fire jumped a road. Several different
indicators were used to determine the direction that the fire spread. The use of the different
indicators will be explained in this section. In the wildlands, needle freeze as defined below,
directional degree of damage to wildland vegetation and the presence of partly damaged golf
balls were all used to determine directionality of fire spread. In this document, the perimeter of
The Trails is defined by all lots that have direct contact with the wildlands.
Within The Trails, vegetation was burned on both sides of a road, implying spotting across the
road, 21 times. Out of those, 18 were on the perimeter of the community and the remaining three
on interior roads. Out of the 18 road jumps along the perimeter region, 15 were located on lots
with destroyed structures on the perimeter side of the road and 2 out of the remaining 3 were
located at lots adjacent do destroyed structures. Additionally, 10 out the 18 jumps had destroyed
homes on both sides. It is not known if the fire jumps occurred before or after the structures on
the perimeter were burning. That is, it is not clear whether embers generated by burning
vegetation or structures caused the spotting.
The limited data available do show that in the perimeter region, there are two cases were
structures in the interior ignited before structures on the perimeter. It is therefore possible that
the wildland front ignited interior structures 0.2 km (1/8 mile) from the perimeter. This
hypothesis, however, cannot be confirmed because of the limited spatial/temporal resolution of
the currently available data. Flame spread information was obtained from direct observation of
burned vegetation.
Needle freeze information, the process of dehydrated foliage aligning or “freezing” parallel to
the wind direction, was also used to obtain wind direction. 19 Figure 18 illustrates flame spread
and needle freeze around and within The Trails.
A survey of the perimeter of The Trails and valley floor identified a number of golf balls that
were partially embedded in the ground. These were used to obtain general quantitative
information of the direction of the oncoming fire front, or highest heat flux since the surface of
the golf ball facing the direction of the oncoming fire front melted (Figure 19). GPS coordinates
and a compass heading were used to document this information. The yellow arrows in Figure 17
depict the information collected by the geo-located golf balls. The general flame spread
direction information obtained from the golf balls matches the other flame spread information
collected from first responders.
16Figures 17 and 20 illustrate the fire line progression within The Trails. The fire lines,
represented with solid lines in Figure 20, are assembled by joining together the observations at
different times throughout the community. A fire line data point is associated with either
vegetation or a structure burning. The two earliest reports of fire in the community occur at 2:30
in the morning, over an hour before the main fire front arrived from the wildlands at 3:50 am.
Between 2:45 am and 3:10 am, there were three reports of embers on the northern part of the
community. Reports of embers on the Sycamore Creek side (eastern side) were provided at 3:50
am, the same time the main fire front reached The Trails. The fire line then progressed in the
community by moving further on the eastern and western sides where wildland fuel is present
and almost reaches its final configuration by 5:30 am. Based on first responder accounts, the
wind veered from the northeast to the east shortly before 6:00 am. This wind shift arrived at the
Trails, shortly before the Witch fire. It is likely that the shift in wind direction, slowed and
eventually stopped the fire spread within the Trails, however, given the data available, this
cannot be confirmed.
Figure 20 uses four different bins to illustrate the extent of structures burning within the
community. Between 2:30 am and 3:55 am, the Guejito fire ignited structures on the
northwestern part of The Trails, and primarily on the perimeter. Over the next two hours,
between 4:00 am and 5:55 am, the structures burning in the interior reached 500 m (1/3 mile) in
from the perimeter, the furthest into the community. Between 6:00 am and 9:55 am five new
homes are burning on the eastern side of The Trails, with three additional homes burning
throughout the community. Between 10:00 am and 1:30 pm, seven more homes burned.
9.0 Structure Exposure to Fire and Embers
Embers from the wildlands were observed in the community as early as 2:30 am, well before the
main fire front which arrived at 3:50 am. The embers that arrived before the main front
contributed to three structure ignitions or less than 5 % of the total destroyed structures. This is
based on multiple first hand observations from first responders (police and fire) and
homeowners. Additionally, there were six documented separate vegetation ignitions from
embers. Most of the damage to structures and vegetation was done by the main fire front which
arrived approximately one hour later.
The relationship between wildland fuel and the number of destroyed structures in two areas of
The Trails requires consideration. From reference 15, the CALFIRE Witch Incident Fuel Map,
the wildland fuel down slope of Angosto Way (western end of the northern perimeter) consisted
of hardwood/long pole pine trees. Direct observations and discussions with SDFD and home
owners confirmed the presence of significant surface litter. Despite the fact the wildland fire did
not transition to crowning in that location, seven out of nine homes on that road were destroyed.
Additionally, of the two remaining structures, one was actively defended.
The wildland fuel adjacent to Polvera Avenue (north perimeter) varied as a function of location.
On the western side, Angosto Way was at lower elevation than Polvera Avenue and had
significant coverage of hardwood with surface litter. From Olmeda Place (center of northern
perimeter) to the eastern end of the northern perimeter, the fuels consisted of intermixed
hardwoods and brush. At the eastern end of Polvera Avenue there is a rock outcrop, see Figure
1721. This outcrop reduced the local wildland fuel loading and provided a fire break for the
structures to the north (upslope) of it.
On the eastern perimeter of the community, the fuel down slope of Aceituno Street was
primarily brush with one patch of hardwood threes covering approximately one hectare (2.47
acres) and one patch of grass of approximately the same size. The damage to the wildland fuels
was extensive in this area. The structural damage along Aceituno Street was focused on the
wildland side of the street, with seven out of nine homes destroyed compared to two out of nine
on the western (i.e., interior) part. Out of the two surviving structures on the perimeter, both
were damaged and one had been defended.
The exposure to embers within the community varied with location and time. Ember exposure
reached further into the community with time as the main front arrived. The presence of embers
continued to increase as more structures were ignited on the perimeter and within the
community. Unlike on the perimeter of the community where the presence of embers preceded
the main fire front by approximately one hour, in the interior, the data available does not allow
us to differentiate spatially between ignitions by embers or by the fire front.
10.0 Defensive Actions
A number of defensive and fire suppression actions were taken in The Trails before, during and
after the arrival of the Guejito and Witch fires. Documenting defensive actions is essential to
correctly interpreting fire behavior and structure survivability data. Defensive actions are
defined here as actions taken by SDFD (San Diego Fire Department), SDPD (San Diego Police
Department) and homeowners to slow down, redirect, control and extinguish any fires during
the morning of October 22nd, 2007. No attempt will be made to examine SDFD and SDPD
doctrines, policies or decision making. The purpose of this section is to examine the actions
taken in the context of structure survivability. In that context, in order to develop a more
complete understanding of structure ignitions mechanisms and conditions as well as correctly
interpreting structure survivability data, defensive actions must be documented.
A case is presented here to illustrate this. A homeowner was convinced that his house survived
because he turned on the lawn sprinkler system the evening before the fire arrived but was
unaware that a fire engine had spent two hours defending his house. It is not possible to
accurately estimate the total impact of all defensive actions; however, the effects of defensive
actions on damaged structures are clearly seen as 15 out the 16 damaged structures were
defended (see Section 11.0).
The focus of the analysis is on all actions taken shortly before the approach of the Guejito fire
and for approximately the 12 hours after its arrival, or until 3:00 pm Monday afternoon. Figure
22 illustrates the impacts of the identified defensive actions taken at The Trails during that
period. Although fires reignited and new spot fires were started after that period, no homes were
ignited after 1:30 pm and all major fire suppression activity was significantly reduced.
Data collection and technical discussions were conducted with the SDFD, SDPD and The Trails
Home Owners Association. A total of 86 actions were identified at The Trails, between 2:00
am and 3:00 pm Monday October 22nd, however there is no way of knowing how many actions
18were not identified. The actions ranged in complexity and scope from SDFD fire engine crew
defending a house with multiple fire hoses to a homeowner putting out a gutter fire with a
garden hose. Out of the 86 identified actions, 47 actions taken by SDFD and 39 actions were
identified as taken by SDPD or residents of the trails.
Perimeter versus Interior
Out of the 86 identified actions, 32 were on the perimeter and the remaining 53 in the interior of
The Trails. In relative terms, defensive actions were identified on 39 % of perimeter structures
and 32 % of interior structures. Half of the actions taken by SDFD, were on the perimeter and
the remaining half were in the interior of The Trails.
Structures on Fire
There were 11 fire containment actions and 25 defensive actions aimed at saving structures on
fire. San Diego FD, Police and homeowners all contributed to suppressing homes on fire. Out of
the 25 defensive actions taken on structures on fire, 15 were successful yielding a success rate of
60 %. Ten of the defended homes on fires were lost. Additionally, due to the extreme rate of
structure ignitions and the limited number of resources available 53/74 or 70 % of the destroyed
homes were not defended. Lastly, 50 actions were taken on undamaged structures with unknown
influence on structure survivability. Figure 23 illustrates the relationships between the defensive
actions taken and the numbers of structures damaged or destroyed.
10.1 Timeline of actions
Technical discussions with the SDFD identified that a strike team of six engines was at The
Trails at approximately 2:45 am. At 3:00 am, after a short safety brief, the engines took their
positions around The Trails. Many residents were still in The Trails and out of the six engines;
three were involved in resident evacuations. The remaining three engines worked on protecting
residences for the next three hours.
At approximately 6:00 am, the SDFD engines left The Trails to pursue the Guejito fire. SDFD
returned at The Trails at approximately 10:00 am, with at least 7 engines, and remained there,
with different crews, until the event was over well into Tuesday.
SDPD started arriving at the scene at approximately 3:30 am. Over 80 police officers were
involved in the evacuation of residents from the Trails community. The majority of the
evacuation occurred between 4:00 am and 6:00am. At 4:30 am a small fraction of the police
personnel left The Trails. The remaining Police personnel patrolled the neighborhood and
contributed to fire suppression and control, however the defensive actions taken by SDPD after
4:30 am were not documented due to NIST resource limitations and could not be differentiated
from resident defensive actions.
Table 4 contains information on the timeline of defensive actions. Table 5 contains timeline
information on the destroyed homes that were defended. Information on the damaged homes can
be found in section 11.0 of this paper. There were 48 separate San Diego Fire Department
actions identified, including 30 that were taken before 3:15 pm. Additionally, there were 30
separate actions taken by The Trails residents and San Diego PD, 14 of which were identified as
taken before 3:15 pm.
19Table 4: Timeline of Defensive Actions
Time 2:30 am to 6:30 am 6:30 am to 10:30 am 10:30 am to 3:15 pm Total
window Known
SDFD 12 No fire suppression/ 18 30
control actions
SDPD No fire suppression/ All SDPD fire suppression/ control actions started -
control actions after approximately 6:30 am
Resident 7 5 2 14
Out of the 12 homes that were defended when burning, attempts were made to save 8. Out of
these the eight, four were defended when the Guejito fire hit the community, one shortly after
10:00 am and the remaining three between noon and 1:30 pm.
Table 5: Homes that were defended while burning
Time 2:30 3:30 4:30 5:30 6:30 10:30 12:30 Total
window am to am to am to am to am to am to pm to
3:30 4:30 5:30 6:30 10:30 12:30 3:15
am am am am am pm pm
Ignited- 2 out 3 2 out 11 1 of 5 0 of 2 1 of 1 2 of 2 0 8/24
some
flames
visible
Fully 0 1 out 9 0 of 2 0 of 4 0 of 2 0 1 of 1 2/18
involved
Almost 0 0 0 0 of 2 2 of 2 0 0 2/4
completely
destroyed
Defended 2 of 3 3 of 20 1 of 7 0 of 8 3 of 5 2 of 2 1 of 1 12/46
while
burning
Between 3:00 am and 3:00 pm, the San Diego Fire Department saved eight structures, where
ignitions had taken place (see next section) and attempted to save an additional 10 that were lost.
In addition, actions were taken on 11 structures to contain or overhaul the fire (reducing the
potential for secondary fires). Additional actions were also taken that affected fire behavior and
reduced fire severity; however, they were not directly linked to the survival of particular
structures. Such actions included the displacement of flammable materials from the vicinity of
structures and the suppression of spot fires.
11.0 Partly Damaged Structures
Out of the 245 homes within the fire line, 16 homes (7 %) were damaged compared to 74 homes
(30 %) destroyed. Numerous additional properties suffered sometimes extensive smoke damage
that is not addressed here. Burned ornamental vegetation, sometimes extensive, is also not
covered here. The 16 damaged structures addressed here had varying degrees of damage
ranging from burned detached garages to small amounts of burn damage on the main house.
20Identified defensive actions were taken on 15 out of the 16 homes. Table 6 lists type of damages
and the time, if known, and type of detailed defensive action taken. Out of the fifteen defended
structures, eight were defended by SDFD and five by residents or SDPD. For one damaged
structure no defensive actions has been reported to date. Four out of the fourteen defensive
actions occurred before 6:00 am, while the remaining seven occurred after 8 am, and the times
for two defensive actions have not been identified. Figure 24 contains the locations of the
damaged homes; numbers on Figure 24 correspond to House Number in Table 6.
Table 6: Damaged Structures and Defensive Actions
House Damaged area/ Defensive Action (party responsible) Time Action
Number ignition location was Taken
1 decking and railroad Garden hose used to extinguish fires before 6:00 am
ties (resident or SDPD)
2 detached garage and Fire contained in garage (SDFD) 10:00 am to
corner of main house/ noon
unknown
3 detached garage/ Fire contained in garage (SDFD) 10:00 am to
unknown noon
4 Structure addition Water from suppression evident unknown
under construction (SDFD)
5 main structure/ outside Fire contained to outside column after 3:00 pm
column (stucco over (SDFD)
wood)
6 detached garage/ Fire contained in garage (SDFD) 10:00 am to
unknown noon
7 detached structure/ Fire contained in detached structure 7:00 am
unknown (resident or SDPD)
8 main structure/ exposed Garden hose used to extinguish fires 8:00 am
wood beam (resident)
9 decking Garden hose and bucket (resident) 9:00 am
10 main structure/ gutter Garden hose used to extinguish fires 3:00 am to 5:00
(resident) am
11 decking Garden hoses used (unknown) 3:00 am to 6:00
am
12 detached wood shed, Fire contained (SDFD) 3:00 am to 6:00
wood fencing am
13 decking Fire contained to location of origin 3:00 am to 6:00
(SDFD) am
14 roof top solar panels Spot fires extinguished (SDFD) after 10:00 am
15 deck and main structure Fire contained to location of origin unknown
(unknown)
16 main structure/ wood None known -
crate
It is not possible to know how the fire would have progressed if no defensive actions had taken
place. There was only one damaged and unprotected structure within the Trails. The other 15
21You can also read


