Building Wireless Control Applications with XBee and LabVIEW - MDPI
←
→
Page content transcription
If your browser does not render page correctly, please read the page content below
applied
           sciences
Article
Building Wireless Control Applications with XBee
and LabVIEW
Isidro Calvo 1, * , Oscar Barambones 1 , Ander Chouza 1 , Steven Abrahams 2 , Geert Beckers 2 ,
Dieter Slechten 2 and Javier Velasco 3
 1    Department of System Engineering and Automation, Faculty of Engineering Vitoria-Gasteiz,
      University of the Basque Country (UPV/EHU), Nieves Cano 12, 01006 Vitoria-Gasteiz, Spain;
      oscar.barambones@ehu.eus (O.B.); ander.chouza@ehu.eus (A.C.)
 2    Faculteit Industriële Ingenieurswetenschappen, KU Leuven—UHasselt, Agoralaan, B-3590 Diepenbeek,
      Belgium; steven.abrahams@student.uhasselt.be (S.A.); geert_beckers@student.uhasselt.be (G.B.);
      dieter.slechten@uhasselt.be (D.S.)
 3    Fundación Centro de Tecnologías Aeronáuticas (CTA), Juan de la Cierva 1, 01510 Miñano, Spain;
      javier.velasco@ctaero.com
 *    Correspondence: isidro.calvo@ehu.eus

 Received: 10 May 2019; Accepted: 6 June 2019; Published: 11 June 2019

 Abstract: This study analyzed the application of the XBee technology for control applications
 embedded in big machinery. In particular, it presented the control layout, topology, design of
 frames, and error control mechanisms that are required for implementing wireless control networked
 applications. This study was devoted to presenting experimental use cases of wireless control systems
 that help the scientific community to design and implement new control systems. Experimental tests
 were carried out over a Single Input Single Output (SISO) control application to evaluate its use in
 close loop applications. The results of these tests have been discussed in detail. In order to clarify
 the use of XBee in control applications, a high precision positioning application has been presented.
 It involved a piezoelectric actuator that was remotely controlled by means of a Proportional Integral
 (PI) controller, which was implemented in LabVIEW over a NI myRIO platform. Both the sensor and
 the actuators were connected with the NI myRIO by means of the XBee anthenae. The results showed
 that even though XBee technologies present some drawbacks, such as a lower performance when
 compared to wired connections and the influence of interferences, they have the potential to be used
 in some scenarios for non-critical control applications.

 Keywords: XBee; LabVIEW; wireless control; piezoelectric actuator; precise positioning

1. Introduction
     Industry 4.0 is seen as “the integration of complex physical machinery and devices with networked
sensors and software, used to predict, control, and plan for better business and societal outcomes” [1].
The network capabilities are identified as some of the defining characteristics of Cyber Physical
Production Systems (CPPS), which are at the core of Industry 4.0 [2]. In this scenario, new network
technologies are required to connect more devices, such as sensors, actuators, and autonomous
systems in industrial applications. Some technologies such as industrial wireless networks (IWNs) or
Industrial Internet of Things (IIoT) are expected to act as key enablers at smart factories and intelligent
manufacturing systems [3,4]. In particular, IWNs have great potential for monitoring and control tasks
in factory automation, since they might introduce benefits such as—(1) flexibility to easily modify
the layout of the links; (2) connection between monitoring or decision nodes and mobile devices or
parts; and (3) reducing, or even eliminating cabling, which might be expensive and cumbersome. Thus,

Appl. Sci. 2019, 9, 2379; doi:10.3390/app9112379                               www.mdpi.com/journal/applsci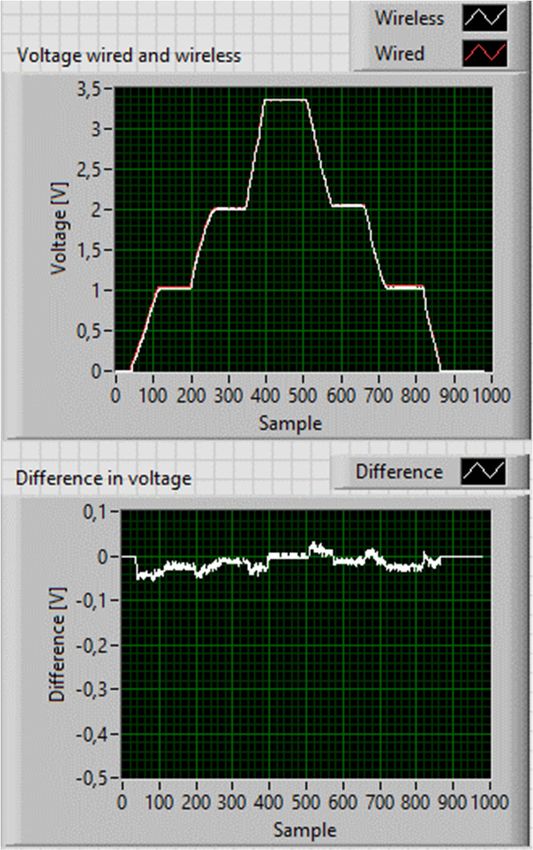
Appl. Sci. 2019, 9, 2379                                                                             2 of 20

the introduction of wireless networks in the industry is expected to improve the productivity and
efficiency of the processes [5].
      Unfortunately, the nature of wireless communications introduces known issues, such as fading,
multipath propagation, shadowing, and interferences, which increase the bit error rate and make
them unpredictable [6]. For this reason, introduction of these technologies in factories face several
challenges, such as—(1) reducing the interferences (caused either by other networks, the industrial
processes or the environment); (2) avoiding congestions to achieve the demanded Quality of Service
(QoS) of applications; and (3) adequately manage the frequency spectrum, which is especially complex
in large factories [5]. In addition, wireless nodes are frequently fed with batteries, which provide
energy for a limited period of time. During the last years, there have been considerable advances
in wireless technologies but these technologies are still far from being mature, especially in critical
applications. In [7] some indicators of their scarce maturity were identified such as weak security,
lack of a dedicated spectrum, lack of a dedicated physical layer, overpromised performance, and poor
scalability. Despite these challenges, wireless technologies are considered to be at a critical point
for deployment in industrial applications since the benefits that they introduce might overcome the
disadvantages. For this reason, more research is needed in order to find out whether the benefits of
using wireless technologies—in certain layouts—overcome the drawbacks, to understand in which
applications they might be introduced, as well as the best practices, especially in critical applications
like those that involve control operations over wireless networks [3,5].
      Wireless technologies are already accepted in non-critical industrial applications, i.e., those
in which a communication failure does not cause severe concerns (for humans) or large economic
losses [7]. The appropriateness of IWNs in different types of applications have been discussed in [5];
essentially, they are regarded as safe for factory and building monitoring, condition alarming, and
supervisory control. For other operations, such as feedback control and safety operations, they are still
often discarded, since they are not considered to provide sufficient reliability, integrity, and security,
when compared to wired technologies. Some authors assume that wireless technologies might not be
adequate for some operations and propose the use of hybrid approaches, i.e., combining both wired
and wireless technologies in order to improve the overall flexibility, efficiency, and performance of the
control systems [8], or using IWNs at control applications with wired backups. IWNs are now starting
to be considered for critical operations. Although factory automation tends to be quite conservative,
the potential benefits of the introduction of IWN, on the one hand, and the arrival of the Industry 4.0
paradigm on the other, are promoting the adoption of wireless technologies in industrial environments.
      There are several wireless technologies available for factory automation applications. The majority
of them work at the Industrial Scientific and Medical (ISM) radio bands, in particular at the 2.4 GHz.
They are typically based on the IEEE 802.15.1 and IEEE 802.15.4 standards, Bluetooth and Zigbee being
the most popular technologies. A deep discussion of several technologies aimed at factory automation
is presented in [9]. Some of the analyzed solutions, e.g., WirelessHART or ISA SP100.11a are built
upon the IEEE 802.15.4 2.4 GHz physical layer, with some modifications at the MAC layer. Other
technologies, like WISA, are built upon the physical layer of the IEEE 802.15.1 standard. Even though
some of these technologies introduce mechanisms to improve coexistence, they contend in the medium
and, consequently, are vulnerable to transmissions carried out by non-coordinated nodes. After all,
most existing industrial wireless solutions are built on general-purpose chips and standards. Some
brand new technologies, known as Wireless High-Performance (Wireless HP) [10], have also emerged.
They aim to provide high performance in data rate, reliability, and latency. Although they are expected
to play an important role in the future, they are still in an incipient stage.
      Designing a Wireless Networked Control System (WNCS) is a complex task and must be approached
in a holistic way. WNCS require a specific QoS, in order to be usable but wireless technologies are
intrinsically unpredictable. Therefore, both the communications QoS and the control algorithm are
intertwined, as discussed in [11–13], for example, finding the optimal sampling period that does not
disturb the control algorithm or deciding how the control algorithm faces message delays and jitter, as well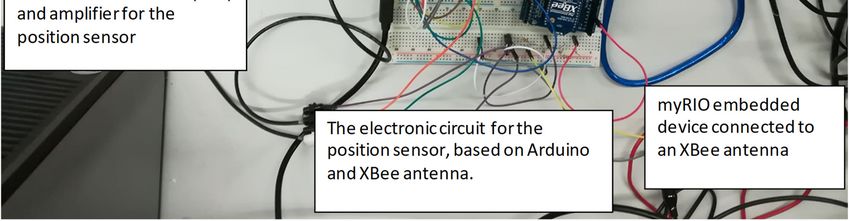
Appl. Sci. 2019, 9, 2379                                                                             3 of 20

as the message dropouts. In addition, the power consumption at the wireless nodes must be considered,
especially in mobile or difficult to access nodes, since they are typically powered with batteries.
     This work focuses on several issues that must be considered for designing and implementing
wireless control schemes, including selecting an adequate sampling period, integrating the communication
technology with the sensors and controllers, designing the format of the frames, identifying loss/corrupted
packages, establishing the error recovery mechanisms, evaluating the delay, and so on. This article
assesses the use of wireless technologies to be introduced in industrial control applications, namely in
control applications embedded in big machinery (up to 5 m). In particular, the control applications are
built with XBee and LabVIEW. On one hand, XBee is used for providing wireless communications
among sensors, controllers, and actuators. XBee devices are based on the IEEE 802.15.4 protocol,
which is known for its low power consumption. Other technologies—especially Bluetooth Low Energy
(BLE)—were also considered for this work, but the authors selected XBee since this is more mature
for low consumption devices, allows more complex topologies that provide higher flexibility, and
allows the use of different operating frequencies (868 MHz, 900 MHz and 2.4 GHz). This might
become an important issue when building control systems in which some components, mainly
sensors, are powered with batteries. On the other hand, LabVIEW is used to implement the controller
that gets the information from the wireless sensors, processes the control algorithm, and sends the
control signal to the wireless actuators. LabVIEW allows the implementation of complex control
algorithms by combining the available modules. In addition, LabVIEW works well at different sampling
periods, provides several alternatives for communication purposes and utilities for saving monitored
information. Several experiments were carried out to compare wireless communication with wired
ones. In particular, the offset and message dropout were analyzed at different distances and sampling
periods, and the message delay was measured. Additionally, the influence of Wi-Fi interferences was
checked. Finally, as a matter of example, wireless technologies were used for the remote control of a
high-precision positioning tool, by means of piezoelectric actuators.
     The layout of this paper is as follows. Section 2 analyzes some related studies on the field of XBee
used in monitoring and control systems. Section 3 describes the control layout, topology, and design of
the frames. Section 4 discusses some tests carried out to validate the layout and technologies used in
this work. Section 5 describes the application of the proposed layout for implementing a high precision
position control application in which communications are implemented with XBee. Finally, Section 6
draws some conclusions.

2. Related Work
     Several standards are used in process-automation applications, ZigBee being one of the most
popular for monitoring applications [9,14]. This technology provides good support when compared
with the Wi-Fi, Bluetooth, and Ultra Wide Band (UWB) standards of the transmission range [15].
In particular, ZigBee networks present some advantages in terms of energy consumption and flexibility,
especially in large networks [14]. In ZigBee networks, there should just be one Coordinator node per
network that is the controller of the whole network, which is irresponsible for choosing the network
channel and organizing it. Since there might be several routes in a ZigBee network, other nodes,
Routers, are responsible for maintaining the infrastructure of the ZigBee network. These nodes do not
gather data or start the message transmission but only transmit data from router to router, or from the
end devices to the coordinator. Finally, end-devices do not route. They are responsible for gathering
data and delivering it to the nearby router or coordinator. All ZigBee nodes are designed to be of
small size, light weight, and low power consumption. The technology allows the connection of up
to 65,535 nodes. ZigBee is suitable for use in monitoring and control applications, such as remote
healthcare, industrial control, fire detection, environmental monitoring, and so on [16]. In this work,
XBee modules were used. These modules support both the original ZigBee network as well as a vendor
proprietary network, known as DigiMesh. In [14], several experiments under different environments
have been designed to evaluate the performance of both networks.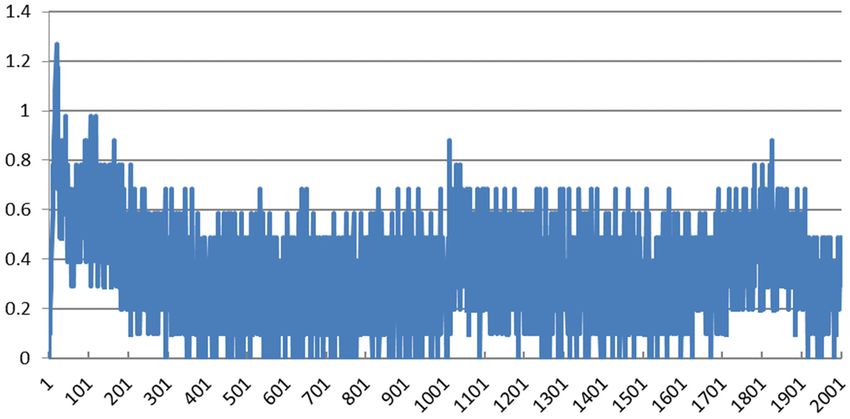
Appl. Sci. 2019, 9, 2379                                                                           4 of 20

      Sometimes different technologies must coexist while using the same bandwidth spectrum, creating
severe interference problems. This is the case for ZigBee and Wi-Fi networks, since they typically work
at the 2.4 GHz ISM band. Some approaches have been analyzed, in order to alleviate this issue, aimed
at achieving a more robust communication [17,18]. The incipient IEEE 802.15.4e standard proposes a
Medium Access Control (MAC) layer that supports collision-free wireless channel access mechanisms
for industrial, commercial, and healthcare applications [19].
      ZigBee technology is mostly used for monitoring applications. Nowadays, some monitoring
applications have been built over ZigBee, as a result of the introduction of smart grids. In [20], the
feasibility of sending messages from intelligent electronic meters to concessionaires, through a ZigBee
network, was analyzed. In [21], the networked control of a photovoltaic based AC Microgrid was
presented. In this work, both CAN and ZigBee were considered. In [22], ZigBee modules were used
for the energy management, efficiency optimization, and metering services, within a smart grid.
      Other applications involved the control of robots or machinery. For example, in [23] the remote
monitoring and controlling of robotic arms by means of ZigBee technology was discussed. In [24],
a model to control a robotic vehicle by means of using hand gestures with an accelerometer was
introduced. In [25], a model predicting a control flocking algorithm aimed at controlling a multi-drone
system was presented. In [26], a network-based discrete proportional integral (PI) control aimed at
controlling a continuous time linear system was designed. There have also been some works in the field
of Industrial IoT. For example, in [27] a monitoring architecture for process automation technologies
with low impact on the sensor nodes aimed at industrial set ups was proposed.

3. Description of the Control Layout
     In this work, star-topology was considered for the WNCS. The controller, implemented at the
central device, received the data from the distributed sensors, executed the control algorithm, and
sent the reference to the distributed actuators, in order to control the plant. The controller device was
implemented with a powerful platform, namely a NI myRIO device. This was a real-time embedded
computer with FPGA capabilities, which was able to execute complex control algorithms by means
of the LabVIEW software. The NI myRIO used a dual-core ARM Cortex-A9 processor and ran the
NI Linux Real-Time OS. The CompactRIO architecture (also manufactured by National Instruments),
followed the same philosophy but it was based on a set of modules. Thus, it might have better
adapted to complex systems, given that it offered scalable computing power and different input and
output modules. In addition, both the NI myRIO and the CompactRIO architecture allowed the
implementation of easy hybrid control systems, i.e., those in which remote devices are connected by
means of both wired and wireless links. For the wireless communication with sensors and actuators,
the XBee technology was chosen. National Instruments and several other companies designed the NI
VISA protocol, aimed at easing the communication with different devices. In particular, the NI VISA
protocol allowed the connection between the XBee antenna located at the control computer and the
LabVIEW application that executed the control algorithm.
     In this work, the authors aimed at carefully analyzing the behavior of control applications that
followed the layout shown in Figure 1. For this purpose, the authors analyzed a basic single input
single output (SISO) closed loop control application with (1) one sensor, (2) the control algorithm
(executed at the computer), and (3) one actuator. Both the communications and the control algorithm
were especially intertwined in the design of WNCS, consequently, the introduction of more sensors
and actuators should be adequately scheduled, in order to manage the communication bandwidth
and reduce the impact of collisions on the QoS performance. One possible approach would be the
introduction of time-triggered approaches. Several TDMA scheduling algorithms for the wireless
sensor networks have been discussed in [28].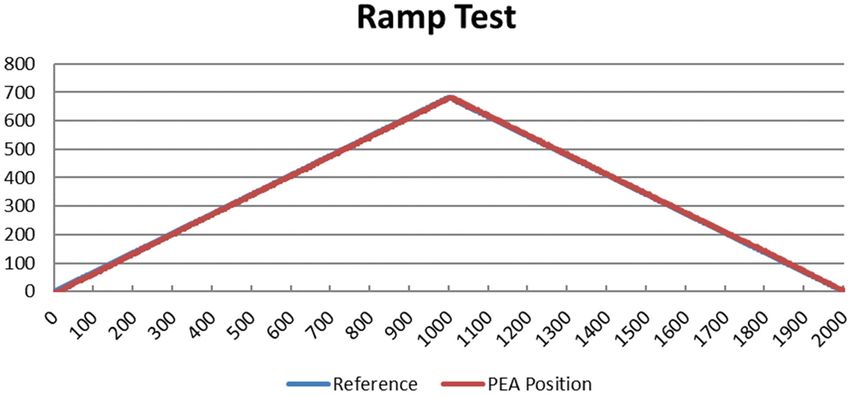
LabVIEW). The computer was connected to the XBee module, configured as the XBee Coordinator,
by means of a USB link. The LabVIEW VISA device has proven to be the simplest alternative to
manage the data received/sent by the XBee module. The control algorithm generated the signal to be
serialized and sent to the actuator, configured as an XBee End Device. Again, the5 ofuse
Appl. Sci. 2019, 9, 2379 20
of a
microcontroller on the actuator’s side might be necessary for executing F(z).
Figure 1. Layout
Figure ofofaawireless
1. Layout networked
wireless networked control
control system.
system.
Figure 1 shows the sensor connected to the physical system, connected to an XBee module like
XBee modules could be programmed in two modes—the AT mode and the API. The latest
the XBee End Device. The use of a microcontroller allowed the execution of any pre-processing
provided a higher
algorithm for theflexibility,
acquired value since it allowed
of the a formatting
sensor (represented as H(z) ofinthe
Figureframes,
1). Thetomeasured
better adapt
values to the
applications. However,
were serialized anditsent
required
to the NIa lower
myRIO programming
device (which level,
ran the since thealgorithm
control programsinmust dig into the
LabVIEW).
framesTheto computer
get the information.
was connected Regardless, this was
to the XBee module, considered
configured the best
as the XBee approach
Coordinator, for this
by means of akind of
applications and, consequently, it was used at the sensor, controller, and actuator, to define the
USB link. The LabVIEW VISA device has proven to be the simplest alternative to manage the data
received/sent
application protocolby the
overXBee module.
XBee. The control
Afterwards, thealgorithm
format generated
of the API theframes
signal towasbe serialized and sent API
briefly described.
to the actuator, configured as an XBee End Device. Again, the use of a microcontroller on the actuator’s
frames were divided into four sections—(1) start delimiter, all frames started with the same byte,
side might be necessary for executing F(z).
0x7E; (2) length of the frame—the next two bytes; (3) API-specific Structure—which followed the
XBee modules could be programmed in two modes—the AT mode and the API. The latest provided
structure of the
a higher application
flexibility, protocol
since it allowed used, and could
a formatting of the contain
frames, to asbetter
many bytes
adapt as designed;
to the applications. and (4)
checksum—which was the
However, it required calculated
a lower checksum
programming level,ofsince
the the
bytes in the must
programs API-specific
dig into thestructure.
frames to get
Asthea information.
matter of exampleRegardless,forthis
thewas
sake of describing
considered the bestthe structure
approach of the
for this kind frames, Figure and,
of applications 2 shows a
consequently, it was used at the sensor, controller, and actuator, to define
typical frame. The whole size of the frame was 12 Bytes. The API-specific structure, represented by the application protocol
overdefines
red lines, XBee. Afterwards, the format
the application of the API
protocol forframes was briefly described.
sending/receiving API frames
the values werethe
to/from divided
sensors or
into four sections—(1) start delimiter, all frames started with the same byte, 0x7E; (2) length of the
actuators. This frame has been specifically designed for control applications similar to the one
frame—the next two bytes; (3) API-specific Structure—which followed the structure of the application
presented in this work. In the example frame shown in Figure 2, the API-specific structure included
protocol used, and could contain as many bytes as designed; and (4) checksum—which was the
the following
calculated bytes—(Byte
checksum of the 4) frame
bytes intype, in which 0x10
the API-specific meant that the frame was a Zigbee Transmit
structure.
Request; (5) Asframe
a matterID ofwas 0x00, for
example which disabled
the sake the response
of describing frames;
the structure of (6–7) 16 bits
the frames, for the
Figure destination
2 shows
address—in
a typical this caseThe
frame. 0x2222—divided
whole size of theinto frame itswas
MSB 12 and
Bytes.LSB;
The (8) byte for structure,
API-specific options, represented
in this case 0x01,
which disabled the retries; (9–10) 16 bits for the data sent and the reading of a sensorthe
by red lines, defines the application protocol for sending/receiving the values to/from (insensors
the example
the 0x10F1 value was sent); and (11) sequence number, which was used to detect whether one
or actuators. This frame has been specifically designed for control applications similar to the all frames
presented in this work. In the example frame shown in Figure 2, the API-specific structure included
were delivered (in the example this was 0x01), since this was the first frame sent. Finally, in byte 12
the following bytes—(Byte 4) frame type, in which 0x10 meant that the frame was a Zigbee Transmit
the checksum of the message was included. This information was used for detecting whether the
Request; (5) frame ID was 0x00, which disabled the response frames; (6–7) 16 bits for the destination
received messagethis
address—in wascasecorrupted. In suchinto
0x2222—divided a case, the message
its MSB and LSB; (8)wasbytediscarded.
for options, in this case 0x01,
which disabled the retries; (9–10) 16 bits for the data sent and the reading of a sensor (in the example
the 0x10F1 value was sent); and (11) sequence number, which was used to detect whether all frames
were delivered (in the example this was 0x01), since this was the first frame sent. Finally, in byte 12 the
checksum of the message was included. This information was used for detecting whether the received
message was corrupted. In such a case, the message was discarded.
In order to connect any device (sensor or actuator), the precision of the ADC (Analog-to-Digital
Converter) at the XBee module was analyzed. The results have been presented in the next section.
address—in this case 0x2222—divided into its MSB and LSB; (8) byte for options, in this case 0x01,
which disabled the retries; (9–10) 16 bits for the data sent and the reading of a sensor (in the example
the 0x10F1 value was sent); and (11) sequence number, which was used to detect whether all frames
were delivered (in the example this was 0x01), since this was the first frame sent. Finally, in byte 12
the checksum
Appl.                of the message was included. This information was used for detecting whether
      Sci. 2019, 9, 2379                                                                            6 ofthe
                                                                                                         20
received message was corrupted. In such a case, the message was discarded.

                        Figure 2. Example of a typical XBee API transmission frame.

4. Experimental Tests
     In order to evaluate whether XBee technology was suitable for control applications, several
experiments at different sampling periods and distances were designed to compare wireless and
wired communications. First, the Analog-to-Digital Converter (ADC) included in the XBee device was
compared with a National Instruments myDAQ USB-6008 board and an Arduino Uno board. Second,
the offset and message dropout were analyzed for different distances and sampling periods. Third, the
message delay was analyzed at different distances and sample periods. Finally, the influence of Wi-Fi
interferences in the XBee transmission was checked. This evaluation aimed to shed some light into the
application of this technology in control applications.
     The test set up was aimed at analyzing the performance of wireless communications in control
applications. The experimental layout for a Single Input Single Output (SISO) Control System with
one sensor actuator and controller has been reproduced in Figure 1. The NI VISA device was used
to establish the communication between the XBee and the LabVIEW application. Just for evaluation
purposes, one potentiometer was used as the generic analog sensor and one small DC motor was used a
generic actuator. The sensor module, implemented by means of an Arduino board, sampled the values
of the sensor and sent them to the XBee antenna. For the actuator, an Arduino was also connected to a
XBee module (by means of an Arduino XBee shield). This module received the control signal generated
by the LabVIEW control algorithm. The DC motor was connected to one of the PWM Arduino board
pins. The XBee frames followed the format defined in the previous section. In parallel to the wireless
communication, a NI myDAQ USB-6008 acquisition board was used to compare wireless and wired
communications. This was a low cost board designed by National Instruments and, consequently, had
very good compatibility with LabVIEW, by means of ad hoc libraries and drivers. The NI myDAQ
USB-6008 also provided higher resolution (12 bits), when compared to the XBee and Arduino ADCs
(10 bits). Due to its higher resolution and lower bit error rate, it was considered to be the reference value
for the tests carried out. The following subsections describe these experiments and briefly discusses
the results.

4.1. Comparing Different ADCs for XBee Modules
      This test was aimed at designing the interface between sensors and XBee modules. In particular,
this subsection analyzed the influence of the ADC in the process of digitalizing the sensor measures.
For this purpose, three different ADCs were compared—(1) the ADC included at the XBee module;
(2) an Arduino Uno connected in series to an XBee module; and (3) a specific acquisition board, namely
the NI myDAQ USB-6008, wired to the computer by means of a USB link. With regards to the resolution,
the XBee ADC represented the measured analog voltage into a 10-bit value (same as that of Arduino
Uno), and finally, the NI myDAQ USB-6008, which had a higher resolution was taken as the reference
value. The values measured from the three were compared and transmitted to a computer using
LabVIEW. These tests were done at a distance of 0.5 m, using a sample period of 100 milliseconds.
      The comparison between the XBee ADC and the NI myDAQ proved that the behavior of the XBee
ADC was quite limited at low voltages. In particular, it was shown that the XBee ADC introduced an
offset of around 0.4 Volts when 0 volts were measured. The higher the voltage, the lower the difference
between the values obtained from the XBee ADC and the NI myDAQ. Due to these poor results, the
Appl. Sci. 2019, 9, 2379 7 of 20
authors introduced an Arduino Uno in order to digitalize the signal of the sensor. These values were
compared with those acquired by the myDAQ board. In Figure 3 (left panel), the wireless signal
obtained from the ADC at the XBee is compared with the wired signal, measured by the myDAQ.
Appl. Sci. 2019, 9, x FOR PEER REVIEW 7 of 21
The difference could reach up to 0.4 volts. Figure 3 (right panel) compared the wireless signal (measured
by the Arduino Uno connected to the XBee module) with the wired signal received from the myDAQ.
the wired signal received from the myDAQ. It could be noticed that, in this case, the difference
It could be noticed that, in this case, the difference between both signals was considerably smaller.
between both signals was considerably smaller. For this reason, the authors connected the sensor
For this reason, the authors connected the sensor using an Arduino Uno and an XBee module.
using an Arduino Uno and an XBee module.
Figure 3. Comparison
Figure 3. Comparison of
of the Wireless (XBee)
the Wireless (XBee) and
and Wired
Wired connections
connections (NI
(NI myDAQ
myDAQ USB-6008).
USB-6008). Left
Left
Top: XBee ADC (white) versus the NI myDAQ (red) signals. Left Bottom: Difference between
Top: XBee ADC (white) versus the NI myDAQ (red) signals. Left Bottom: Difference between both both
signals.
signals. Right
Right Top:
Top: Comparison XBee ++ Arduino
Comparison XBee Arduino Uno
Uno (white)
(white) versus
versus NI
NI myDAQ
myDAQ (red).
(red). Right
Right Bottom:
Bottom:
Difference between both
Difference between both signals.
signals. (Tests
(Tests at
at 0.5
0.5 m
m and
and sampling
sampling atat 100
100 ms).
ms).
4.2. Comparing
4.2. Comparing Offset
Offset and
and Message
Message Dropout
Dropout at
at Different
Different Distances
Distances
The second
The second experiment
experiment waswas aimed
aimed atat investigating
investigating thethe influence
influence of—(1)
of—(1) the
the sample
sample period and
period and
(2)
(2) the distance between
the distance between thethe computer
computer andand the
the sensor/actuator,
sensor/actuator, in in wireless
wireless connections.
connections. In Inparticular,
particular,
the dropout rate and the difference between the wired and the wireless measured
the dropout rate and the difference between the wired and the wireless measured values values were analyzed.
were
In this testIn
analyzed. anthis
Arduino Uno
test an was connected
Arduino Uno wasinconnected
series to an in XBee
seriesmodule,
to an XBeeso that the Arduino
module, so thatUno the
acquired the value from the sensor, serialized it to the XBee module, which then
Arduino Uno acquired the value from the sensor, serialized it to the XBee module, which then sent it sent it to the
LabVIEW
to application.
the LabVIEW application.
For this
For this purpose,
purpose, several
several experiments were carried
experiments were carried outout in
in which
which both
both characteristics
characteristics (sample
(sample
period and distance) were modified. More specifically, sample periods of 30,
period and distance) were modified. More specifically, sample periods of 30, 50, and 100 50, and 100 milliseconds
were considered.
milliseconds wereRegarding
considered. distance, sincedistance,
Regarding this work wasthis
since aimed at evaluating
work was aimedthe at introduction
evaluating the of
XBee modulesofinXBee
introduction machinery
modulesof up
in to 5 m, the distances
machinery of up to ranged
5 m, thefrom 0 (veryranged
distances short distance),
from 0 (very0.5, 2,short
and
5 m. The tests
distance), consisted
0.5, 2, and 5 m. of periodically sendingofsensor
The tests consisted values at
periodically different
sending frequencies
sensor values (namely,
at different30,
50, and 100 milliseconds)
frequencies (namely, 30, 50,andand
varying the distance between
100 milliseconds) and varyingcomputer and nodes,
the distance at either
between 0 m (very
computer and
nodes, at either 0 m (very close), 0.5 m, 2m , and up to 5 m. The duration of the test was always 30 s.
The following data were analyzed for this test: (1) the message dropout rate, which was obtained
from the frame checksum failures, as well as bad sequence numbers, see Figure 2; (2) the average
difference between the wired and wireless values received for every value of frequency and
distance; and (3) the standard deviation of the difference between the wired and wireless signals.
Appl. Sci. 2019, 9, 2379                                                                                         8 of 20

close), 0.5 m, 2m, and up to 5 m. The duration of the test was always 30 s. The following data were
analyzed for this test: (1) the message dropout rate, which was obtained from the frame checksum
failures, as well as bad sequence numbers, see Figure 2; (2) the average difference between the wired
and wireless values received for every value of frequency and distance; and (3) the standard deviation
of the difference between the wired and wireless signals. Table 1 summarizes the results obtained from
the tests carried out. For example, Figure 4 shows the test for a sampling rate of 30 milliseconds, at a
distance of 0.5 m. The duration of the test was 30 s.

                 Table 1. Summary of the experiment results at different frequencies and distances.

                    Distance (m)                 5                  2                0.5                 0
   Test
              Sampling Period (ms)        30    50    100    30    50    100   30    50    100   30     50       100
Appl. Sci.Message
          2019, 9, x dropout
                     FOR PEER(%)
                               REVIEW    1.3    1.2    1.3   1.8   2.1   2.2   0.9   2.3   1.7   1.6    2.2     8 2.3
                                                                                                                  of 21
       Average Diff. total (mV)          −9.9 −32     −40    −14   −13   −18   −14   −13   −13   −14    −16      −12
Table 1 summarizes the results obtained from the tests carried out. For example, Figure 4 shows the
      Standard deviation (mV)        16   31    40    19    19    25   16   14    14    17    19     16
test for a sampling rate of 30 milliseconds, at a distance of 0.5 m. The duration of the test was 30 s.

       Figure 4. Comparison
       Figure 4. Comparison between
                             between XBee
                                       XBee ++ Arduino
                                               Arduino Uno
                                                       Uno (white)
                                                           (white) and
                                                                   and NI
                                                                       NI myDAQ
                                                                          myDAQ (red)
                                                                                (red) signals.
                                                                                      signals. (Test
                                                                                               (Test at
                                                                                                     at
       0.5 m and sampling at 30 milliseconds).
       0.5 m and sampling at 30 milliseconds).

     The first thing to notice
                         notice in
                                in Table 1 is that the message dropout
                                                                  dropout measured
                                                                            measured averages
                                                                                        averages below
                                                                                                   below 2%.
                                                                                                           2%.
Additionally, no correlation was found between message dropout and distance      distance (at least for the
considered
considered distances)
            distances) and the sampling periods. The     The authors
                                                             authors assumed
                                                                      assumed that
                                                                                that the
                                                                                     the high
                                                                                          high values
                                                                                                values at the
standard deviation
          deviation were
                      were mostly
                            mostly due
                                     due to
                                          to the
                                             the effect of spurious interferences
                                                                    interferences during
                                                                                  during thethe tests,
                                                                                                tests, as they
were performed in a University Laboratory
                                    Laboratory that
                                                 that experienced
                                                      experienced intensive
                                                                   intensive Wi–Fi
                                                                              Wi-Fi traffic (in a subsequent
subsection,
subsection, the
             the effect of Wi–Fi  interferences is
                           Wi-Fi interferences   is confirmed).
                                                    confirmed). The most remarkable outliers occurred at
five meters, where the effect of
                               of the
                                   the interferences
                                       interferences was
                                                      was expected
                                                           expected to
                                                                     to be
                                                                        be more
                                                                           more noticeable.
                                                                                noticeable.

                 Table 1. Summary of the experiment results at different frequencies and distances.

Test       Distance (m)                        5                    2                0,5                   0
       Sampling Period (ms)             30     50     100    30    50    100   30    50    100    30      50       100
     Message dropout (%)                1.3    1.2    1.3    1.8   2.1   2.2   0.9   2.3   1.7    1.6     2.2      2.3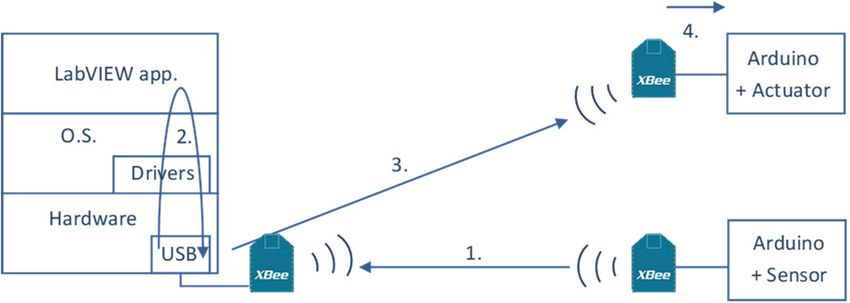
Appl. Sci. 2019, 9, 2379 9 of 20
4.3. Message Delay
The third experiment was aimed at measuring the full message delay between sending a signal
from the sensor to the computer and its reception at the actuator (see Figure 5). The time difference
between sending and receiving was measured using an oscilloscope. These tests were also carried out
at several distances—0 m (very close), 0.5 m, 2 m, and up to 5 m. In order to compare the message
Appl. Sci.delay,
2019, a9,wired
x FORconnection was also used as a reference.
PEER REVIEW 9 of 21
Figure 5. Layout
Figure 5. Layoutfor
formeasuring themessage
measuring the message delay.
delay.
The message
The message delay
delay waswas measured ten
measured ten times
timesforfor
thethe
distances specified
distances above. above.
specified Table 2 presents
Table 2the
presents
mean and standard deviation for the message delay at several distances. Note that the message delay
the mean and standard deviation for the message delay at several distances. Note that the message
measured was a two-way delay which involved all steps shown in Figure 5.
delay measured was a two-way delay which involved all steps shown in Figure 5.
Table 2. Message delay for 9600 bps.
Table 2. Message delay for 9600 bps.
Test Distance (m) Wired 0 0.5 2 5
TestMean
Distance
(ms) (m) Wired
3 45.9 0 0.5
45.5 2
46.2 547.2
Mean
Std. Dev.(ms) 0.603 45.9
3.93 45.5
5.25 46.2
4.92 47.2
6.39
Std. Dev. 0.60 3.93 5.25 4.92 6.39
Two conclusions could be drawn from this experiment—(1) the distance had a reduced impact on
Two conclusions
the delay (at least could
up to 5bem),drawn
and (2)from this was
the delay experiment—(1) the distance
significantly lower in the wired hadconnection,
a reducedasimpact
expected. For this experiment, the XBee modules were configured to transmit
on the delay (at least up to 5 m), and (2) the delay was significantly lower in the wired the data at a baud-rate of
connection, as
9600 bits per second. Considering that the frames were around 100 bits, every
expected. For this experiment, the XBee modules were configured to transmit the data at a baud-rateconnection at 9600 bps
took around 10 ms. There were several serial connections to close the loop (see Figure 5)—(1) from the
of 9,600 bits per second. Considering that the frames were around 100 bits, every connection at 9,600
sensor XBee to the XBee at the NI myRIO; (2) from the XBee to the LabVIEW application and back
bps took around 10 ms. There were several serial connections to close the loop (see Figure 5)—(1)
to the XBee; (3) from the XBee at the NI myRIO to the actuator XBee; and (4) from the actuator XBee
from the sensor
to the ArduinoXBee to This
Uno. the XBee at explained
could be the NI myRIO; (2) from
by the mean the XBee
time (which wasto the LabVIEW
around application
46 milliseconds)
and back
and to the XBee;
a higher standard(3)deviation,
from thesince
XBee at were
there the NI myRIO
several stagestoinvolved.
the actuator
To reduce XBee; and needed
the time (4) from the
actuator XBee to the
to translate thedata
Arduino Uno. This
into a frame, could
a higher be explained
baud-rate could bebyused.theAmean
second time
test (which
was donewas around 46
at three
different baud-rates at a very short distance. The obtained results are shown in
milliseconds) and a higher standard deviation, since there were several stages involved. To reduce Table 3.
the time needed to translate the data into a frame, a higher baud-rate could be used. A second test
Table 3. Message delay at different baud-rates.
was done at three different baud-rates at a very short distance. The obtained results are shown in
Table 3. Test Speed (bps) 9600 38,400 57,600
Mean 45.9 24.1 22.6
Table Std.
3. Message
Dev. delay at different
3.93 4.07 baud-rates.
3.95
Test Speed (bps) 9600 38,400 57,600
The table shows the influence of the communication speed configuration (in bits per second) at the
Mean 45.9 24.1 22.6
delay. For example, at a baud-rate of 38,400, the time to send one frame would be considerably shorter
and it would have a big impactStd. Dev.
on the closed loop 3.93 4.07 However,
communication. 3.95 the authors expected a
higher dropout rate. If the time used by the computer to process the data was considered to be the
The table
same shows
for all the influence
tests (regardless ofcommunication
of the the communication speed
speed), the configuration
following four stages(in bitsinvolved:
were per second) at
the delay. For example, at a baud-rate of 38,400, the time to send one frame would be considerably
shorter and it would have a big impact on the closed loop communication. However, the authors
expected a higher dropout rate. If the time used by the computer to process the data was considered
to be the same for all tests (regardless of the communication speed), the following four stages were
involved: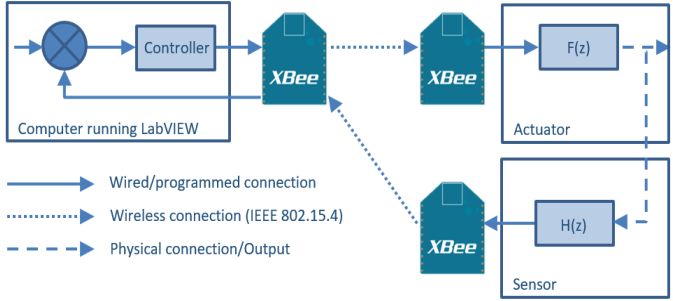
Appl. Sci. 2019, 9, 2379                                                                                  10 of 20
Appl. Sci. 2019, 9, x FOR PEER REVIEW                                                                    10 of 21

1. The The influence    of Wi–Fi
            communication           interferences
                               between    the XBeeover  ZigBee
                                                    module       is well-known,
                                                            at the  sensor and thesince  both
                                                                                      XBee     technologies
                                                                                            module           work
                                                                                                    at the control
at thecomputer.
         radio band Theofframes
                          2.4 GHz.    Several works,
                                  considered          such
                                               had a 100   assize.
                                                         bits   [29,34], provide a detailed analysis about this
topic.
2.      In particular,   in [34] it has been  shown  that ZigBee
       At the control computer, the message was received and        might  be severely
                                                                        passed          interfered by
                                                                                to the application.  AsWi–Fi,
                                                                                                        shown and
                                                                                                                in
they Figure
       proposed     a theoretical   model   that explained the   phenomenon.
               5, the influence of several components could introduce jitter.    In  [34], a safe distance of 8 m
between
3.     The both   technologies,
            generated    frame was hasserialized
                                       been recommended,      to reduce
                                                 and immediately         interferences.
                                                                     transmitted   by the XBee.
      In the present work, we were devoted to simply confirming the influence of interferences in
4.     After the entire frame was received by the actuator XBee, the reference was extracted from the
communication. For this reason, the tests were carried out in a clearly unfavorable scenario, to
       frame and sent to the Arduino.
experimentally measure the ill effects of the interferences between both technologies. The proposed
test Interferences
4.4. consisted onwith setting the two antennas (ZigBee and Wi–Fi) close to each other, at a distance of 30
                          Wi-Fi
cm, and analyzing the experimental results. In addition, large files were downloaded on the
      The influence of Wi-Fi interferences over ZigBee is well-known, since both technologies work at
computer executing the application, while the XBee application was working. The results were
the radio band of 2.4 GHz. Several works, such as [29,30], provide a detailed analysis about this topic.
analyzed to check whether the dropout increased due to the interference.
In particular, in [30] it has been shown that ZigBee might be severely interfered by Wi-Fi, and they
      A high-resolution video was downloaded by means of the 802.11n interface, while at the same
proposed a theoretical model that explained the phenomenon. In [30], a safe distance of 8 m between
time, the controller was acquiring data from the sensor by means of XBee. The authors
both technologies, has been recommended, to reduce interferences.
experimentally measured the download Wi–Fi speed at the computer which, on average, was of 4.9
      In the present work, we were devoted to simply confirming the influence of interferences in
Mbps (see Figure 6). During this test, the message dropouts were checked and saved in one file for
communication. For this reason, the tests were carried out in a clearly unfavorable scenario, to
off-line analysis.
experimentally measure the ill effects of the interferences between both technologies. The proposed
      The authors analyzed the behavior of the XBee communication at the Wi–Fi speed peaks and
test consisted on setting the two antennas (ZigBee and Wi-Fi) close to each other, at a distance of 30 cm,
observed that at the peaks, up to the 60% of the messages were not received by the XBee on the
and analyzing the experimental results. In addition, large files were downloaded on the computer
computer (note that this test was clearly very unfavorable, since the authors maximized all the
executing the application, while the XBee application was working. The results were analyzed to check
drawbacks, short distance, high traffic, etc.). This value went far beyond the dropout data obtained
whether the dropout increased due to the interference.
in Test 2. Obviously, this significant dropout was caused by interferences, since both XBee and Wi–Fi
      A high-resolution video was downloaded by means of the 802.11n interface, while at the same
work at 2.4 GHz.
time, the controller was acquiring data from the sensor by means of XBee. The authors experimentally
      Interferences caused by Wi–Fi at 2.4 GHz could be avoided by either using the XBee modules in
measured the download Wi-Fi speed at the computer which, on average, was of 4.9 Mbps (see Figure 6).
a Wi–Fi free zone or using the XBee modules that operate in a different frequency (some XBee
During this test, the message dropouts were checked and saved in one file for off-line analysis.
devices work at 868 MHz or 900 MHz).

                                 Figure 6. Wi–Fi download speed
                                           Wi-Fi download speed during
                                                                during the
                                                                       the test.
                                                                            test.

      The authors analyzed the behavior of the XBee communication at the Wi-Fi speed peaks and
4.5. Discussion
observed that at the peaks, up to the 60% of the messages were not received by the XBee on the computer
      This section analyzes the use of XBee wireless technology for control applications programmed
(note that this test was clearly very unfavorable, since the authors maximized all the drawbacks, short
with LabVIEW. A Single Input Single Output (SISO) system was considered, in which both the
distance, high traffic, etc.). This value went far beyond the dropout data obtained in Test 2. Obviously,
sensor and actuator were connected wirelessly, by means of XBee modules. Several experimental
this significant dropout was caused by interferences, since both XBee and Wi-Fi work at 2.4 GHz.
tests were carried out in order to explore the use of these technologies. Namely, the experiments
carried out involved analyzing—(1) the performance of the Analog-to-Digital Converter (ADC)
Appl. Sci. 2019, 9, 2379 11 of 20
Interferences caused by Wi-Fi at 2.4 GHz could be avoided by either using the XBee modules in a
Wi-Fi free zone or using the XBee modules that operate in a different frequency (some XBee devices
work at 868 MHz or 900 MHz).
4.5. Discussion
This section analyzes the use of XBee wireless technology for control applications programmed
with LabVIEW. A Single Input Single Output (SISO) system was considered, in which both the sensor
and actuator were connected wirelessly, by means of XBee modules. Several experimental tests were
carried out in order to explore the use of these technologies. Namely, the experiments carried out
involved analyzing—(1) the performance of the Analog-to-Digital Converter (ADC) included at the
XBee device; (2) the offset and message dropout for different distances and sampling periods; (3) the
message delay at different distances and sample periods; and (4) the presence of Wi-Fi interferences in
a very unfavorable scenario. The results of these tests should show if the combination of XBee and
LabVIEW was adequate to building some non-critical WNCS
The first conclusion drawn from these experiments was that the dropout rate was not so high,
for the measured distances (up to 5 m) and sampling periods (up to 30 ms). For the tests carried
out, the dropout was always around 2%. During the tests, it was also proven that the flexibility of
using XBee antennae was very high, since wireless technologies allow to easily move the devices, at
different distances.
Nonetheless, there were also weak points. A higher delay was created. This delay was very
sensitive to the baud-rate of the XBee configuration. However, the authors believe that a higher speed
could increase the dropout. Additionally, it was confirmed that Wi-Fi might cause serious problems of
interference with XBee, since both were using the 2.4 GHz band. For this reason, the authors evaluated
the use of XBee modules that work at different frequency bands, such as 868 MHz or 900 MHz. Another
finding was that the ADC used by the XBee module did not provide good results. It was improved
by connecting an Arduino Uno board for sampling the signal. However, for some high precision
applications, this approach could still be poor. For these cases, more precise technologies should
be analyzed.
In general, it could be concluded that for non-critical systems or for monitoring purposes only, the
analyzed combination could have become a viable alternative, even though it had some limitations.
However, for more critical applications several factors must be improved, either by more precisely
tuning the XBee configuration and, if possible, reducing the environmental interferences.
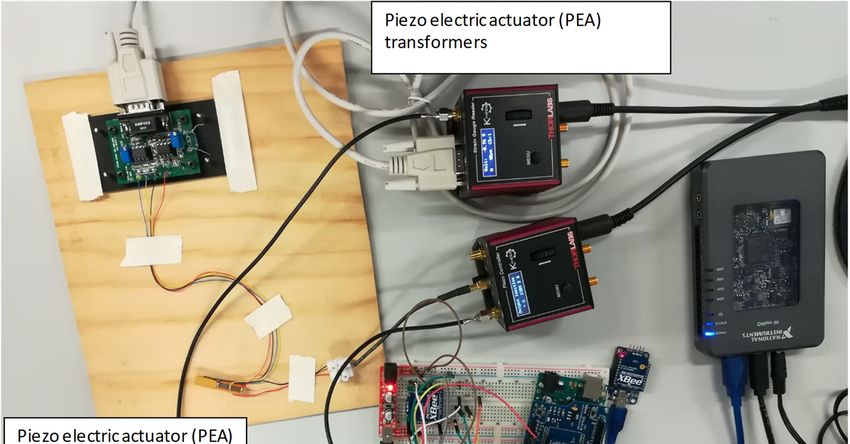
5. Case Study
This section analyzed the performance of the XBee communications in a particular control application.
Namely, a high precision positioning application, based on a piezoelectric actuator. Piezoelectric actuators
(PEAs) are widely used in a variety of applications where ultrahigh precision is required [31]. They are
frequently introduced at micro-positioning applications, due to their high resolution (in the range of
nanometers), large blocking force (hundreds of N), high stiffness, large bandwidth, and fast response.
Unfortunately, the biggest problem of piezo-driven stages comes from the nonlinearities in the PEA,
attributed to hysteresis, creep, and drift. These problems could be addressed by selecting appropriate
controllers aimed at compensating these effects [32]. In this work, the authors focused on evaluating the
performance of wireless communications (based on XBee technology) for avoiding the wiring between the
controller, executed in a NI myRIO computing platform, and a commercial PEA. Since the purpose of this
work was to test wireless communications in control applications, a well-established control algorithm
was implemented at the NI myRIO, namely a proportional-integral (PI) controller. However, the authors
were aware that the performance of this controller could be improved [32]. The presented tests are aimed
at evaluating the performance of XBee communications in wireless control networked applications.Appl. Sci. 2019, 9, x FOR PEER REVIEW 12 of 21
Appl. Sci. 2019, 9, 2379 12 of 20
5.1. Materials and Layout
The plant
5.1. Materials and used
Layoutin these experiments was a PEA, namely a PK4FYC2, supplied by Thorlabs,
which provided a 38.5 µm range. Since a PEA is a high precision, non-linear actuator, the authors
The to
decided plant
useused in these experiments
the auxiliary modules provided was a PEA,
by thenamely
vendor.a PK4FYC2,
The PEA was supplied by Thorlabs,
actuated which
with a 0–150 V
provided a 38.5 µm range. Since a PEA is a high precision, non-linear
voltage by means of an open-loop piezo driver (Thorlabs Ref. KPZ101), which converted the input actuator, the authors decided to
use
rangetheof auxiliary
the driver modules(0–10provided
V) into by thetheactuator
vendor. range
The PEA was V).
(0–150 actuated with a 0–150
For close-loop V voltage bya
applications,
means of an open-loop piezo driver (Thorlabs Ref. KPZ101),
pre-amplification circuit was needed, for this purpose the Thorlabs Ref. AMP002 pre-ampwhich converted the input range circuit
of the
driver (0–10 V) into the actuator range (0–150 V). For close-loop applications,
was also used. Due to the short range of the actuator (0–38.5 µm), the displacement was measured by a pre-amplification circuit
was
means needed,
of a high for precision
this purpose strainthegauge
Thorlabs Ref. AMP002
integrated pre-amp
on the PEA. Thus, circuit was also
the position ofused. Due towas
the actuator the
short range of the actuator (0–38.5 µm), the displacement was measured
measured by means of a strain gauge reader (Thorlabs Ref. KSG101) that accurately delivered the by means of a high precision
strain
position.gauge integrated on the PEA. Thus, the position of the actuator was measured by means of a
strainXBee
gauge reader (Thorlabs
communication wasRef.used KSG101)
to connectthatthe
accurately delivered
PEA actuator withthetheposition.
controller. More precisely,
XBee communication was used to connect
an XBee module was connected to an Arduino Uno, which was used both the PEA actuator with the for
controller.
readingMore precisely,
the position of
an
theXBee
PEA module
and setting was connected
the position to reference
an Arduino of Uno, which
the piezo was used
driver. The both for reading between
communication the position
the
of the PEA
control and setting
algorithm, the position
executed reference
in a NI myRIO of theand
device, piezothedriver.
Arduino TheUnocommunication
was established between
by meansthe
control algorithm, executed in a NI myRIO device, and the Arduino Uno
of the XBee technology. Thus, the control algorithm was executed wirelessly. Since the piezo driver was established by means
of the XBee
KPZ101 must technology.
be fed with Thus,
a 0–10theVcontrol
controlalgorithm
signal anwas executed
ad hoc module wirelessly.
was usedSince the piezo
for testing driver
purposes.
KPZ101 must be fed with a 0–10 V control signal an ad hoc module
This module was aimed at amplifying the output signal of the Arduino, received from the XBee was used for testing purposes. This
module was aimed at amplifying the output signal of the Arduino, received
module, in order to deliver the control signal to the piezo driver (See Figure 7). Thus, the module from the XBee module, in
order to deliver the
was composed control
of—(1) an signal
XBee to the piezo
module, fordriver (See Figure purposes;
communication 7). Thus, the (2)module
an Arduinowas composed
Uno, for
of—(1)
reading the position of the PEA from the KSG101 and setting the reference signal for thethe
an XBee module, for communication purposes; (2) an Arduino Uno, for reading PEA;position
(3) an
of
adthe
hocPEA from themodule
amplifying KSG101that andconverted
setting thethe reference
PWM outputsignal for the from
signal PEA;the (3) an ad hocUno
Arduino amplifying
into an
module that converted
analog signal to feed the thepiezo
PWMdriver
outputKPZ101.
signal from
Thisthe Arduino Uno
amplifying intobased
circuit, an analogon a signal
general to purpose
feed the
piezo driver KPZ101. This amplifying circuit, based on a general purpose
BJT NPN 2N2222A transistor (see Figure 7), allowed the feeding of the PEA pre-amplifier within the BJT NPN 2N2222A transistor
(see
rangeFigure
of 0 7),
and allowed
10 V, the feeding
so the sameof approach
the PEA pre-amplifier
was applicable within
forthe range
other of 0 and
devices. 10 V,this
Thus, so the same
module
approach was applicable for other devices. Thus, this module sampled
sampled the position of the PEA and sent it, by means of the XBee module, to the NI myRIO, where the position of the PEA and
sent it, by means
the control of the XBee
algorithm was module,
executed,to and the NI myRIO,
finally where the
received the control
controlalgorithm
signal for was executed, and
positioning the
finally
actuator. received the control signal for positioning the actuator.
Figure 7. Amplification circuit attached to the KPZ101 piezo-driver.
piezo-driver.
Figure 8 shows
shows the
the layout
layout ofof the
the experimental
experimental set set up,
up, which
which included
included thethe following
following major
components—(1) the the sensor;
sensor; (2)
(2)the
thecontroller,
controller,and
and(3)(3)the
thePEA
PEA actuator. Figure
actuator. Figure 9 shows9 shows allthe
all of of
the devices
devices involved
involved in the
in the experimental
experimental setset up—in
up—in particular,the
particular, thePEA
PEAitself,
itself,the
the driver,
driver, and the
pre-amplifier,
pre-amplifier,which
whichwere
wereallall
supplied by the
supplied by vendor, the ad-hoc
the vendor, amplifier
the ad-hoc circuit, the
amplifier two XBee
circuit, modules
the two XBee
attached to the Arduino Uno, and the NI myRIO, respectively. The controller
modules attached to the Arduino Uno, and the NI myRIO, respectively. The controller was was implemented in
LabVIEW,
implemented namely by meansnamely
in LabVIEW, of the standard
by meansPID library
of the provided
standard in the LabVIEW.
PID library provided The PID
in the module
LabVIEW.
was tuned
The PID with the
module wasfollowing
tuned with parameters: Proportional
the following parameters: Gain, Kc = 1, Integral
Proportional Gain, KcTime,
= 1,Ti = 0.001Time,
Integral min,
and
Ti = without Derivative
0.001 min, Time,
and without Td, since Time,
Derivative a simple
Td,PI controller
since a simplewas
PIchosen.
controller was chosen.Appl. Sci. 2019, 9, x FOR PEER REVIEW 13 of 21
Appl. Sci. 2019, 9, x FOR PEER REVIEW 13 of 21
The2019,
Appl. Sci. frames
9, 2379used to exchange
information between the Arduino and the NI myRIO, followed 13 of 20
the same
Theformat
frames(shown
used toinexchange
Figure 2),information
as described in Section
between 3.
the Arduino and the NI myRIO, followed
the same format (shown in Figure 2), as described in Section 3.
Figure
Figure 8.
8. Layout
Figure8. Layout of the
of the experimental
the experimental setup.
experimentalset
set up.
up.
Figure9.
Figure 9. Layout
Layout of
of the
the experimental
experimentalset
setup.
up.
Figure 9. Layout of the experimental set up.
5.2.The
Testframes
Resultsused to exchange information between the Arduino and the NI myRIO, followed the
5.2. Test Results
same format (shown in Figure 2), as described in Section 3.Appl. Sci. 2019, 9, 2379 14 of 20
Appl.Test
5.2. Sci. 2019, 9, x FOR PEER REVIEW
Results 14 of 21
During
During thethe tests,
tests, the
the reference
reference signal
signal was
was created
created by by the
the LabVIEW
LabVIEW application
application executed
executed atat the
the
NI myRIO and was sent to the PEA by means of the XBee communication.
NI myRIO and was sent to the PEA by means of the XBee communication. The PEA was positioned The PEA was positioned
accordingly
accordingly and and the
the measured
measured position
position was
was sent
sent back
back to to the
the LabVIEW
LabVIEW program,
program, which
which executed
executed the
the
PI algorithm aimed at correcting the position errors that occurred in the positioning
PI algorithm aimed at correcting the position errors that occurred in the positioning process of the process of the
PEA.
PEA. Several
Severalreference
referencesignals
signalswere usedused
were to analyze
to analyzethe behavior of the system
the behavior of theinsystem
different
insituations.
different
In particular, a ramp signal, a square signal, and a steady reference signal was
situations. In particular, a ramp signal, a square signal, and a steady reference signal was used. used.
The first test
The first testillustrates
illustratesthe thebehavior
behaviorofof the
the system
system without
without using
using close
close looploop control
control schemes,
schemes, i.e.,
i.e.,
as an open loop process. In this test, it could be observed that when a closed loop controller waswas
as an open loop process. In this test, it could be observed that when a closed loop controller not
not used, the error between the reference and the measured value was steady
used, the error between the reference and the measured value was steady and noticeable. For this and noticeable. For this
test,
test, it
it was
was around
around 25% 25% of of the
the reference
reference value,
value, soso itit was
was necessary
necessary toto correct
correct this
thiserror,
error,see
seeFigure
Figure10.10.
Figure
Figure 10.
10. Without
Without aa proportional
proportional integral (PI) controller.
integral (PI) controller.
In the following tests, the controller was a basic PI controller, with a value of 1.000 for the
proportional gain, Kc, Kc, while
while the the integral
integral timetime Ti,
Ti, was
was setsetto
to0.001
0.001min.min.
Figure 11 11 shows
shows the thedetail
detailofofone onelonger
longer test, in which
test, in which the system the systemfollowsfollows
a rampa ramp signal.
signal. The
The sampling
sampling frequency
frequency usedusedin theintest
the was
test was 100 milliseconds
100 milliseconds and and the duration
the duration of theofshown
the shown samplesample
was
was around
around 150 s.150 s. Infigure,
In this this figure, the effect
the effect of the of the missed
missed packagespackages
can be caneasilybe seen
easily asseen as the vertical
the vertical orange
orange
lines outlines outramp
of the of theinput
rampsignal.
input signal.
In Figure In 11,
Figure
seven 11,missed
seven missed
messages messages
that made thataround
made around0.5% of0.5%
the
of themessages
sent sent messages
can becan be The
seen. seen.analysis
The analysis of several
of several tests indicated
tests indicated that sometimes
that sometimes the packages
the packages were
were corrupted
corrupted and other
and other timestimesthese these
were were not delivered
not delivered correctly.
correctly. For thisForreason,
this reason, two mechanisms
two mechanisms were
were introduced
introduced in theinsoftware,
the software, in order
in order to detect
to detect thesethese
wrong wrong
or lostor lost packages,
packages, namely
namely (1) checking
(1) checking the
the integrity
integrity of the
of the messages
messages by means
by means of theof the checksum
checksum sentsent
in thein the
XBee XBee
framesframesandand (2) analyzing
(2) analyzing the
the sequence
sequence number
number to detect
to detect the the
missedmissed packages.
packages. TheseThese mechanisms
mechanisms were were introduced
introduced both both in the
in the NI
NI myRIO
myRIO LabVIEW
LabVIEW program
program andandthethe Arduino
Arduino sketch.
sketch. Additionally,
Additionally, it was
it was necessary
necessary toto introducea
introduce
apolicy
policytotodeal
dealwith
withthe themissed
missedmessages.
messages.The Theauthors
authorsdecided
decidedthat thataapolicy
policy thatthat would
would be easy to
implement
implement was wastotoalways
always store thethe
store lastlast
knownknownvalue, so that
value, sointhat
caseinofcase
a missing message,message,
of a missing the softwarethe
could
softwareusecould
the previous
use the knownprevious value.
known Therefore, the remaining
value. Therefore, tests were executed
the remaining tests werewith this policy
executed with
implemented in the software.
this policy implemented in the software.
The following tests were performed at the the following
following conditions:
conditions: (1) 5 m distance between the
controller,
controller,thetheLabVIEW
LabVIEW program
program embedded
embedded in theinNIthemyRIO, and the and
NI myRIO, sensor/actuator block connected
the sensor/actuator block
to the Arduino Uno; (2) a sampling period of 100 milliseconds, and
connected to the Arduino Uno; (2) a sampling period of 100 milliseconds, and (3) a resolution of (3) a resolution of 1023. These
graphs show, graphs
1,023. These both, the reference
show, both,signal generated
the reference at thegenerated
signal controller at and thethecontroller
actual position
and the variable,
actual
position variable, measured by the Arduino. These tests were executed with different reference
signals in order to analyze the response of the PI in different situations.You can also read