Stock Market Simulation - Worcester Polytechnic Institute
←
→
Page content transcription
If your browser does not render page correctly, please read the page content below

Project Number: DZT 2007

 Stock Market Simulation

 An Interactive Qualifying Project Report

 Submitted to the

 Faculty of

 WORCESTER POLYTECHNIC INSTITUTE

 in partial fulfillment of the requirements for the

 Degree of Bachelor of Science

 By

Wonjae Jang _____________________________

 Submitted:

 September 2, 2020

 Approved by Professor Dalin Tang, Project Advisor

____________________________________________
Abstract

The objective of this project was to learn how to invest in the stock market. A four-week stock

market simulation was performed using technical and swing trading strategies and

TDAmeritrade’s trading platform. A $100,000 initial investment was made for each method, with

the intention to make profit through trading using the two different trading strategies. The

technical trading strategy strictly traded with Microsoft and Netflix. It netted a profit of $4521.80,

a 4.5% increase in the portfolio after 4 weeks. The swing trading strategy strictly traded with

Apple and Disney. It netted a profit of $33,693.45, a 33.7% increase in the portfolio after 4 weeks,

mostly trading through the news. While the results showed that Swing Trading had better return,

the difference could be caused by the differences of companies selected. Simulations using more

companies should be performed for further investigations.

 2
Acknowledgement

I would like to first thank my family for supporting my education at Worcester Polytechnic

Institute. Without their continued support, I would have never been able to learn everything I have

so far. I would also like to thank my advisor, Professor Tang for advising this project and giving

timely support over this past term.

 3

Table of Contents

Abstract ............................................................................................................................................................... 2
Acknowledgement ............................................................................................................................................. 3
List of Figures..................................................................................................................................................... 6
List of Tables ...................................................................................................................................................... 8
1. Introduction ................................................................................................................................................... 9
 1.1 The History of the Stock Market .................................................................................................... 9
 1.2 Factors of the Stock Market ..........................................................................................................11
 1.3 Stock Market Index .........................................................................................................................12
 1.3.1 S&P 500 ....................................................................................................................................12
 1.3.2 Dow Jones Industrial Average ..............................................................................................14
 1.3.3 Nasdaq Composite Index ......................................................................................................16
 1.3.4 Russell 2000 Index ..................................................................................................................17
2 Methodology............................................................................................................................................20
 2.1 Trading Techniques ........................................................................................................................20
 2.1.1 Technical Trading ...................................................................................................................20
 2.1.2 Swing Trading ..........................................................................................................................22
 2.1.3 Day Trading .............................................................................................................................22
 2.2 Data Analysis ...................................................................................................................................23
 2.2.1 Fundamental Analysis ............................................................................................................24
 2.2.2 Technical Analysis...................................................................................................................25
 2.3 Simulation Engines .........................................................................................................................26
3 Technical Trading ...................................................................................................................................27
 3.1 Companies Chosen .........................................................................................................................27
 3.2 Simulation .........................................................................................................................................29
 3.2.1 Week 1 ......................................................................................................................................30
 3.2.2 Week 2 ......................................................................................................................................32
 3.2.3 Week 3 ......................................................................................................................................35
 3.2.4 Week 4 ......................................................................................................................................37

 4
3.3 Results ...............................................................................................................................................39
4 Swing Trading..........................................................................................................................................41
 4.1 Companies Chosen .........................................................................................................................41
 4.2 Simulation .........................................................................................................................................43
 4.2.1 Week 1 ......................................................................................................................................44
 4.2.2 Week 2 ......................................................................................................................................46
 4.2.3 Week 3 ......................................................................................................................................48
 4.2.4 Week 4 ......................................................................................................................................51
 4.3 Results ...............................................................................................................................................53
5 Analysis and Comparison ......................................................................................................................54
6 Conclusion ...............................................................................................................................................56
References .........................................................................................................................................................57
Appendix ...........................................................................................................................................................59
 Table A: Technical Trading Stock Simulation Profile .......................................................................59
 Table B: Swing Trading Stock Simulation Profile ..............................................................................59

 5
List of Figures

Figure 1-1: S&P 500 Market Summary from 1975 to 2020 from MarketWatch ......................... 13

Figure 1-2: S&P 500 Market Summary from July 2019 to July 2020 from MarketWatch .......... 14

Figure 1-3: DJIA Market Summary from 1975 to 2020 from MarketWatch ............................... 15

Figure 1-4: DJIA Market Summary from July 2019 to July 2020 from MarketWatch ................ 15

Figure 1-5: Nasdaq Composite Index Market Summary from 1975 to 2020 from MarketWatch 16

Figure 1-6: Nasdaq Composite Index Market Summary from July 2019 to July 2020 from

MarketWatch................................................................................................................................. 17

Figure 1-7: Russell 2000 Index Market Summary from 1987 to 2020 from MarketWatch ......... 18

Figure 1-8: Russell 2000 Index Market Summary from July 2019 to July 2020 from MarketWatch

....................................................................................................................................................... 18

Figure 3-1: Microsoft stock trend over 5 years (July 2015 - July 2020) from MarketWatch....... 28

Figure 3-2: Netflix stock trend over 5 years (July 2015 - July 2020) from MarketWatch. .......... 29

Figure 3-3: Microsoft stock trend over Week 1 (7/13 - 7/17) from MarketWatch ....................... 30

Figure 3-4: Netflix stock trend over Week 1 (7/13 - 7/17) from MarketWatch ........................... 31

Figure 3-5: Microsoft stock trend over Week 2 (7/20 - 7/24) from MarketWatch ....................... 33

Figure 3-6: Netflix stock trend over Week 2 (7/20 - 7/24) from MarketWatch ........................... 34

Figure 3-7: Microsoft stock trend over Week 3 (7/27 - 7/31) from MarketWatch ....................... 36

Figure 3-8: Netflix stock trend over Week 3 (7/27 - 7/31) from MarketWatch ........................... 36

Figure 3-9: Microsoft Stock trend over Week 4 (8/3 - 8/7) from MarketWatch .......................... 38

Figure 3-10: Netflix Stock trend over Week 4 (8/3 - 8/7) from MarketWatch: ........................... 39

Figure 4-1: Apple stock trend over 5 years (July 2015 - July 2020) from MarketWatch............. 42

Figure 4-2: Disney stock trend over 5 years (July 2015 - July 2020) from MarketWatch. .......... 43

 6
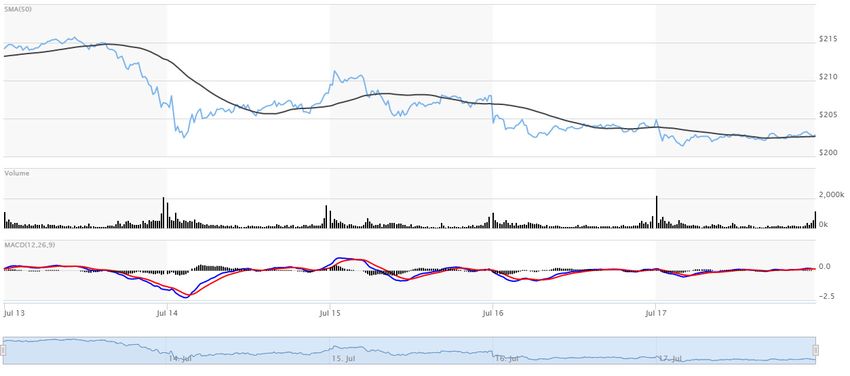
Figure 4-3: Apple stock trend over Week 1 (7/13 - 7/17) from MarketWatch ............................. 44

Figure 4-4: Disney stock trend over Week 1 (7/13 - 7/17) from MarketWatch ........................... 45

Figure 4-5: Apple stock trend over past 3 months (May 2020 to July 2020) from MarketWatch 46

Figure 4-6: Apple stock trend over Week 2 (7/20 - 7/24) from MarketWatch ............................. 47

Figure 4-7: Disney stock trend over Week 2 (7/20 - 7/24) from MarketWatch ........................... 48

Figure 4-8: Apple Stock trend over Week 3 (7/27 - 7/31) from MarketWatch ............................ 50

Figure 4-9: Disney Stock trend over Week 3 (7/27 - 7/31) from MarketWatch........................... 50

Figure 4-10: Apple Stock trend over Week 4 (8/3 - 8/7) from MarketWatch .............................. 52

Figure 4-11: Disney Stock trend over Week 4 (8/3 - 8/7) from MarketWatch............................. 52

 7

List of Tables

Table 3-1: Pre-Week 1 Buys for Technical Trading Method ....................................................... 29

Table 3-2: Week 1 Buys/Sells for Technical Trading Method ..................................................... 31

Table 3-3: 3.3 Week 2 Buys/Sells for Technical Trading Method ............................................... 34

Table 3-4: Week 3 Buys/Sells for Technical Trading Method ..................................................... 37

Table 3-5: Week 4 Buys/Sells for Technical Trading Method ..................................................... 39

Table 4-1: Pre-Week 1 Buys for Swing Trading Method ............................................................. 43

Table 4-2: Week 1 Buys/Sells for Swing Trading Method........................................................... 46

Table 4-3: Week 2 Buys/Sells for Swing Trading Method........................................................... 48

Table 4-4: Week 3 Buys/Sells for Swing Trading Method........................................................... 51

Table 4-5: Week 4 Buys/Sells for Swing Trading Method........................................................... 53

 8
1. Introduction

The objective of this project is to immerse myself in the stock market, taking a deep dive into how

the market operates, discovering what affects the market, and how to successfully trade within the

market. After learning about the operations of the market and successful strategies, we will be

trading using a simulation of the real stock market and attempt to net a positive income after a four

week trading period, using two different trading strategies.

In this section, we will be discussing the introduction of the stock market to the world and how the

stock market has become what is it today. We will be starting with its inception in Belgium in

1531 as an investing and trading of notes and bonds, to the current day high speed trades over

internet and even through apps on a smartphone.

1.1 The History of the Stock Market

The first stock exchange was created in Antwerp, Belgium in the year 1531. Before the inception

of the first stock market, Antwerp was a bustling port city, mainly due to its geographic position.

It was positioned convenient at the mouth of an inlet that led directly into the ocean. This allowed

the city to trade with many others and have much economic success during its existence.

The port city was first popular due to the abundance of trade in cloth, silk, sugar, and diamonds.

Through the 14th century, the port city expanded, creating breweries (Encyclopedia Britannica,

2020). The prosperity of the city led to the opening of the first stock exchange in 1531 where

brokers and investors would meet with local businesses, the government, and individuals. These

trades were strictly in promissory notes and bonds, not stocks (Beattie, 2020).

The East India Companies were the next example of a stock exchange. In the 1600s, the East India

Companies were formed to fund voyages from West Europe to the East Indies and Asia. There

were many risks involved when voyaging over long distances. To lower these risks, ship owners
 9
looked towards the East India Companies to cover voyages, in return for a portion of the profit if

the voyage was successful. Investors would buy stocks within the East India Companies and would

receive dividends on the profits from the voyages (Beattie, 2020). Both the trading at Antwerp and

the East India Companies were done completely on paper. Because of this, papers could be traded.

With no government regulations, dividends were often left unpaid and the system began to fail.

This is why the present stock market is heavily regulated. The first government regulated stock

market was formed in London in the year of 1773. These regulations were formed to create a

concrete system that would discourage fraudulent traders. With rules and a membership fee to

participate within the exchange, the London Stock Exchange became the first regulated stock

exchange (Chen, London Stock Exchange (LSE), 2020).

As technology developed over the next two centuries, many improvements to the stock market

would be put into place. With the invention of telephones, market orders could be placed from

anywhere. However, the greatest improvement to the stock market was the introduction of the

National Association of Securities Dealers Automated Quotations market (NASDAQ) in 1971.

NASDAQ was different from the current system of brokers trading on a floor from 9 am to 4 pm.

Instead, NASDAQ was formed to allow a computerized bulletin board to post bids and offers.

This computerized bulletin board sped up the trading process and in the 1980s, paved the way to

an electronic trading system. With technology booming, trading became even faster. With the

introduction of personal computers and internet traffic increasing in the late 1990s, online

brokerage firms came into existence, who offered reduced commission and fees due to the

automatic nature of the transactions. This generated an immense amount of interest within online

trading, creating a decline of popularity in floor traders (Pisani, 2010). This brings us to the present

day where most individuals can trade commission free on many online platforms from the comfort

 10
of their own home. Some online platforms consist of E-Trade, IBKR, TD Ameritrade, and Fidelity.

However, these online platforms have become even more simplified to apps, drawing in an even

larger consumer base. Some of these online platforms consist of Robinhood, Atom, and Webull.

1.2 Factors of the Stock Market

When trying to understand the direction that the stock market may head in, an investor must take

into consideration the following factors: world events, interest rates, and internal developments.

Overall, world events can have an enormous impact on the stock market as a whole. A world event

could be a natural disaster, a pandemic, or war. Any event that would drastically alter the daily

lifestyle of a large group of people could be considered a world event. One example is actually

right now. At the time of writing this, we are living through the COVID-19 outbreak, classified as

a global pandemic. This outbreak has caused global market crashes.

Another factor of the stock market is interest rates. Interest rates are an indicator as to how to

economy is doing as a whole. When interest rates are on the rise, people are more likely to save

money, reducing demand. When interest rates are low, people are more likely to increase spending,

which typically means the economy will do well. A great indicator is the Federal Reserve System,

or better known as The Fed. In the United States, The Fed controls the federal funds rate, an interest

rate that is set as a recommended rate for all banking institutions to follow. When The Fed lowered

the federal funds rate was lowered to a range of 0 to 0.25% in March of 2020 in response to the

COVID-19 pandemic, it is commonly seen as a tactic to give an artificial boost to the economy.

The last factor is internal developments. When looking to invest within a company, it is important

to know an in-depth background of the company and what they stand for. One key part of the

background of a company to know its product or service and the direction in which the company

 11
is moving towards. Another is the culture and workforce of a company. Successful companies

have a well-educated workforce and leaders. Without a productive workforce, a company cannot

perform nor create revenue.

1.3 Stock Market Index

The stock market is measured in various ways. One way is with an index. An index consists of a

hypothetical portfolio of certain related investments within the market. Indexes could consist of

different industries or be based off of location. These portfolios create a benchmark and overall

health of a market segment. An index can be calculated through various weights, such as market-

cap, revenue, float, and fundamental weighting. Market indexes are largely used to benchmark the

performance of a stock compared to the stocks within the index and to create investable index

funds. The most popular indexes consist of the S&P 500, Dow Jones Industrial Average, and the

Nasdaq Composite (Young, 2020).

1.3.1 S&P 500

The S&P 500, or Standard & Poor’s 500 Index, is an index consisting of the 500 largest U.S.

publicly traded companies. The index uses a market-capitalization weight, meaning it favors

companies with a higher market cap. This however has its limitations when it comes to companies

that become overvalued, inflating the price of the index. However, it accurately depicts the total

value of companies, unlike other indexes that give more weight to the cost of the individual stock.

Overall, the S&P 500 is considered representative of the market as a whole because these top 500

companies hold a substantial percentage (Kenton, S&P 500 Index - Standard and Poor's 500 Index,

2020).

 12
Currently, the S&P 500 is valued at $3041.31. Over one year, the S&P 500 has had a 3.03%

growth, when it was valued at $2950.46 in June of 2019. The market summary since 1978 is shown

by Figure 1.1.

 Figure 0-1: S&P 500 Market Summary from 1975 to 2020 from MarketWatch

In Figure 1.2, we can observe the S&P 500 over the past year. There was a steady increase until

February/March of 2020, when COVID-19 was raised to a global pandemic scale, and there were

major sell offs. Over the past couple of months during quarantine, the market has gradually

recovered back to its previous state.

 13
Figure 0-2: S&P 500 Market Summary from July 2019 to July 2020 from MarketWatch

1.3.2 Dow Jones Industrial Average

The Dow Jones Industrial Average (DJIA) is an index that consists of 30 publicly owned blue chip

companies. Blue chip companies are well recognized and financially stable companies. The DJIA

is price weighted, unlike the S&P 500. Because of this, even though some companies may have a

higher market cap, the weight of a company could higher due to its higher price.

The Dow is often criticized for its price weighted index, as the price of a stock does not always

indicate a company’s worth, unlike a market cap. The Dow also only indexes 30 blue chip

companies, which means that overall, The Dow will be on the rise, which may not always be the

case for the rest of the economy. Currently, The Dow is valued at $25,605.54. Over one year, the

Dow has had a 4.26% decline, when it was valued at $26719.13 in June of 2019. The market

summary since 1978 is shown in Figure 1.3.

 14
Figure 0-3: DJIA Market Summary from 1975 to 2020 from MarketWatch

In Figure 1.4, we can observe the DJIA market summary over the past year, from July 2019 to July

2020. Like the S&P 500, we see a steep sell off as the global pandemic occurred. However, the

DJIA has not recovered back to its original state. This may be because many of the DJIA contains

industrial companies that may have restrictions in bringing back people to their industrial zones

for labor, so they haven’t been able to produce at full capacity yet.

 Figure 0-4: DJIA Market Summary from July 2019 to July 2020 from MarketWatch

 15
1.3.3 Nasdaq Composite Index

Nasdaq is an index that primarily focuses on technology stocks. It is the world’s first electronic

exchange and lists most of the technology giants such as Amazon, Apple, Facebook, and Tesla.

The Nasdaq is a market capitalization-weighted index which means the index is weighted by the

market cap of the companies within the index. Market capitalization-weighted indexes are

sometimes criticized because higher market cap companies within the index may share much more

weight than smaller companies within the index and distort the view of the market (Chen,

Capitalization-Weighted Index, 2019).

Currently, the Nasdaq is valued at $9,946.12. Over one year, the Nasdaq has had a 23.8356%

increase, when it was valued at $8031.71 in June of 2019. The market summary since 1975 is

shown in the Figure 1.5.

 Figure 0-5: Nasdaq Composite Index Market Summary from 1975 to 2020 from MarketWatch

In Figure 1.6, we can observe that the Nasdaq Composite Index over the past year has been doing

very well, recovering even past the point at which it was at before the pandemic. This is mostly

due to the companies within this index heavily benefitting from the work from home lifestyle.

 16
Figure 0-6: Nasdaq Composite Index Market Summary from July 2019 to July 2020 from MarketWatch

1.3.4 Russell 2000 Index

The Russell 2000 Index consists of the bottom 2000 companies within the Russell 3000 index. The

Russell 3000 Index consists of 3000 of the largest stocks within the U.S which accounts for

approximately 98% of the investable U.S. stock market. Both are market-cap weighted indexes.

The Russell 2000 Index is commonly used to indicate the entire market rather than including the

highest cap stocks which would create bias within the index (Chen, Russell 2000 Index, 2020).

Currently, the Russell 2000 Index is valued at $1418.63. Over one year, the Russell 2000 Index

has had a 6.65618% decrease, when it was valued at $1519.79 in June of 2019. The market

summary since 1987 is shown in Figure 1.7.

 17
Figure 0-7: Russell 2000 Index Market Summary from 1987 to 2020 from MarketWatch

In Figure 1.8, we can see the Russell 2000 Index over the past year. As we discussed earlier, the

Russell 2000 Index is a good indicator for the entire market, not just the top performing stocks. In

Figure 1.8, we see a steep sell off of stocks in February to March and it has not been able to climb

back up to its original point before the sell off. This shows the market is not doing well in general,

even though big stocks in the NASDAQ may be showing profits.

 Figure 0-8: Russell 2000 Index Market Summary from July 2019 to July 2020 from MarketWatch

 18
Reviewing the above indexes with current events, such as the COVID-19 pandemic, we can see

that the Russell 2000 Index is true to the current small-cap stocks. Unlike the other indexes that

are skewed by top stocks, the Russell 2000 Index contains medium to small-cap stocks which

makes it more representative of the economy as a whole. This is why we have seen a decrease over

the past year, while the other indexes that measure through market-cap have seen an increase

because of top stocks such as Amazon and Facebook.

 19
2 Methodology

Within this section, we will be discussing the different types of trading that exists, ranging from

technical, swing, and day trading. We will also be discussing the different types of data analysis

that can be done while trading, which are fundamental and technical analysis. Finally, we will be

going over the simulation engine that will be used during this experiment.

2.1 Trading Techniques

There are 5 main ways of trading. These are technical, swing, momentum, fundamental, and day

trading. In this study, we will be looking into technical, swing, and day trading. I plan to study and

execute these trades in the coming sections. For the two trading techniques we will not be

executing, this is a quick definition. Momentum trading consists of trading stocks that are moving

in one direction in large quantities for a period of times. Momentum traders take advantage of

these movements. Fundamental trading looks into the background of the company, trading based

off of earning reports, acquisition, etc. (Palmer, 2019).

2.1.1 Technical Trading

Technical trading consists of looking at charts and graphs and recognizing patterns from past data

to determine what may happen. Commonly, technical traders look at indicators that may give tell-

tale signs of the future stock movement. Some of these are RSI, range trading, pattern analysis,

trend analysis, and gap analysis.

RSI stands for Relative Strength Index. This index is a momentum indicator that calculates the

magnitude of recent price changes to evaluate overbought or oversold conditions in the price of a

stock. This value calculated by the RSI range from 0 to 100%. When the RSI of a stock is above

70%, it is commonly said to be overbought, and when the RSI of a stock is below 30%, it is

 20
commonly said to be oversold. Typically, when the RSI goes beyond these thresholds, they

rebound in the opposite direction. However, the RSI can stay beyond these thresholds when stocks

have significant momentum in a direction. In situations where a stock is doing great due to some

news, the RSI would report being overbought and would signal a sell, however, would continue to

stay overbought. In conclusion, the RSI should be used in oscillating markets. (Chen, Relative

Strength Index (RSI), 2020).

Range trading consists of creating support and resistance levels within charts of a stock. Support

and resistance levels are created by creating a line that lines up with the lowest or highest points

of a stock during a period of time. Support lines are created to be set as a minimum that stocks will

not fall below, and resistance lines are created to be set as a maximum that stock will not exceed

beyond. These price levels are points in which the stock has had difficulty falling below or reaching

above. Of course, these levels can be broken out of to go past resistance or below support.

Breakouts are indications that traders should either jump in when going past resistance and get out

when dipping below support. Breakouts are more likely to continue when high volumes are being

traded, and less likely to continue when relatively low volumes are being traded (Mitchell,

Breakout Definition and Example, 2020).

Trend analysis uses the MACD, moving average convergence divergence. MACD is a moving

average that indicates a stock’s past average price. The MACD is calculated by taking the 12 period

exponential moving average and subtracting the 26 period exponential moving average. Investors

use the MACD to find crossovers. When the MACD crosses above the current price, this indicates

a buy, while when it crosses below the current price, this indicates a sell. The speed in which

crossovers occur is also taken into account to determine whether or not a stock is being overbought

or oversold (Hayes, Moving Average Convergence Divergence - MACD, 2020).

 21
2.1.2 Swing Trading

The objective of swing trading is to find a potential price move and capitalize on it. Swing traders

generally have holdings times ranging from overnight to a few weeks. Unlike technical trading

that can happen over long periods of times, swing trading generally happens within days.

Swing traders find trends, whether they be upwards or downwards, and attempt to profit off of

them. Within a bullish market, swing traders would buy stocks and create stop loss points, buying

low and selling high. The objective is to capture the uptrend and sell before the stock decreases to

the stop loss point (Mitchell, Guide to Swing Trading, 2020).

On the downwards trend, swing traders would short shares, meaning they bet against a stock. This

happens by borrowing shares that are to be bet against. Then, you sell the shares and wait for the

stock to fall in price before buying the stock at the lower price point. Afterwards, you return the

borrowed stocks. By capturing the difference in this downward trend, a swing trader is able to

profit off of the loss of a stock. However, shorting a stock is a huge risk. If a stock rises in price,

the trader loses the difference from the bought price to the current higher price. When trading by

buying stocks, the most you can lose is the amount of money used to purchase the stock. However,

when shorting a stock, theoretically, one can lose an infinite amount of money. This would occur

if the stock were to rise in percentage. For example, if we shorted stock EXAMPLE at $100, and

it rose to $1,000,000 the next day, we would owe $999,900. However, if we bought stock

EXAMPLE at $100, and the next day it went to $0, we would lose $100. This is why shorting a

stock can be a risk, as you can theoretically lose an infinite amount of money.

2.1.3 Day Trading

Day trading is a completely different type of strategy compared to technical and swing trading.

Day traders are usually well funded. Using their high base capital, they employ short-term

 22
strategies that take advantage of small term price movements. Day traders typically make multiple

trades during a single day. Because of this, they must typically have to start off with more than

$25,000. This is due to Pattern Day Trader laws. A pattern day trader (PDT) is a trader who

executes four or more day trades during five business days using a margin account (Chen, Pattern

Day Trader, 2020). This rule states that people who fall under the PDT category are required to

hold a minimum of $25,000 within their margin account. Otherwise they cannot trade and can have

penalties placed on them.

Day traders typically trade the news and scalp a market. Trading the news is simple. Based off of

different current events, traders will buy and sell different markets. For example, if a company’s

CEO resigns, a day trader may short the stock. Another example would be if a company’s earnings

for a quarter were released and there was a large, non-estimated profit. A day trader would take

advantage of this and buy shares of this company. On the other hand, day traders also scalp a

market. This is by taking advantage of minute difference within a stock’s price. Scalpers take very

small profits on individual trades. This strategy has a lot less risk involved; however, a large loss

can remove many small gains.

2.2 Data Analysis

There are 3 main techniques of data analysis when stock trading: fundamental analysis, technical

analysis, and ratio analysis. Fundamental analysis focuses on measuring intrinsic value by

observing similar economic and financial factors. Fundamental analysis aims to determine a

stock’s fair market value. By finding stocks that are trading above or below their fair market value,

traders can buy or short the stock to create a profit. Technical analysis focuses on looking at an

investment’s history in volatility and price. Ratio analysis is a supportive analysis that look s into

a company’s financial statements to find information. Ratio analysis is typically used in

 23
conjunction with other analysis tactics and is not used on its own. In this project, we will be using

fundamental and technical analysis to trade.

2.2.1 Fundamental Analysis

There are two main types of fundamental analysis. There is quantitative and qualitative

fundamental analysis. Quantitative fundamental analysis strictly looks at quantitative data in

economic and financial factors. Some quantitative fundamentals are balance sheets, income

statements, and statement of cash flows (Segal, 2020). Balance sheets are a list of company assets,

liabilities, and equity. Income statements show the revenue and profit of a company. Finally,

statement of cash flows show how money is being invested and used in the overall business

operation. Overall, these quantitative fundamentals show an overarching summary of a company’s

value and can help investors determine a fair value.

The quantitative fundamental analysis we will be using in this project will be the profitability ratio.

Profitability ratios are simply put as a ratio of a business’s earnings versus operation costs.

Profitability ratios are used to asses a company’s ability to generate revenue and shows how well

a company will return equity (Kenton, Profitability Ratios Definition, 2020). The following are

the most popular profitability ratios: gross profit margin, operating profit margin, net profit margin,

return on assets, and return on equity. All of these ratios are different profitability ratios. The higher

these ratios are, the higher the profits may be of the company.

 : (1)

 : (2)

 24
 : (3)

 : (4)

 : (5)

 : (6)

On the other hand of fundamental analysis is qualitative fundamentals. Qualitative fundamentals

consist of business model, competitive advantage, management, and corporate governance.

Business model refers to what is making the company money. This can seem deceptively simple;

however, some companies may be making their revenue in different ways such as royalties or

franchise fees. Competitive advantage is simply what a company has that is better than the

competitors. For example, AMD has a competitive advantage in computer chip design over Intel.

This means that more AMD chips will be sold than Intel and will continue to do so as long as

AMD holds a competitive advantage. In this project, we’ll be focusing mainly on business model

and competitive advantage that companies may hold in their industry.

2.2.2 Technical Analysis

Unlike fundamental analysis that focuses on a company’s background, return, and profits,

technical analysis focuses on trading data. This can range from volume movement, price

movement, futures, and historical patterns/trends. Technical analysis is much more prevalent in

short term trades, as volume and price movements cannot be judged over long periods of times

and historical patterns can only stay relevant for so long. When speaking of historical patterns in

technical analysis, this data is typically from the past two to three years, unless a stock has not

moved drastically within that time period. When using technical analysis, there are two major

assumptions that are made. The first assumption is that “markets are efficient with values

representing factors that influence a security’s price,” and second, “even random market price
 25
movements appear to move in identifiable patterns and trends that tend to repeat over time.”

(Hayes, Technical Analysis, 2020). These two assumptions show that technical analysis is all about

identifying trends within a stock’s life.

In technical analysis, indicators are used, much like the ones discussed in the technical trading

section. The following indicators are commonly used for technical analysis: price trends, moving

averages, support and resistance lines, volume and momentum, and oscillators. Volume and

momentum refer to how much and how fast a stock is trading. An oscillator is an indicator that

takes the highest and lowest values of a stock within a set time period and builds a trend that

oscillates between these two bounds. When the value of the stock approaches either bound, the

stock is seen to be overbought or oversold, depending on if it is at the upper or lower bound. In

this project, we will be using moving averages, support and resistance lines, and volume and

momentum indicators while technical trading.

2.3 Simulation Engines

There are many stock trading and stock market simulation platforms. The one we will be using

within this study is Thinkorswim, from TD Ameritrade. Because we are new to trading stocks in

a technical aspect, we will be using a simulation program. This allows us to learn from our

mistakes, without taking the risk of losing money. The reason we are using Thinkorswim in

particular is because it uses the same exact program with the simulation and actual trading. By

logging in and toggling between ‘live trading’ and ‘paper money,’ the user can swap between real

trading and simulated trading, all within the same platform. Thankfully, most features are the same

between the two, so someone can easily practice trading within the paper money and transition

easily into live trading. With this simulation account, we will be starting with a balance of

$100,000.

 26
3 Technical Trading

In this section, we will be recording our process and analysis through technical trading. Because

we are currently in a pandemic and are about to hit a phase 2 wave of COVID-19 cases, we will

be choosing companies in the same fields, so that we can closely compare results without too much

of a difference. We’ll be sticking with one technology and one consumer directory for our

industries. We’ll be using RSI, range trading, and MACD, which were all previously explained in

section 2.1.1.

3.1 Companies Chosen

For our technology company, we will be choosing Microsoft and for our consumer directory, we

will be choosing Netflix. Microsoft is a great company to look into, as with a pandemic, there are

increased needs for their products, such as their Microsoft Suite.

Microsoft was founded by Bill Gates, one of the richest men to date, in 1975. Microsoft is a

company that licenses and sells technology. They license software, mainly their Office Microsoft

Suite, Windows Operating Systems, and other business and server related software. On the other

hand, Microsoft also sells hardware, such as their Xbox line up and Windows laptops/tablets.

Microsoft first went public in 1986, starting at $21.00 per share.

As of 7/13/20, Microsoft is at $214.48 pre-market. On their last quarterly report, on 4/29/20, they

had a revenue of $35 billion, a 15% increase from their last quarter. Their net income was $10.8

billion, a 22% increase from their last quarter. Overall, it can be said that the effects of COVID-

19 have had a minimal impact on Microsoft, as they have been able to expand their cloud

computing and personal computing business to many companies as business and jobs moved to

being remote. In Figure 3.1, we can see Microsoft stock growth over the past 5 years.

 27
Figure 3-1: Microsoft stock trend over 5 years (July 2015 - July 2020) from MarketWatch

Over the past 5 years, Microsoft has had a 54.94% growth, starting at $138.43 in July of 2015.

Netflix was founded by Reed Hasting and Marc Randolph in 1997. It was founded to compete with

the major movie rental company, Blockbuster. The co-founders of Netflix disliked the late fees of

Blockbuster and decided to create a competing brand that also worked with DVDs. Over the next

few decades, Netflix evolved into the full online streaming platform, home to over 14,000 titles as

of April 2020. Netflix first went public on May 23, 2002, starting at $15.00 per share.

As of 7/13/20, Netflix is at $568.52 pre-market. On their last quarterly report, they had a revenue

of $6.15 billion, a 6.6% increase from their last quarter. Their net income was $720 million, a

1.55% increase from their last quarter. Over the past quarter, they have added 10 million monthly

subscribers, and in the first quarter of 2020, they added 16 million monthly subscribers, the most

they have ever seen in a single quarter. In Figure 3.2, we can see Netflix stock growth over the

past 5 years. Over the past 5 years, Netflix has had a 397.35% growth, starting at $114.31 in July

of 2015.

 28
Figure 3-2: Netflix stock trend over 5 years (July 2015 - July 2020) from MarketWatch.

3.2 Simulation

Within this section, we’ll be going over the weekly investment actions that were made while

investing within Microsoft and Netflix. We started with 100 shares of both Microsoft and Netflix

and have been buying and selling through technical trading techniques.

 Buy/ Net Cost/ Profit/ Total
 Date Symbol Price Shares Total Cash
 Sell Proceeds Loss Profit

 $100000.00

 7/13/2020 MSFT Buy $214.48 100 $21448.00 0 $78552.00 0

 7/13/2020 NFLX Buy $568.52 100 $56852.00 0 $21700.00 0

 Table 3-1: Pre-Week 1 Buys for Technical Trading Method

 29
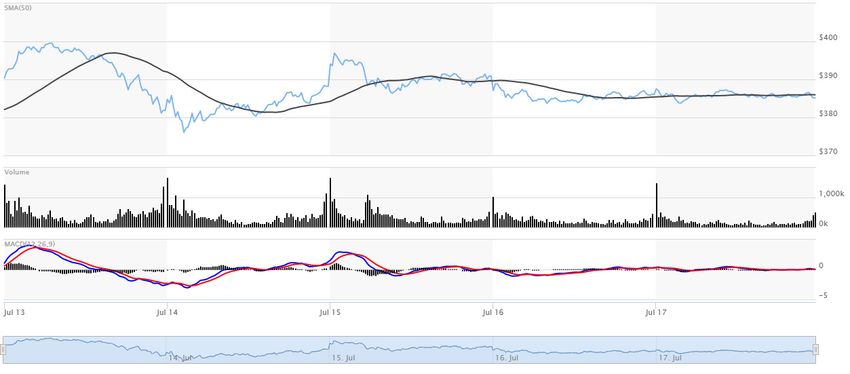
3.2.1 Week 1

Over the first week, we saw large dips within the market. Within Figure 3.3, we can observe our

MACD (blue) and MACD signal (red) for Microsoft crossing. When the MACD crosses over the

MACD signal, it is a sign to buy, while when the MACD crosses under the MACD signal, it is a

sign to sell. In Netflix, we did not see as much crossing, except for some steep sell offs on the 14th

and 17th. The MACD steadily stayed close the signal line as we can see in Figure 3.4.

 Figure 3-3: Microsoft stock trend over Week 1 (7/13 - 7/17) from MarketWatch

 30
Figure 3-4: Netflix stock trend over Week 1 (7/13 - 7/17) from MarketWatch

On the 16th, I purchased 20 shares of Microsoft at $203.84 after seeing our MACD crossing above

our signal line. Also, our MACD was on a steady increase, moving from negative to positive,

which was a good signal. On the 17th I decided to buy 10 shares of Netflix at $490.26. At this

point, I had seen our MACD line crossing over the signal line after a deep sell off and had thought

that the stock would rebound. These purchases can be seen within Table 3.2.

 Buy/ Net Cost/ Profit/ Total
 Date Symbol Price Shares Total Cash
 Sell Proceeds Loss Profit

 7/16/2020 MSFT Buy $203.84 10 $2038.40 0 $78552.00 0

 7/17/2020 NFLX Buy $490.26 10 $4902.60 0 $21700.00 0

 Table 3-2: Week 1 Buys/Sells for Technical Trading Method

 31
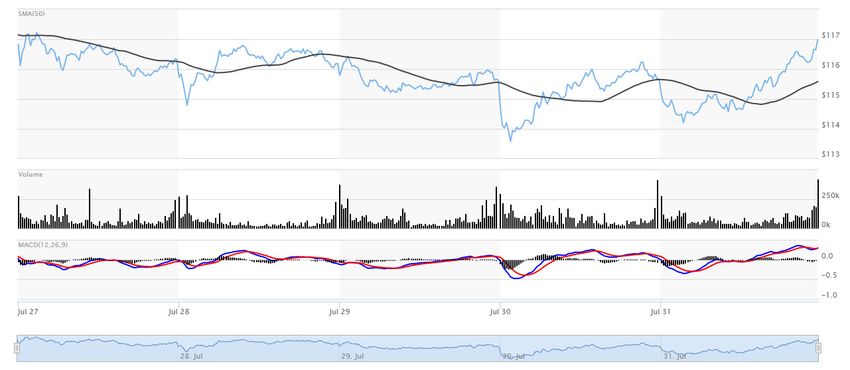
For my plans for the next week, I am looking towards selling shares within Netflix to purchase

more in Microsoft. Overall, when we look at the MACD, we see that the range is between 0 and -

2.5 for Microsoft in Figure 3.3, while the MACD range is 0 to -20 for Netflix, showing there is

much more negative volatility within Netflix in Figure 3.4. It will be safer to invest in Microsoft

over Netflix. We will however keep shares in Netflix because its MACD has averaged back to 0,

a positive sign for future earnings.

Although it is not part of technical trading, during this week, both Netflix and Microsoft released

their earnings reports for Q2 of 2020. Microsoft had an EPS of $1.46, beating analysts by $0.12,

while Netflix had an EPS of $1.59, $0.22 under analyst predictions. This can explain the steep sell

offs that Netflix had on the 17th.

3.2.2 Week 2

In week 2, we saw some interesting things happen. When viewing Microsoft we saw some steep

sell offs during the end of the week. I noticed that over time from week 1, a heavy negative MACD

with large volume are great signs to buy in a stock. This is why during this week, I decided to buy

Microsoft and Netflix when their MACDs were heavily negative and sold when they had reached

positives. I didn’t feel comfortable holding onto these stocks for too long, so I sold them quickly,

making a quick profit. As can be seen in Figure 3.5, The MACD of Microsoft was very high in the

beginning of the week. I took this as a sign to sell shares of Microsoft, predicting a decline in the

future. On the 21st of July, I sold 30 shares of Microsoft at $211.92 as the MACD was having a

downwards trend back towards 0. This netted me a profit of $29.60 for technical trading. Although

not much, we have to consider the fact that our starting point was very much at the peak of

Microsoft stock.

 32
On the 23rd, I decided to buy more shares of Microsoft at a lower price point of $202.70. I saw this

as a good opportunity to buy in as it was much lower than my previous selling price of $211.92,

and the MACD had been negative for the entire day. I didn’t see the MACD going even lower than

what it currently was and wanted to buy low.

 Figure 3-5: Microsoft stock trend over Week 2 (7/20 - 7/24) from MarketWatch

As for Netflix. I decided to do as I had said last week. I decided to sell shares of the stock as the

MACD was heavily negative over the past few days. On the 22nd, I decided to sell 50 shares of

Netflix at $492.76 in an attempt to recoup the heavy losses I had gone through so far already from

Netflix. This prediction was correct, as we can see in Figure 3.6, Netflix continued to fall. This

was probably due to the negative report from the earning call that Netflix had last week. The EPS

under analysts’ expectations definitely had a big hit on the company, even though Netflix had

reported the under evaluation before the earnings call.

 33
Figure 3-6: Netflix stock trend over Week 2 (7/20 - 7/24) from MarketWatch

 Buy/ Net Cost/ Profit/ Total Total
Date Symbol Price Shares
 Sell Proceeds Loss Cash Profit

7/21/2020 MSFT Sell $211.92 30 $6357.60 $29.60 $28057.00 +$29.60

7/22/2020 NFLX Sell $492.76 50 $24638.00 $3788.00 52695.00 -$3758.40

7/23/2020 MSFT Buy $202.70 50 $10135.00 0 $42560.00 -$3758.40

 Table 3-3: 3.3 Week 2 Buys/Sells for Technical Trading Method

 34
3.2.3 Week 3

During week 3, we were able to observe an interesting pattern that I was able to capitalize on. As

we see in Figure 3.7, for Microsoft, there were heavy sell offs during the end of the day/beginning

of the day, with a steady increase of buying throughout the day. This pattern was reinforced by the

short term MACD chart that can be seen in Figure 3.7. Following this trend, I bought 50 shares of

Microsoft July 28 at $202.17 during the end of the day as the MACD and prices were falling. This

was also a great buy because it was lower than the last price in which I bought Microsoft at

$202.70. The next morning, I saw a rise in the MACD, a good opportunity to sell the shares as we

saw a great buy in of the stock in the morning. Knowing volume peaks during the morning and

evening, this seemed to be a perfect profit. I sold 100 shares of Microsoft at $204.01 during the

morning of July 29, making a profit of $157.50. Also, during this time, rumors of Microsoft buying

the multi-billion-dollar industry of Tiktok came to light. With this information, I predicted that the

stock would be going up as Tiktok would be a huge opportunity for Microsoft. I decided to buy

more shares at a lower cost and keep them until more news came out. On July 30, I bought 200

shares of Microsoft at $200.21, I observed another dip in Microsoft on July 31, as trading in the

morning, the stock dipped below $200. Taking advantage of this, I bought another 50 shares of

Microsoft at $199.78. Also, I observed the short term MACD chart being deeply in the negative.

As we discovered in week 2, a negative dip in a short term MACD chart is a great indicator that

the market is looking upwards in the near future. It is good to keep in mind that the short term

MACD may be negative, but overall, Microsoft MACD is well above 0 constantly, showing that

it is a great buy overall, but in short term markets that we are dealing with, the signs of a long term

and short term MACD may be seen as counter intuitive.

 35
Figure 3-7: Microsoft stock trend over Week 3 (7/27 - 7/31) from MarketWatch

As for Netflix, I missed my opportunity to sell my shares during the beginning part of the week

where the MACD was high as can be seen in Figure 3.8, as I was more involved with other stocks.

However, I will be holding on to Netflix for this week. This is because Netflix is scheduled to

release news on new shows and movies it will be releasing for the coming weeks, an indicator for

whether Netflix will be going up or down in the near future.

 Figure 3-8: Netflix stock trend over Week 3 (7/27 - 7/31) from MarketWatch

 36
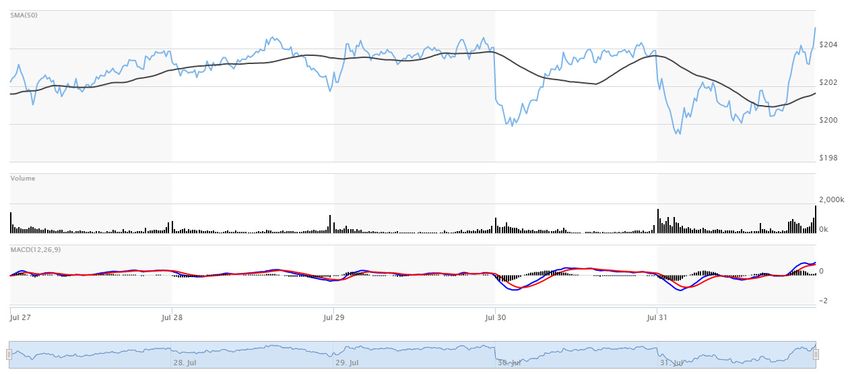
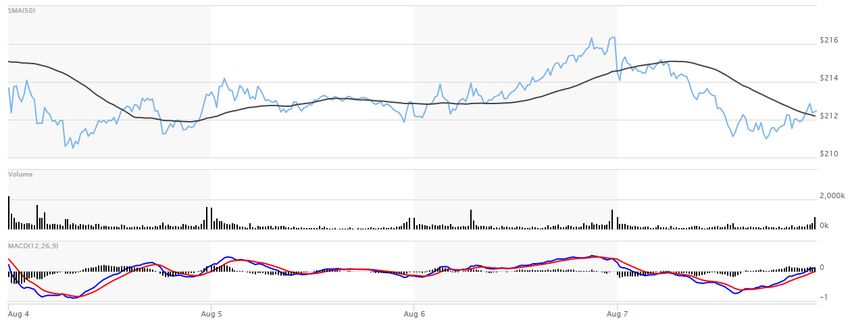
Buy/ Net Cost/ Profit/ Total
 Date Symbol Price Shares Total Profit
 Sell Proceeds Loss Cash

 7/28/2020 MSFT Buy $202.17 50 $10,108.50 $0.00 $32,451.50 -$3,758.40

 7/29/2020 MSFT Sell $204.01 100 $20,401.00 $157.50 $52,852.50 -$3,600.90

 7/30/2020 MSFT Buy $200.21 200 $40,042.00 $0.00 $12,810.50 -$3,600.90

 7/31/2020 MSFT Buy $199.78 50 $9,989.00 $0.00 $2,821.50 -$3,600.90

 Table 3-4: Week 3 Buys/Sells for Technical Trading Method

3.2.4 Week 4

During our final week of trading, I looked to selling the rest of my shares for the best profits. I did

see one great opportunity to buy more Microsoft shares as there was a large dip in the MACD as

can be seen on August 4. However, this is due to a large volume increase over the past weekend

as talks of purchasing Tiktok increased over the weekend and the rumors were confirmed on

Sunday, 8/2/20. On Monday, Microsoft increased from $205.01 to $216.54. I decided this was a

great time to exit the market with my remaining shares from the previous week. To reduce risk, I

decided to sell the rest of my shares during this increase in price, as talks of buying Tiktok were

scheduled to be finished by September, meaning nothing was guaranteed in the price of Microsoft.

I sold my 330 shares of Microsoft at $215.49. Giving me a large return on my investment and

making up for the money I had lost in this account from the Netflix earnings in Week 2. As can be

seen in figure 3.9, Microsoft did have a large peak on August 6, however, sometimes, it is best to

get out while you can. I exited at an entry price of $215.49, well above my average purchase price.

Even though I am a dollar below the average price on the 7th, the purpose of this project was to be

 37
able to know when to exit a market as well, learning patterns in the fluctuation of a company based

off of MACD and market news.

 Figure 3-9: Microsoft Stock trend over Week 4 (8/3 - 8/7) from MarketWatch

As for Netflix, we saw a steady line during week 4, with a steep sell off at the end of the week,

due to news that some shows and movies would be delayed due to COVID-19. Although a smart

move by Netflix to protect its employees, it took a $20 hit on the stock price. Thankfully, with

such a peaked MACD on the 4th of August, as can be seen in Figure 3.10, I sold my remaining

shares at $509.81. Although we did not come out anywhere near our initial purchase price at

$568.52, we were able to cover our losses with the gains in Microsoft.

 38
Figure 3-10: Netflix Stock trend over Week 4 (8/3 - 8/7) from MarketWatch:

 Buy/ Net Cost/ Profit/ Total
 Date Symbol Price Shares Total Cash
 Sell Proceeds Loss Profit

 8/3/2020 MSFT Sell $215.49 330 $71,111.70 $10128.90 $73,933.20 6528.00

 8/4/2020 NFLX Sell $509.81 60 $30,588.60 -$2740.00 $104,521.80 $4521.80

 Table 3-5: Week 4 Buys/Sells for Technical Trading Method

3.3 Results

Overall, we were able to net a profit of $4521.80, after being considerably down during week 2.

At the lowest point during week 2, the account total was asset was more than $10,000 under the

starting $100,000. I was originally discouraged by this huge set back. The current market is quite

volatile due to the pandemic, and this has made the market quite unpredictable since March. The

greatest take away from the technical trading was to view the MACD of a stock. By comparing

the short term and long term MACD, a trader can observe simple patterns within a stock. By also

observing that markets are most volatile during the peak initial and last hour of the market, a lot

 39
of my time was spent observing these times and looking for large volatility. During these peak

hours and premarket, observing deep negative MACD was typically preceded by a large buy in at

the lower price and vice versa. This MACD does need to be compared at different chart ranges of

1 day, to 5 days, to 1 month, and larger ranges to view the overall trends of a stock. Using this

technique, I was able to net a profit from Microsoft and cover my heavy losses from Netflix with

an overall net profit in the entire account of 4521.80, a 4.52% increase in the overall portfolio to

the account. Considering the large setback within the first two weeks, I think this profit over a

short period of time of 4 weeks was a great result.

 40
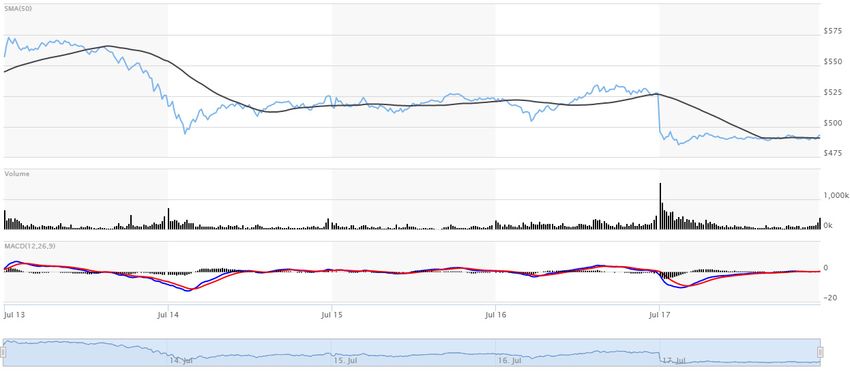
4 Swing Trading

In this section, we will be recording our process and analysis through swing trading. We will again

be choosing companies within the technology and consumer directory industries to easily be able

to compare companies that should overall be affected by the same things. We’ll be using the

concepts within fundamental analysis while swing trading.

4.1 Companies Chosen

For our technology company, we will be choosing Apple and for our consumer directory, we will

be choosing Disney. Apple is a company that had been hit hard with the initial pandemic in March

2020. However, they have done well throughout the second quarter and into the third quarter of

the year. With people stuck inside, consumers are flocking towards technology companies for

something to do. Disney on the other hand is on a resurgence with a similar idea in mind. With

people at home, Disney Plus is gaining traction, just like it’s competitor Netflix.

Apple was founded by Steve Jobs, Steve Wozniak, and Ronald Wayne in 1976 as a computer

company. Throughout the years, they have developed a niche department of elitist technology,

boasting the great technology at an expensive price. Their products range from phones, tablets,

laptops, and computers. Overall, they have a loyal consumer base that will always buy their

consumer technology. Apple first went public in 1980 at $22.00 per share.

As of 7/13/20, Apple is at $390.40 pre-market. On their last quarterly report, they had a revenue

of $58.3 billion, a 36.49% decrease from their last quarter. Their net income was $22.2 billion a

40.09% decrease from their last quarter. With the introduction of COVID-19 pandemic, the sales

of Apple have fluctuated greatly, however, the company has rebounded. Although there were

drastic sell offs during the initial wave of the pandemic, an increase of online workflow has

 41
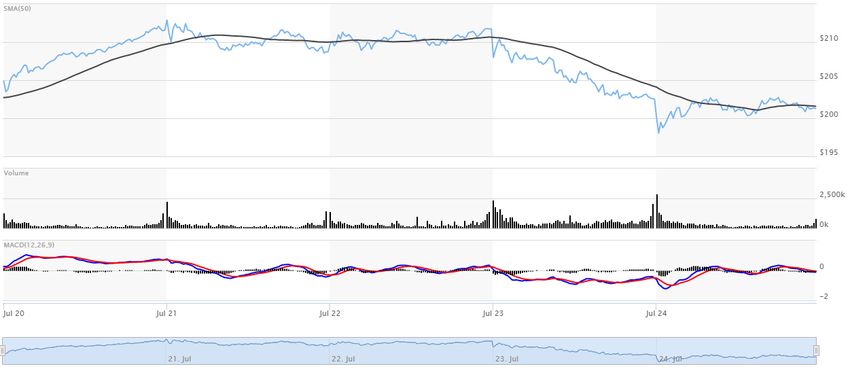
required the increased purchase of consumer technology such as MacBook. Apple has also seen a

great increase in the App Store sales, increased by 23% compared to 2019. In Figure 4.1, we can

see Apple stock growth over the past 5 years. Over the past 5 years, Apple has had a 221.85%

growth, starting at $121.30 in July of 2015.

 Figure 4-1: Apple stock trend over 5 years (July 2015 - July 2020) from MarketWatch

Disney in comparison is a much older company. Disney was founded in 1923 by Walt and Roy

Disney. From its inception, it was an entertainment company. Disney has produced multiple films

such as The Lion King and Mulan and have created large amusement parks such as Disney World

and Disney Land. Disney first went public in 1956 at $13.88 per share.

As of 7/13/20, Disney is at $119.19 pre-market. On their last quarterly report, they had a revenue

of $18.01 billion, a 13.66% decrease from the previous quarter. Their net income was $475 million,

a 77.38% decrease from the previous quarter. These numbers are quite drastic, and it is obvious

that the pandemic has had a large impact on the company. However, the company is gaining

traction for the next quarter, as their online streaming has gained large traction with Disney Plus,

Hulu, and online sports streaming has gained huge subscriptions. Between March 28, 2020 and

May 4, 2020, Disney Plus gained 21 million subscribers, totaling 54.5 million subscribers as of

May 4th. This number is only to have increased over the past two months, as the pandemic has

continued to keep people at home. In Figure 4.2, we can see Disney stock growth over the past 5

 42
You can also read