Deep Reinforcement Learning in Agent Based Financial Market Simulation - MDPI
←
→
Page content transcription
If your browser does not render page correctly, please read the page content below
Journal of
           Risk and Financial
           Management

Article
Deep Reinforcement Learning in Agent Based Financial
Market Simulation
Iwao Maeda 1, *, David deGraw 2 , Michiharu Kitano 3 , Hiroyasu Matsushima 1 , Hiroki Sakaji 1 ,
Kiyoshi Izumi 1 and Atsuo Kato 3
 1    Department of Systems Innovation, School of Engineering, The University of Tokyo, Tokyo 113-8654, Japan;
      matsushima@sys.t.u-tokyo.ac.jp (H.M.); sakaji@sys.t.u-tokyo.ac.jp (H.S.); izumi@sys.t.u-tokyo.ac.jp (K.I.)
 2    Daiwa Securities Co. Ltd., Tokyo 100-0005, Japan; david.degraw@daiwa.co.jp
 3    Daiwa Institute of Research Ltd., Tokyo 135-8460, Japan; michiharu.kitano@dir.co.jp (M.K.);
      atsuo.kato@dir.co.jp (A.K.)
 *    Correspondence: d2018imaeda@socsim.org

 Received: 28 February 2020; Accepted: 8 April 2020; Published: 11 April 2020

 Abstract: Prediction of financial market data with deep learning models has achieved some level of recent
 success. However, historical financial data suffer from an unknowable state space, limited observations,
 and the inability to model the impact of your own actions on the market can often be prohibitive when
 trying to find investment strategies using deep reinforcement learning. One way to overcome these
 limitations is to augment real market data with agent based artificial market simulation. Artificial market
 simulations designed to reproduce realistic market features may be used to create unobserved market
 states, to model the impact of your own investment actions on the market itself, and train models
 with as much data as necessary. In this study we propose a framework for training deep reinforcement
 learning models in agent based artificial price-order-book simulations that yield non-trivial policies under
 diverse conditions with market impact. Our simulations confirm that the proposed deep reinforcement
 learning model with unique task-specific reward function was able to learn a robust investment strategy
 with an attractive risk-return profile.

 Keywords: deep reinforcement learning; financial market simulation; agent based simulation

1. Introduction
      In recent years, applications of deep learning to predicting financial market data have achieved some
level of success (Chong et al. 2017; Long et al. 2019; Lahmiri and Bekiros 2019, 2020). However, issues such as
heteroskedasticity Nelson (1991), low signal-to-noise Aaker and Jacobson (1994), and the large observer effect
seen in market impact, make their use in real-world applications challenging. Furthermore, the predictive
ability of deep learning models is highly dependent on the data used in training, and for samples with
“unknown” features (also known as out-of-distribution samples (Lee et al. 2018)), these models can make
surprisingly nonsensical predictions and is a critical issue when applying deep learning models to real world
tasks (Sensoy et al. 2018).
      In financial areas, there are models for providing automated financial advice or investment management
called robo-advisors (Leong and Sung 2018; Sironi 2016). Robo-advisors predict future market states and determine
actions according to their predictions. Therefore, poor predictions could potentially lead to unacceptable levels of
risk and large losses of capital. As a common financial disclaimer states that “past performance is not a guarantee

J. Risk Financial Manag. 2020, 13, 71; doi:10.3390/jrfm13040071                          www.mdpi.com/journal/jrfm
J. Risk Financial Manag. 2020, 13, 71 2 of 17
of future returns”, the fundamental difficulty is that past data is often a poor predictor of the future (Silver 2012),
and complex dynamical properties of financial markets (Arthur 1999) make it difficult to incorporate prior
knowledge about the target distribution. Financial practitioners have traditionally been limited to training models
with past data and do not have many options for improving their predictive models (Bailey et al. 2014). Moreover,
such “back-testing” of models cannot account for transaction costs or market impact, both of which can be of
comparable magnitude to the forecast returns (Hill and Faff 2010).
In order to overcome such issues, we argue that artificial market simulation provides a promising avenue for
improving the predictive ability of deep reinforcement learning models. Agent-based artificial market simulation
is an established and widely studied methodology (Raberto et al. 2001; Streltchenko et al. 2005) that has been
shown to be of practical significance as alternatives to real markets (Brewer et al. 2013; Muranaga et al. 1999;
Raberto et al. 2001). One of the main advantages of simulated markets is that they can be adapted to create
realistic scenarios and regimes that have never been realized in the past (Lux and Marchesi 1999; Silva et al.
2016). Multi-agent simulation is a system of environment and agents where the actions of agents are informed by
the environment and the state of the environment evolves, in turn, through the actions of the agents. Typically,
in financial simulations, the market is designated as the environment where assets are transacted by an ensemble
of agents modeled after investors and whose behavior is governed by reductive formulas.
Efforts to learn deep reinforcement learning (DRL) strategies on environmental simulators have been
successful in various domains (Gu et al. 2017; Gupta et al. 2017; Li et al. 2016) and shown to attain or exceed
human-level performance on highly complex reward-maximizing gameplay tasks (Mnih et al. 2013, 2015)
such as GO and StarCraft II (Vinyals et al. 2019). Deep reinforcement learning agents base their actions
on predictions about the environment, and train their networks to maximize their cumulative rewards
obtained through their individual actions. As mentioned previously, models trained in simulation with
DRL are understood to derive their superior predictive ability from having trained across more different
scenarios than can be experienced by any one human in a lifetime.
Another advantage of agent simulations is that DRL models can be trained in an environment with
realistic transaction costs and market impact (Donier et al. 2015). Market impact is the influence of your
own investment actions on market states and is understood to adversely affect investment returns. Market
impact is something that cannot be reproduced from historical data alone since the relationships between
actions and effects cannot be replicated in such back-testing.
Previous simulation and deep reinforcement learning research in finance (Raman and Leidner 2019;
Ritter 2018; Spooner et al. 2018) has been limited by overly simplistic agents with a limited action space.
In contrast, our proposed agent based framework for training DRL agents yield sophisticated trading
strategies that achieve robust risk-return profiles under diverse conditions with market impact and
transaction costs.
The main contributions of our current work are as follows:
1. Proposal and verification of a deep reinforcement learning framework that learns meaningful trading
strategies in agent based artificial market simulations
2. Effective engineering of deep reinforcement learning networks, market features, action space,
and reward function.
2. Related Work
2.1. Stock Trading Strategies
Stock trading strategies have been studied for a long time (LeBaron 2002). Traditionally, dynamic
model-based approaches apply simple rules and formulas to describe trader behavior, such as the sniping
strategy (Rust et al. 1992), the Zero intelligence strategy (Ladley 2012), and the risk-based bidding strategyJ. Risk Financial Manag. 2020, 13, 71 3 of 17
(Vytelingum et al. 2004). In recent years, reinforcement learning (RL) methods (Dayan and Balleine 2002;
Sutton et al. 1998), especially deep reinforcement learning (DRL) methods (Mnih et al. 2013, 2015) have
been applied to learning investment strategies (Meng and Khushi 2019; Nevmyvaka et al. 2006), such as
DRL for financial portfolio management (Jiang et al. 2017), market making via reinforcement learning
(Spooner et al. 2018), and DRL for price trailing (Zarkias et al. 2019).
2.2. Deep Reinforcement Learning
DRL (as well as RL) is roughly classified into two types—value based and policy based approaches.
Value based deep reinforcement learning methods (Littman 2001) approximate value functions called
Q-functions using deep neural networks, and actions with maximum Q-functions are selected. Rainbow
(Hessel et al. 2018) claims that combination of major methodologies in DRL, such as double DQN
(Van Hasselt et al. 2016) and dueling network (Wang et al. 2015) improves performance of DQN drastically.
General reinforcement learning architecture (Gorila) (Nair et al. 2015) provided a parallel training
procedure for fast training. Ape-X (Horgan et al. 2018) proposed an algorithm for distributed processing
of prioritized experience replay (Schaul et al. 2015). On the other hand, policy based deep reinforcement
learning methods (Sutton et al. 2000) approximate the optimal policy directly using deep neural networks.
Especially, actor-critic methods which train actor and critic functions simultaneously have been intensely
studied, such as asynchronous advantage actor-critic (A3C) (Mnih et al. 2016), deep deterministic policy
gradient (DDPG) (Silver et al. 2014), and trust region policy optimization (TRPO) (Schulman et al. 2015).
DRL is applied to various tasks such as table games (Silver et al. 2016, 2017) video games (Lample
and Chaplot 2017; Mnih et al. 2013), autonomous driving (Pan et al. 2017; Sallab et al. 2017), and robotic
manipulation (Gu et al. 2017; Kalashnikov et al. 2018).
2.3. Financial Market Simulation
Financial market simulation has been used for investigating market microstructure
(Muranaga et al. 1999) and financial market regulations (Mizuta 2016). In particular, multi agent
financial market simulation (LeBaron et al. 2001; Lux and Marchesi 1999; Samanidou et al. 2007) is commonly
used. In early agent based simulations, such as the rebalancers and portfolio insurers model (Kim and
Markowitz 1989) and the econophysics approach (Levy et al. 1994), were not able to have realistic time
series characteristics called stylized facts (Harvey and Jaeger 1993; Levine and Demirgüç-Kunt 1999).
In subsequent studies, however, stylized facts have been observed by approaches such as application of
percolation theory (Solomon et al. 2000; Stauffer 2001), and fundamentalist and chartist model (Lux and
Marchesi 1999). In this study, virtual markets are created using such a simulation theory.
3. Simulation Framework Overview
The overview of our proposed framework is shown in Figure 1. The simulator consists of markets and
agents where markets play the role of the environment whose state evolves through the actions of agents.
Each agent, in turn, decides its action according to observations of the markets’ states. We incorporate
a degree of randomness in the agents’ selection of actions and the objective of the agents is to maximize
their capital amount cap calculated with the following equation.
cap = cash + ∑ pMid,i posi , (1)
i
where cash, pMid,i , and posi are the amount of cash, the midprice of instrument i, and quantity of
instrument i, respectively. In each simulation step, we sample from a distribution of agents until we findJ. Risk Financial Manag. 2020, 13, 71 4 of 17
one that submits an order. Subsequently, the market order book is updated with the submitted order.
The parameters of the DRL agent model is trained at a fixed time intervals of the simulation.
Figure 1. Overview of the simulation framework proposed in this research. The simulator consists of markets
and agents where markets play the role of the environment whose state evolves through the actions of the
agents. There are two types of agents—deep reinforcement learning (DRL) agent and fundamental-chart-noise
(FCN) agents. The objective of the agents is to maximize their capital amount. In each step of simulation,
an agent to submit an order is sampled, the agent submits an order, and markets process orders and update
their orderbooks. The DRL model in the DRL agent is trained in a certain time intervals.
4. Simulator Description
4.1. Markets
Our simulated orderbook market consists of an instrument, prices, quantities, and side (buy or sell).
An order must specify these four properties as well as an order type from the below three:
• Limit order (LMT)
• Market order (MKT)
• Cancel order (CXL)
The exceptions are that MKT orders do not need to specify a price, and CXL orders do not need to
specify quantity since we do not allow volume to be amended down in our simulation (i.e., CXL orders
can only remove existing LMT or MKT orders).
Market pricing follows a continuous double auction Friedman and Rust (1993). A transaction occurs
if there is a prevailing order on the other side of the orderbook at a price equal to or better than that
of the submitted order. If not, the order is added to the market orderbook. When there are multiple
orders which meet the condition, the execution priority is given in order of price first, followed by time.
CXL orders remove the corresponding limit order from the orderbook, and fails if the target order has
already been executed.
The transaction volume v is determined by:
v = min(vbuy , vsell ), (2)J. Risk Financial Manag. 2020, 13, 71 5 of 17
where vbuy and vsell are submitted volumes of buy and sell orders.
After v is determined, stock and cash are exchanged according to the price and transaction volume
between the buyer and seller. Executed buy and sell orders are removed from the orderbook if v = vbuy or
v = vsell , and change to volume vbuy − v or vsell − v otherwise.
Additionally, we define a fundamental price p F for each market. The fundamental price represents
the fair price of the asset/market and observable only by FCN agents (not the DRL agents) and is used to
predict future prices. The fundamental price changes according to a geometric Brownian motion (GBM)
Eberlein et al. (1995) process.
Markets required the following hyperparmeters:
• Tick size
• Initial fundamental price
• Fundamental volatility
Tick size is the minimum price increment of the orderbook. The initial fundamental price and
fundamental volatility are parameters of the GBM used to determine the fundamental price.
4.2. Agents
Agents registered to the simulator are classified into the following two types:
• Deep Reinforcement Learning (DRL) agent
• Fundamental-Chart-Noise (FCN) agent
The DRL agent is the agent we seek to train, while the FCN agents comprise the environment of
agents in the artificial market. Details of the DRL agent are described in Section 5.1.
The FCN agent (Chiarella et al. 2002) is a commonly used financial agent and predicts the log return r
of an asset with a weighted average of fundamental, chart, and noise terms.
1
r= ( w F F + wC C + w N N ). (3)
w F + wC + w N
Each terms is calculated by the following equations below. The fundamental term F represents the
difference between the reasonable price considered by the agent and the market price at the time, the chart
term C represents the recent price change, and the noise term N is sampled from a normal distribution.
1 p∗
F= log( t ) (4)
T pt
1 pt
C= log( ) (5)
T pt−τ
N ∼ N (µ, σ2 ). (6)
pt and p∗t are current market price, fundamental price, and τ is the time window size, respectively.
p∗t changes according to a geometric Brownian motion (GBM). Weight values w F , wC , and w N are
independently random sampled from exponential distributions for each agent. The scale parameters σF ,
σC , and σN are required for each simulation. Parameters of the normal distribution µ and σ are fixed to 0
and 0.0001.
The FCN agents predict future market prices pt+τ from the predicted log return with the
following equation:
pt+τ = pt exp(rτ ). (7)J. Risk Financial Manag. 2020, 13, 71 6 of 17
The agent submits a buy limit order with price pt+τ (1 − k ) if pt+τ > pt , and submits a sell limit
order with price pt+τ (1 + k) if pt+τ < pt . The parameter k is called order margin and represents the
amount of profit that the agent expects from the transaction. The submitting volume v is sampled from
a discrete uniform distribution u{1, 5}. In order to control the number of outstanding orders in the market
orderbook, each order submitted by the FCN agents has a time window size, after which the order is
automatically canceled .
4.3. Simulation Progress
Simulation proceeds by repeating the order submission by the agents, order processing by the markets,
and updating the fundamental prices at the end of each step. The first 1000 steps are pre-market-open
steps used to build the market orderbook and order processing is not performed.
Each order action consists of order actions by the FCN and DRL agents. FCN agents are randomly
selected and given a chance to submit an order. The FCN agent submits an order according to the strategy
described in Section 4.2 with probability 0.5 and does nothing with probability 0.5. If the FCN agent submits
an order, the order is added to the orderbook of the corresponding market. Similarly, an actionable DRL
agent is selected, and the DRL agent submits an order according to the prediction made from observing
the market state. The DRL agent may act again after an interval sampled from a normal distribution
N (100, 102 ).
Once an agent submits an order, the market processes the order according to the procedure described
in Section 4.1. After processing the orders, each market deletes orders that have been posted longer than
the time window size of the relevant agent.
In the final step, each market updates its fundamental price according to geometric Brownian motion.
Additionally, training of the DRL agent is performed at a fixed interval. The DRL agent collects recent
predictions and rewards from the simulation path and updates its policy gradients.
5. Model Description
5.1. Deep Reinforcement Learning Model
DRL uses deep learning neural networks with reinforcement learning algorithms to learn optimal
policies for maximizing an objective reward. In this study, deep reinforcement learning models are
trained to maximize the financial reward, or returns, of an investment policy derived from observations of,
and agent actions in, a simulated market environment.
Various types of deep reinforcement learning methods are used in financial applications depending on the
task (Deng et al. 2016; Jiang and Liang 2017; Jiang et al. 2017). In this study, we used advantage-actor-critic (A2C)
network (Mnih et al. 2016). An A2C network is a version of actor-critic network (Konda and Tsitsiklis 2000),
and has two prediction paths, one for the actor and one for the critic network. The actor network approximates
and optimal policy π(at |st ; θ ) (Sutton et al. 2000), while the critic network approximates the state value V (st ; θv ),
respectively. The gradient with respect to the actor parameters θ takes the form ∇θ log(π(at |st ; θ ))(Rt −
V (st ; θv )) + β∇θ Hπ(at |st ; θ )), where Rt is the reward function, H is the entropy and β is the coefficient.
The gradient with respect to the critic parameters θv takes the form ∇θv (Rt − V (st ; θv ))2 .
5.2. Feature Engineering
The price series is comprised of 20 contiguous time steps taken at 50 time step intervals of four market
prices—the last (or current) trade price, best ask (lowest price in sell orderbook), best bid (highest price in
buy orderbook), and mid price (average of best ask and best bid). Each price series is normalized by the
price values of the first row.J. Risk Financial Manag. 2020, 13, 71 7 of 17
The orderbook features are arranged in a matrix of the latest orderbook and summarize order volumes
of upper and lower prices centered at the mid price. Order volumes of all agents and the predicting agent
are aggregated at each price level. To distinguish buy and sell orders, buy order volumes are recorded as
negative values. The shape of each orderbook feature is 20 × 2.
The agent features consist of cash amount, and stock inventory of each market. The shape of the
agent feature is 1 + nMarket , where nMarket is the number of markets.
5.3. Actor Network
The actor network outputs action probabilities. Each action has the following five parameters:
• Side: [Buy, Sell, Stay]
• Market: [0, 1, . . . ]
• Type: [LMT, MKT, CXL]
• Price: [0, 2, 4, 6, 8, 10]
• Volume: [1, 5]
Side indicates the intent of the order. When side is “Stay”, the other four parameters are ignored and
no action is taken. Market indicates the target market. Price is the difference of submitting price from the
best price (i.e., depth in the orderbook), and the submitting price p is calculated by the following equation:
(
pBestAsk − Price (Action = Buy)
p= (8)
pBestBid + Price (Action = Sell).
Both price and volume are used when type is LMT, and only volume is used when type is MKT.
When type is CXL, we allow whether to cancel the order with highest price or lowest price. Finally,
the number of all actions nAll is calculated as:
nAll = 2nMarket (nPrice nVolume + nVolume + 2) + 1, (9)
where nMarket , nPrice , and nVolume indicate the number of markets, price categories, and volume
categories, respectively.
Agents select actions by roulette selection with the output probability. Additionally, DRL agents
perform random action selection with probability e according to the epsilon greedy strategy (Sutton and
Barto 2018).
5.4. Reward Calculation
A typical objective for financial trading agents is to maximize their capital amount calculated by the
following equation.
cap = cash + ∑ pMid,i posi . (10)
i
The reward should then be some function that is proportional to the change in capital amount.
For this study, two reward functions are used: the capital-only reward RCO , and the liquidation-value
reward RLV . RCO is calculated as the difference between the capital after investment capa and the baseline
capital capb . The baseline capital was calculated with amount of cash and inventory without investment.
RCO = capt+τ − capt (11)J. Risk Financial Manag. 2020, 13, 71 8 of 17
capt+τ = casht+τ + ∑ pMid,i,t+τ posi,t+τ (12)
i
capt = casht + ∑ pMid,i,t posi,t , (13)
i
where t and τ are the time of action and the time constant, respectively.
On the other hand, RLV is the calculated as the difference between the liquidation value after
investment LV a and the baseline liquidation value LV b . The liquidation value is defined as the cash
amount that would remain if the entire inventory was instantly liquidated. If the inventory cannot be
liquidated within the constraints of the current market orderbook, the remaining inventory is liquidated
with a penalty price (0 for long inventory and 2pMarket for short inventory).
RLV = LV t+τ − LV t . (14)
The liquidation value LV strongly correlates to cap but carries a penalty proportional to the magnitude
of the inventory. The capital-only reward includes no penalty to the inventory value, and use of it may
cause training of risky strategies (Fama and French 1993). We anticipate the use of RLV may be effective in
training DRL strategies that balance inventory risk with trading reward.
In training, calculated rewards are normalized for each training batch with the following equation.
Ri
Ri0 = p . (15)
E [ R2 ]
In addition, a penalty value R p is add to the normalized reward when the action selected by the DRL
agent was infeasible at the action phase (inappropriate cancel orders etc.). R p was set to −0.5.
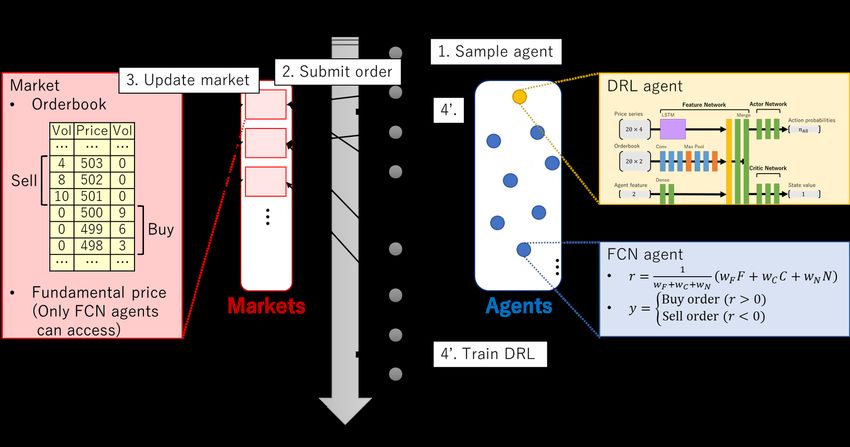
5.5. Network Architecture
Overview of the A2C network used in this research is shown in Figure 2. As the number of markets is
1 in this research, the length of agent features is 2. The network consist of three networks—a market feature
network, an actor network, and a critic network. The market feature network uses a long short-term
memory (LSTM) (Hochreiter and Schmidhuber 1997) layer to extract features from the market price series
according to previous studies (Bao et al. 2017; Fischer and Krauss 2018), as well as convolutional neural
network (CNN) layers to extract orderbook features that have positional information (Tashiro et al. 2019;
Tsantekidis et al. 2017). The agent features are extracted by dense layers and the actor network outputs
action probabilities while the critic network outputs predicted state values. ReLU activation is applied to
the convolutional and dense layers in the network except for the last layers of actor and critic networks
which use softmax activation so that the action probability outputs sum to unity.J. Risk Financial Manag. 2020, 13, 71 9 of 17
Figure 2. Overview of the A2C network used in this research (nmarket = 1). The network takes price series,
orderbook feature and agent feature as input variables and outputs action probabilities and state values.
Purple, blue, orange, green, and yellow boxes in the network represent LSTM, convolutional, max pooling,
dense, and merge layers, respectively. LSTM layers have tangent hyperbolic activation. Convolutional and
dense layers except the last layers of actor and critic networks have ReLU activation. Action probabilities
are calculated by applying softmax activation to the output of actor network.
6. Experiments
Experiments were performed using the simulator and deep reinforcement learning model described
in previous sections. The purpose of the experiments is to investigate following questions:
1. Whether the model can learn trading strategies on the simulator
2. Whether the learned strategies are valid
DRL models with the capital-only (CO) and liquidation-value (LV) reward functions (the CO-DRL and
LV-DRL models) were trained in one simulation and validated in a separate simulation. In the validation
simulations, DRL models select actions only by their network outputs and do not perform random action
selections. Each simulation consists of 100 sub simulations which have 1,000,000 steps (total 100,000,000
steps). Each sub simulation has different simulator and agent parameter settings. For comparison, a model
that selects actions randomly (with the same probability) from the same action set as the DRL models was
trained in the same simulations.
Model performances were compared along the following benchmarks:
• Average reward R
• Sharpe ratio S p
• Maximum drawdown MDD
Average reward is the average of all actions of the agent in simulation. Sharpe ratio S p (Sharpe 1994)
is a metric for measuring investment efficiency and calculated by following equation:
E[ R a − Rb ]
Sp = p , (16)
Var[ R a − Rb ]J. Risk Financial Manag. 2020, 13, 71 10 of 17
where R a and Rb are returns of the investment and benchmark, respectively. In this study, Rb = 0 was
assumed. Maximum drawdown (MDD) MDD (Magdon-Ismail et al. 2004) is another metric used to
measure investment performance and calculated by the following equation:
P−L
MDD = , (17)
P
where P and L are the highest and lowest capital amount before and after the largest capital drop.
6.1. Simulator Settings
Some parameters of simulator and agents were fixed in all sub simulations, while others were
randomly sampled in each sub simulation.
The values/distributions of market parameters are shown below.
• Tick size pmin = 1
• Initial fundamental price p0∗ ∼ N (500, 502 )
• Fundamental volatility f ∼ N (0.0001, 0.000012 )
The values/distributions of parameters for FCN agents are shown below.
• Number of agents nFCN = 1000
• Scale of exponential distribution for sampling fundamental weights σC ∼ N (0.3, 0.032 )
• Scale of exponential distribution for sampling chart weights σC ∼ N (0.3, 0.032 )
• Scale of exponential distribution for sampling noise weights σN ∼ N (0.3, 0.032 )
• Time window size τ ∼ u(500, 1000)
• Order margin k ∼ u(0, 0.05)
The values/distributions of parameters for DRL agent are shown below.
• Initial inventory of DRL agent pos0 ∼ N (0, 102 )
• Initial cash amount of DRL agent cash0 = 35000 − p0 pos0
6.2. Results
Average rewards of each sub simulation in training and validation are shown in Figures 3 and 4.
Both figures represents average rewards of random, CO-DRL, and LV-DRL models. As shown, average
reward gradually improves as simulation progresses in both DRL models, but at a lower rate and overall
magnitude in the CO-DRL model. Similarly in validation, the average rewards of the LV-DRL model are
orders of magnitude higher than the other models across all sub simulations.J. Risk Financial Manag. 2020, 13, 71 11 of 17
0.50
Average reward 0.25
0.00
0.25 Random
CO-DRL
0.50 LV-DRL
0 20 40 60 80 100
Sub simulation
Figure 3. Average rewards of each sub simulation in training. Blue, orange and green lines represents
average rewards of random, capital only-deep reinforcement learning (CO-DRL), and liquidation-value
deep reinforcement learning (LV-DRL) models.
0.6
Average reward
0.4
0.2 Random
CO-DRL
0.0 LV-DRL
0 20 40 60 80 100
Sub simulation
Figure 4. Average rewards of each sub simulation in validation. Orange and blue lines represents average
rewards of deep reinforcement learning (DRL) and random (baseline) models.
Model performance in training and validation simulations are shown in Table 1. Table 1 shows the
mean and standard deviation of the average rewards , Sharpe ratios, and maximum drawdowns across
the sub simulations. The evaluation metrics clearly show that the LV-DRL agent outperforms the others
across all benchmarks. We can see that the liquidation-value reward function was instrumental for the
DRL agent to learn a profitable trading strategy that simultaneously mitigates inventory risk.
Table 1. Model performances of random, CO-DRL, and LV-DRL models. R, S p , and MDD are average
reward, Sharpe ratio, and maximum drawdown. Indices in the table are mean and standard deviation of
sub simulations.
Training Simulation Validation Simulation
Model R↑ Sp ↑ MDD ↓ R↑ Sp ↑ MDD ↓
Random −0.035 ± 0.017 0.005 ± 0.005 0.111 ± 0.143 −0.038 ± 0.018 0.005 ± 0.007 0.110 ± 0.104
CO-DRL 0.004 ± 0.025 0.009 ± 0.006 0.144 ± 0.196 0.020 ± 0.023 0.009 ± 0.006 0.124 ± 0.178
LV-DRL 0.402 ± 0.236 0.043 ± 0.023 0.049 ± 0.137 0.530 ± 0.079 0.053 ± 0.019 0.012 ± 0.004
The capital change during sub simulations in validation are shown in Figure 5 and illustrate important
features of the LV-DRL model under different scenarios. In result (a), the capital of the LV-DRL modelJ. Risk Financial Manag. 2020, 13, 71 12 of 17
continues to rise through sub simulation despite a falling market. We see the LV-DRL model tends to
keep the absolute value of its inventory near 0, and that capital swings are smaller than other two models.
Result (b) shows a case where the CO-DRL model slightly outperforms in accumulated capital, but we
see that this strategy takes excessive inventory risk, causing large fluctuations in capital. In contrast,
the LV-DRL model achieves a similar level of capital without large swings at a much lower level of
inventory, leading to a higher Sharpe ratio.
(a) 9th Sub simulation (b) 4th Sub simulation
60000 80000
50000 60000
Capital
Capital
40000 40000
Random Random
CO-DRL CO-DRL
30000 LV-DRL LV-DRL
20000
200 1000
750
100
Position
Position
500
0 Random 250 Random
CO-DRL CO-DRL
100 LV-DRL 0 LV-DRL
480
480
470
460 460
Mid price
Mid price
450
440
440
420 430
420
400
0 200000 400000 600000 800000 1000000 0 200000 400000 600000 800000 1000000
Time Time
Figure 5. Example capital changes of sub simulations in validation. Both left and right columns show
changes of capital, inventory, and mid price in one typical sub simulation.
A histogram of action probabilities of the three models in validation is shown in Figure 6. The horizontal
axis shows 33 types of actions that can be selected by DRL agent. As explained in Section 5.3, actions of
models are parameterized by five factors: Intent (Stay, Buy, Sell), Market, Order type (LMT, MKT, CXL),
Price (difference from the base price in LMT and MKT orders, lowest or highest in CXL order), and Volume.
We ignore the market factor since we only have one market in these experiments. The horizontal axis labels
of Figure 6 actions are expressed by “Action-OrderType-Price-Volume”.
As shown in Figure 6, the LV-DRL agent can be seen to avoid inefficient actions such as orders with
unfavorable price and large volume, or cancel orders. The agent prefers to select buy and sell limit orders
with price difference 4 and 6 and volume 5 while limit orders with price difference 0 and volume 5, market
orders with volume 5, and cancel orders were rarely selected. Previous studies about high-frequency-trader
and market making indicate that traders in real markets have similar investment strategies to our LV-DRL
model (Hirano et al. 2019). On the other hand, since the reward function of the CO-DRL model does not
consider the inventory of the agent, the CO-DRL model seems to pursue a momentum-trend-following
strategy without much regard for risk. We also observe that the CO-DRL model submits more aggressiveJ. Risk Financial Manag. 2020, 13, 71 13 of 17
market orders than the LV-DRL model; another indication that the CO-DRL agent disregards costs and
risk in favor of capital gains.
0.10 CO-DRL
0.08 LV-DRL
Random
Probability
0.06
0.04
0.02
0.00
Buy-MKT--1.0
Sell-MKT--1.0
Buy-MKT--5.0
Sell-MKT--5.0
Stay---
Buy-LMT-0.0-1.0
Sell-LMT-0.0-1.0
Buy-LMT-2.0-1.0
Sell-LMT-2.0-1.0
Buy-LMT-4.0-1.0
Sell-LMT-4.0-1.0
Buy-LMT-6.0-1.0
Sell-LMT-6.0-1.0
Buy-LMT-8.0-1.0
Sell-LMT-8.0-1.0
Buy-LMT-10.0-1.0
Sell-LMT-10.0-1.0
Buy-LMT-0.0-5.0
Sell-LMT-0.0-5.0
Buy-LMT-2.0-5.0
Sell-LMT-2.0-5.0
Buy-LMT-4.0-5.0
Sell-LMT-4.0-5.0
Buy-LMT-6.0-5.0
Sell-LMT-6.0-5.0
Buy-LMT-8.0-5.0
Sell-LMT-8.0-5.0
Buy-LMT-10.0-5.0
Sell-LMT-10.0-5.0
Buy-CXL-Low-
Sell-CXL-Low-
Buy-CXL-High-
Sell-CXL-High-
Action
Figure 6. Action probabilities of three models in validation. The horizontal axis represents possible actions
which are expressed by “Action-Order type-Price(difference from the price of market order in limit (LMT)
and market (MKT) orders, lowest or highest in cancel (CXL) order)-Volume”.
7. Conclusions
In this study we were able to show that with the appropriate reward function, deep reinforcement
learning can be used to learn an effective trading strategy that maximizes capital accumulation without
excessive risk in a complex agent based artificial market simulation. It was confirmed that the learning
efficiency greatly differs depending on the reward functions, and the action probability distributions of
well-trained strategies were consistent with investment strategies used in real markets. While it remains to
be seen whether our proposed DRL model can perform in a real live financial market, our research shows
that detailed simulation design can replicate certain features of real markets, and that DRL models can
optimize strategies that adapt to those features. We believe that further consideration of realistic markets
(such as multiple markets, agents with various behavioral principles, exogenous price fluctuation factors,
etc.) will bring simulations closer to reality and enable creation of various DRL agents that perform well in
the real world, and more advanced analyses of real markets.
One of the limitations of the current work is that there is only one DRL agent. In order to consider a more
realistic market, we must simulate the interaction between various dynamic agents with differing reward
functions. In future work, we plan to look at the effect of introducing multiple DRL agents and examining
emergent cooperative and adversarial dynamics between the various DRL agents (Jennings 1995; Kraus 1997)
and how that affects market properties as well as learned strategies.
Author Contributions: Conceptualization, I.M.; methodology, I.M., D.d., M.K., K.I., H.S. and A.K.; investigation, I.M.;
resources, H.M. and H.S.; writing–original draft preparation, I.M. and D.d.; supervision, K.I.; project administration,
K.I. and A.K. All authors have read and agreed to the published version of the manuscript.J. Risk Financial Manag. 2020, 13, 71 14 of 17
Funding: This research received no external funding.
Conflicts of Interest: The authors declare no conflict of interest.
References
Aaker, David A., and Robert Jacobson. 1994. The financial information content of perceived quality. Journal of
Marketing Research 31: 191–201. [CrossRef]
Arthur, W. Brian. 1999. Complexity and the economy. Science 284: 107–9. [CrossRef] [PubMed]
Bailey, David H., Jonathan Borwein, Marcos Lopez de Prado, and Qiji Jim Zhu. 2014. Pseudo-mathematics and
financial charlatanism: The effects of backtest overfitting on out-of-sample performance. Notices of the American
Mathematical Society 61: 458–71. [CrossRef]
Bao, Wei, Jun Yue, and Yulei Rao. 2017. A deep learning framework for financial time series using stacked autoencoders
and long-short term memory. PLoS ONE 12: e0180944. [CrossRef] [PubMed]
Brewer, Paul, Jaksa Cvitanic, and Charles R Plott. 2013. Market microstructure design and flash crashes: A simulation
approach. Journal of Applied Economics 16: 223–50. [CrossRef]
Chiarella, Carl, and Giulia Iori. 2002. A simulation analysis of the microstructure of double auction markets.
Quantitative Finance 2: 346–53. [CrossRef]
Chong, Eunsuk, Chulwoo Han, and Frank C Park. 2017. Deep learning networks for stock market analysis and
prediction: Methodology, data representations, and case studies. Expert Systems with Applications 83: 187–205.
[CrossRef]
Dayan, Peter, and Bernard W Balleine. 2002. Reward, motivation, and reinforcement learning. Neuron 36: 285–98.
[CrossRef]
Deng, Yue, Feng Bao, Youyong Kong, Zhiquan Ren, and Qionghai Dai. 2016. Deep direct reinforcement learning for
financial signal representation and trading. IEEE Transactions on Neural Networks and Learning Systems 28: 653–64.
[CrossRef]
Donier, Jonathan, Julius Bonart, Iacopo Mastromatteo, and J.-P. Bouchaud. 2015. A fully consistent, minimal model for
non-linear market impact. Quantitative Fnance 15: 1109–21. [CrossRef]
Eberlein, Ernst, and Ulrich Keller. 1995. Hyperbolic distributions in finance. Bernoulli 1: 281–99. [CrossRef]
Fama, Eugene F., and Kenneth R. French. 1993. Common risk factors in the returns on stocks and bonds. Journal of
Financial Economics 33: 3–56. [CrossRef]
Fischer, Thomas, and Christopher Krauss. 2018. Deep learning with long short-term memory networks for financial
market predictions. European Journal of Operational Research 270: 654–69. [CrossRef]
Friedman, Daniel, and John Rust. 1993. The Double Auction Market: Institutions, Theories and Evidence. New York:
Routledge
Gu, Shixiang, Ethan Holly, Timothy Lillicrap, and Sergey Levine. 2017. Deep reinforcement learning for robotic
manipulation with asynchronous off-policy updates. Paper Presented at the 2017 IEEE International Conference
on Robotics and Automation (ICRA), Singapore, May 29–June 3, pp. 3389–96.
Gupta, Jayesh K., Maxim Egorov, and Mykel Kochenderfer. 2017. Cooperative multi-agent control using deep
reinforcement learning. Paper Presented at the International Conference on Autonomous Agents and Multiagent
Systems, São Paulo, Brazil, May 8–12, pp. 66–83.
Harvey, Andrew C., and Albert Jaeger. 1993. Detrending, stylized facts and the business cycle. Journal of Applied
Econometrics 8: 231–47. [CrossRef]
Hessel, Matteo, Joseph Modayil, Hado Van Hasselt, Tom Schaul, Georg Ostrovski, Will Dabney, Dan Horgan, Bilal Piot,
Mohammad Azar, and David Silver. 2018. Rainbow: Combining improvements in deep reinforcement learning.
Paper Presented at the Thirty-Second AAAI Conference on Artificial Intelligence, New Orleans, LO, USA,
February 2–7.
Hill, Paula, and Robert Faff. 2010. The market impact of relative agency activity in the sovereign ratings market.
Journal of Business Finance & Accounting 37: 1309–47.J. Risk Financial Manag. 2020, 13, 71 15 of 17
Hirano, Masanori, Kiyoshi Izumi, Hiroyasu Matsushima, and Hiroki Sakaji. 2019. Comparison of behaviors of actual
and simulated hft traders for agent design. Paper Presented at the 22nd International Conference on Principles
and Practice of Multi-Agent Systems, Torino, Italy, October 28–31.
Hochreiter, Sepp, and Jürgen Schmidhuber. 1997. Long short-term memory. Neural Computation 9: 1735–80. [CrossRef]
Horgan, Dan, John Quan, David Budden, Gabriel Barth-Maron, Matteo Hessel, Hado Van Hasselt, and David Silver.
2018. Distributed prioritized experience replay. arXiv arXiv:1803.00933.
Jennings, Nicholas R. 1995. Controlling cooperative problem solving in industrial multi-agent systems using joint
intentions. Artificial Intelligence 75: 195–240. [CrossRef]
Jiang, Zhengyao, and Jinjun Liang. 2017. Cryptocurrency portfolio management with deep reinforcement learning.
Paper Presented at the 2017 Intelligent Systems Conference (IntelliSys), London, UK, September 7–8, pp. 905–13.
Jiang, Zhengyao, Dixing Xu, and Jinjun Liang. 2017. A deep reinforcement learning framework for the financial
portfolio management problem. arXiv arXiv:1706.10059.
Kalashnikov, Dmitry, Alex Irpan, Peter Pastor, Julian Ibarz, Alexander Herzog, Eric Jang, Deirdre Quillen, Ethan Holly,
Mrinal Kalakrishnan, Vincent Vanhoucke, and et al. 2018. Qt-opt: Scalable deep reinforcement learning for
vision-based robotic manipulation. arXiv arXiv:1806.10293.
Kim, Gew-rae, and Harry M. Markowitz. 1989. Investment rules, margin, and market volatility. Journal of Portfolio
Management 16: 45. [CrossRef]
Konda, Vijay R., and John N Tsitsiklis. 2000. Actor-critic algorithms. In Advances in Neural Information Processing
Systems. Cambridge: MIT Press, pp. 1008–14.
Kraus, Sarit. 1997. Negotiation and cooperation in multi-agent environments. Artificial Intelligence 94: 79–97.
[CrossRef]
Ladley, Dan. 2012. Zero intelligence in economics and finance. The Knowledge Engineering Review 27: 273–86. [CrossRef]
Lahmiri, Salim, and Stelios Bekiros. 2019. Crypto. Chaos, Solitonscurrency Forecasting with Deep Learning Chaotic Neural
Networks & Fractals 118: 35–40.
Lahmiri, Salim, and Stelios Bekiros. 2020. Intelligent forecasting with machine learning trading systems in chaotic
intraday bitcoin market. Chaos, Solitons & Fractals 133: 109641.
Lample, Guillaume, and Devendra Singh Chaplot. 2017. Playing fps games with deep reinforcement learning. Paper
Presented at the Thirty-First AAAI Conference on Artificial Intelligence, San Francisco, CA, USA, February 4–9.
LeBaron, Blake. 2001. A builder’s guide to agent-based financial markets. Quantitative Finance 1: 254–61. [CrossRef]
LeBaron, Blake. 2002. Building the santa fe artificial stock market. School of International Economics and Finance, Brandeis.
1117–47
Lee, Kimin, Honglak Lee, Kibok Lee, and Jinwoo Shin. 2018. Training confidence-calibrated classifiers for detecting
out-of-distribution samples. Paper Presented at the International Conference on Learning Representations,
Vancouver, BC, Canada, April 30–May 3.
Leong, Kelvin, and Anna Sung. 2018. Fintech (financial technology): What is it and how to use technologies to create
business value in fintech way? International Journal of Innovation, Management and Technology 9: 74–78. [CrossRef]
Levine, Ross, and Asli Demirgüç-Kunt. 1999. Stock Market Development and Financial Intermediaries: Stylized Facts.
Washington, DC: The World Bank.
Levy, Moshe, Haim Levy, and Sorin Solomon. 1994. A microscopic model of the stock market: Cycles, booms, and
crashes. Economics Letters 45: 103–11. [CrossRef]
Li, Jiwei, Will Monroe, Alan Ritter, Dan Jurafsky, Michel Galley, and Jianfeng Gao. 2016. Deep reinforcement learning
for dialogue generation. Paper Presented at the 2016 Conference on Empirical Methods in Natural Language
Processing, Austin, TX, USA, November 1–5, pp. 1192–02. [CrossRef]
Littman, Michael L. 2001. Value-function reinforcement learning in markov games. Cognitive Systems Research 2: 55–66.
[CrossRef]
Long, Wen, Zhichen Lu, and Lingxiao Cui. 2019. Deep learning-based feature engineering for stock price movement
prediction. Knowledge-Based Systems 164, 163–73. [CrossRef]
Lux, Thomas, and Michele Marchesi. 1999. Scaling and criticality in a stochastic multi-agent model of a financial
market. Nature 397: 498–500. [CrossRef]J. Risk Financial Manag. 2020, 13, 71 16 of 17
Magdon-Ismail, Malik, Amir F. Atiya, Amrit Pratap, and Yaser S. Abu-Mostafa. 2004. On the maximum drawdown of
a brownian motion. Journal of Applied Probability 41: 147–61. [CrossRef]
Meng, Terry Lingze, and Matloob Khushi. 2019. Reinforcement learning in financial markets. Data 4: 110. [CrossRef]
Mizuta, Takanobu. 2016. A Brief Review of Recent Artificial Market Simulation (Agent-based Model) Studies for
Financial Market Regulations and/or Rules. Available online: https://ssrn.com/abstract=2710495 (accessed on
8 April 2020).
Mnih, Volodymyr, Adria Puigdomenech Badia, Mehdi Mirza, Alex Graves, Timothy Lillicrap, Tim Harley, David Silver,
and Koray Kavukcuoglu. 2016. Asynchronous methods for deep reinforcement learning. Paper Presented at the
International Conference on Machine Learning, New York, NY, USA, June 19–24, pp. 1928–37.
Mnih, Volodymyr, Koray Kavukcuoglu, David Silver, Alex Graves, Ioannis Antonoglou, Daan Wierstra, and
Martin Riedmiller. 2013. Playing atari with deep reinforcement learning. arXiv arXiv:1312.5602.
Mnih, Volodymyr, Koray Kavukcuoglu, David Silver, Andrei A. Rusu, Joel Veness, Marc G. Bellemare, Alex Graves,
Martin Riedmiller, Andreas K. Fidjeland, Georg Ostrovski, and et al. 2015. Human-level control through deep
reinforcement learning. Nature 518: 529–33. [CrossRef]
Muranaga, Jun, and Tokiko Shimizu. 1999. Market microstructure and market liquidity. Bank for International
Settlements 11: 1–28.
Nair, Arun, Praveen Srinivasan, Sam Blackwell, Cagdas Alcicek, Rory Fearon, Alessandro De Maria,
Vedavyas Panneershelvam, Mustafa Suleyman, Charles Beattie, Stig Petersen, and et al. 2015. Massively
parallel methods for deep reinforcement learning. arXiv arXiv:1507.04296.
Nelson, Daniel B. 1991. Conditional heteroskedasticity in asset returns: A new approach. Econometrica: Journal of the
Econometric Society 59: 347–70. [CrossRef]
Nevmyvaka, Yuriy, Yi Feng, and Michael Kearns. 2006. Reinforcement learning for optimized trade execution.
Paper Presented at the 23rd International Conference on Machine Learning, Pittsburgh, PA, USA, June 25–29,
pp. 673–80.
Pan, Xinlei, Yurong You, Ziyan Wang, and Cewu Lu. 2017. Virtual to real reinforcement learning for autonomous
driving. arXiv arXiv:1704.03952.
Raberto, Marco, Silvano Cincotti, Sergio M. Focardi, and Michele Marchesi. 2001. Agent-based simulation of a financial
market. Physica A: Statistical Mechanics and its Applications 299: 319–27. [CrossRef]
Raman, Natraj, and Jochen L Leidner. 2019. Financial market data simulation using deep intelligence agents. Paper
Presented at the International Conference on Practical Applications of Agents and Multi-Agent Systems, Ávila,
Spain, June 26–28, pp. 200–11.
Ritter, Gordon. 2018. Reinforcement learning in finance. In Big Data and Machine Learning in Quantitative Investment.
Hoboken: John Wiley & Sons, pp. 225–50.
Rust, John, Richard Palmer, and John H. Miller. 1992. Behaviour of trading automata in a computerized double auction
market. Santa Fe: Santa Fe Institute.
Sallab, Ahmad E. L., Mohammed Abdou, Etienne Perot, and Senthil Yogamani. 2017. Deep reinforcement learning
framework for autonomous driving. Electronic Imaging 2017: 70–6. [CrossRef]
Samanidou, Egle, Elmar Zschischang, Dietrich Stauffer, and Thomas Lux. 2007. Agent-based models of financial
markets. Reports on Progress in Physics 70: 409. [CrossRef]
Schaul, Tom, John Quan, Ioannis Antonoglou, and David Silver. 2015. Prioritized experience replay. arXiv
arXiv:1511.05952.
Schulman, John, Sergey Levine, Pieter Abbeel, Michael Jordan, and Philipp Moritz. 2015. Trust region policy
optimization. Paper Presented at the International Conference on Machine Learning, Lille, France, July 6—11,
pp. 1889–97.
Sensoy, Murat, Lance Kaplan, and Melih Kandemir. 2018. Evidential deep learning to quantify classification uncertainty.
In Advances in Neural Information Processing Systems 31. Red Hook: Curran Associates, Inc., pp. 3179–89.
Sharpe, William F. 1994. The sharpe ratio. Journal of Portfolio Management 21: 49–58. [CrossRef]
Silva, Francisco, Brígida Teixeira, Tiago Pinto, Gabriel Santos, Zita Vale, and Isabel Praça. 2016. Generation of realistic
scenarios for multi-agent simulation of electricity markets. Energy 116: 128–39. [CrossRef]J. Risk Financial Manag. 2020, 13, 71 17 of 17
Silver, David, Aja Huang, Chris J. Maddison, Arthur Guez, Laurent Sifre, George Van Den Driessche, Julian
Schrittwieser, Ioannis Antonoglou, Veda Panneershelvam, Marc Lanctot, and et al. 2016. Mastering the game of
go with deep neural networks and tree search. Nature 529: 484. [CrossRef]
Silver, David, Guy Lever, Nicolas Heess, Thomas Degris, Daan Wierstra, and Martin Riedmiller. 2014. Deterministic
policy gradient algorithms. Paper Presented at the 31st International Conference on Machine Learning, Beijing,
China, June 22–24.
Silver, David, Julian Schrittwieser, Karen Simonyan, Ioannis Antonoglou, Aja Huang, Arthur Guez, Thomas Hubert,
Lucas Baker, Matthew Lai, Adrian Bolton, and et al. 2017. Mastering the game of go without human knowledge.
Nature 550: 354–59. [CrossRef]
Silver, Nate. 2012. The Signal and the Noise: Why So Many Predictions Fail-but Some Don’t. New York: Penguin
Publishing Group.
Sironi, Paolo. 2016. FinTech Innovation: From Robo-Advisors to Goal Based Investing and Gamification. Hoboken: John Wiley
& Sons.
Solomon, Sorin, Gerard Weisbuch, Lucilla de Arcangelis, Naeem Jan, and Dietrich Stauffer. 2000. Social percolation
models. Physica A: Statistical Mechanics and its Applications 277: 239–47.
Spooner, Thomas, John Fearnley, Rahul Savani, and Andreas Koukorinis. 2018. Market making via reinforcement
learning. Paper Presented at the 17th International Conference on Autonomous Agents and MultiAgent Systems,
Stockholm, Sweden, July 10–15, pp. 434–42.
Stauffer, Dietrich. 2001. Percolation models of financial market dynamics. Advances in Complex Systems 4: 19–27.
[CrossRef]
Streltchenko, Olga, Yelena Yesha, and Timothy Finin. 2005. Multi-agent simulation of financial markets. In Formal
Modelling in Electronic Commerce. Berlin and Heidelberg: Springer, pp. 393–419.
Sutton, Richard S., and Andrew G. Barto. 1998. Introduction to Reinforcement Learning. Cambridge: MIT Press, vol. 2.
Sutton, Richard S., and Andrew G. Barto. 2018. Reinforcement Learning: An Introduction. Cambridge: MIT Press.
Sutton, Richard S, David A McAllester, Satinder P Singh, and Yishay Mansour. 2000. Policy gradient methods for
reinforcement learning with function approximation. In Advances in Neural Information Processing Systems.
Cambridge: MIT Press, pp. 1057–63.
Tashiro, Daigo, Hiroyasu Matsushima, Kiyoshi Izumi, and Hiroki Sakaji. 2019. Encoding of high-frequency order
information and prediction of short-term stock price by deep learning. Quantitative Finance 19: 1499–506. [CrossRef]
Tsantekidis, Avraam, Nikolaos Passalis, Anastasios Tefas, Juho Kanniainen, Moncef Gabbouj, and Alexandros Iosifidis.
2017. Forecasting stock prices from the limit order book using convolutional neural networks. Paper Presented
at the 2017 IEEE 19th Conference on Business Informatics (CBI), Thessaloniki, Greece, July 24–26, pp. 7–12.
Van Hasselt, Hado, Arthur Guez, and David Silver. 2016. Deep reinforcement learning with double q-learning.
Paper Presented at the Thirtieth AAAI conference on artificial intelligence, Phoenix, AZ, USA, February 12–17.
Vinyals, Oriol, Igor Babuschkin, Wojciech M Czarnecki, Michaël Mathieu, Andrew Dudzik, Junyoung Chung, David H
Choi, Richard Powell, Timo Ewalds, Petko Georgiev, and et al. 2019. Grandmaster level in starcraft ii using
multi-agent reinforcement learning. Nature 575: 350–54. [CrossRef] [PubMed]
Vytelingum, Perukrishnen, Rajdeep K. Dash, Esther David, and Nicholas R. Jennings. 2004. A risk-based bidding
strategy for continuous double auctions. Paper Presented at the 16th Eureopean Conference on Artificial
Intelligence, ECAI’2004, Valencia, Spain, August 22–27, vol. 16, p. 79.
Wang, Ziyu, Tom Schaul, Matteo Hessel, Hado Van Hasselt, Marc Lanctot, and Nando De Freitas. 2015. Dueling
network architectures for deep reinforcement learning. arXiv arXiv:1511.06581.
Zarkias, Konstantinos Saitas, Nikolaos Passalis, Avraam Tsantekidis, and Anastasios Tefas. 2019. Deep reinforcement
learning for financial trading using price trailing. Paper Presented at the 2019 IEEE International Conference on
Acoustics, Speech and Signal Processing (ICASSP), Brighton, England, May 12–17, pp. 3067–71.
c 2020 by the authors. Licensee MDPI, Basel, Switzerland. This article is an open access
article distributed under the terms and conditions of the Creative Commons Attribution (CC
BY) license (http://creativecommons.org/licenses/by/4.0/).You can also read