Market
Macroscope
            April 2021
   Investment Products
←
→
Page content transcription
If your browser does not render page correctly, please read the page content below

Market
Macroscope
April 2021
Investment Products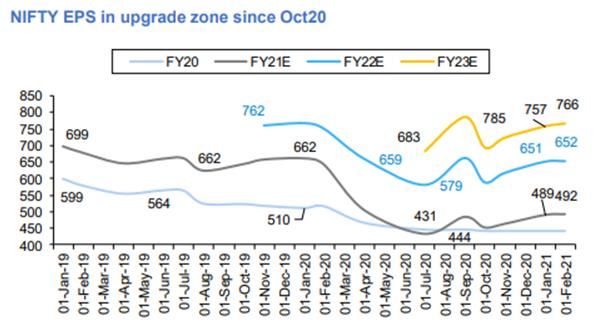
Index

Contents                                                                          Page No

Equity outlook …………………………………………………………………….                                        1-3

Fixed income outlook ……………………………………………………………                                      4-7

Deep dive – Waiting for a correction?? ……...…………...............................   8-10

Dots to join ……………………..…………………………………………………                                        11-12

Index performance ……….………………………………………………………                                       13

Macro economic indicators ………………………………………………………                                   14-15

Model portfolios …………...………………………………………………………                                     16-17

CAGR vs IRR vs TWIRR: Measuring investment performance ....................       18-20

Crossword …………...…………………………………………………………….                                         21

MARKET MACROSCOPE | INVESTMENT PRODUCTS | APRIL 2021

Equity Outlook

Macroeconomic Review:

The $1.9 trillion US fiscal stimulus was approved in early March. US President Biden also unveiled a
further $2 trillion infrastructure plan. This is only the first part of what is likely to be a $4 trillion plan.
The infrastructure plan would focus on transportation, water, clean energy and manufacturing among
others. The Biden administration plans to raise US corporate tax rates from the current 21% to 28%
to finance the plan. It is likely to take 2-3 months for the plans to be approved. We expect the tax
increases to be a near term risks for equity markets. You will recollect that Trump had cut US
corporate taxes to 21% early in his tenure and that had led to a sharp rally in US equities.

The US bond yields have been trading in a narrow band for the last couple of weeks but this is a risk
to be monitored. Any large spike in bond yields could be negative for equity markets in the near term.

India’s GST collections continued to be close to record highs in each of the past few months
suggesting continued strength in the economy. However, March saw a sharp increase in Covid
infection in India and some states and cities have imposed partial lockdowns/ night curfews. A
continued increase could disrupt the nascent economic recovery.

The RBI’s Monetary Policy Committee held rates unchanged in its early April meeting with a
commitment to keep an accommodative policy. India’s 10-year bond yield has shown some stability
and traded in a narrow band over the last couple of weeks. The Supreme Court decided in favour of
the banks in a plea urging waiver of interest during the lockdown. The Supreme Court also lifted the
stay on classification of accounts as NPL.

Equity markets review:

The market movement in March can best be described as sideways with no big triggers to move the
markets in either direction. The increase in Covid cases was a negative surprise for the markets. The
FII buying activity, which has fueled the rally in the last six months, was much lower in March
compared to the past few months. FIIs invested Rs. 10,482 Crores in the Indian equity markets in
March 2021 while domestic mutual funds reported net outflows.

Nifty increased by 1% and Bank Nifty fell by 4.3% respectively during the month. Financials and
realty were one of the worst performing sectors during the month. FMCG and IT services, which had
underperformed sharply in February were among the best performing sectors in March.

The best and worst performing stocks within the NSE 500 universe are shown in the table below.
Stocks from the Adani group had a strong run.

                            Best Performing Stocks Among NSE 500 in March 2021
             Large Cap                              Mid Cap                              Small Cap
 Stock Name                Returns Stock Name                      Returns Stock Name                  Returns
                                                                            Intellect Design Arena
  Adani Enterprises Ltd.    23.7%   Adani Total Gas Ltd.            87.7%                                71.6%
                                                                            Ltd.
  IDBI Bank Ltd.            22.2%   3M India Ltd.                    32.1%    APL Apollo Tubes Ltd.      30.2%

  Grasim Industries Ltd.    21.4%   MindTree Ltd.                    29.5%    Prism Johnson Ltd.         28.3%
  Adani Transmission
                            21.2%   Fortis Healthcare Ltd.           25.4%    Can Fin Homes Ltd.         28.0%
  Ltd.
  JSW Steel Ltd.            18.2%   JSW Energy Ltd.                  22.4%    KSB Ltd.                   23.9%

MARKET MACROSCOPE | INVESTMENT PRODUCTS | APRIL 2021                                                               01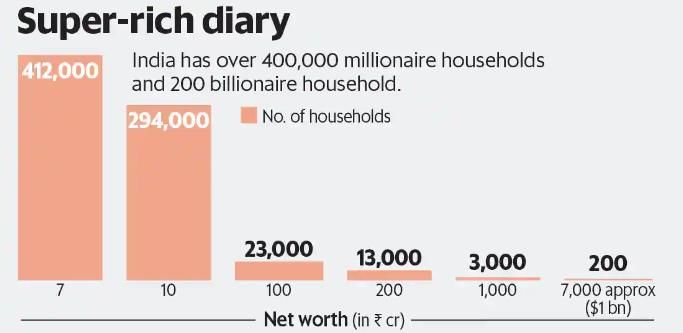
Equity Outlook

                              Worst Performing Stocks NSE 500 in March 2021
            Large Cap                               Mid Cap                                Small Cap
Stock Name                Returns Stock Name                          Returns Stock Name               Returns
 Punjab National Bank     -10.3%    Bank of India                     -17.7%   Hindustan Copper Ltd.    -20.2%
                                                                               Hemisphere Properties
 Petronet LNG Ltd.        -12.3%    Vodafone Idea Ltd.                -18.4%                            -21.6%
                                                                               India Ltd.
 Info Edge (India) Ltd.   -12.4%    UCO Bank                          -21.2%   Future Consumer Ltd.     -25.2%
 SBI Cards and
                          -13.0%    Astral Poly Technik Ltd.          -23.6%   Future Retail Ltd.       -38.7%
 Payment Services Ltd.
 Coal India Ltd.          -14.3%    Dhani Services Ltd                -53.6%   Bliss GVS Pharma Ltd.    -43.6%
Source: NSE,BSE

IPO Review:

March 2021 was a strong month in terms of no. of IPOs issuances with 9 companies raising Rs.
6,082 crores during the month through a mix of OFS and fresh issue of shares. However, the
investors would be fairly disappointed with the listing prices of many of the IPOs. Only 3 out of the 9
companies which started trading in March, Heranba, MTAR Technologies and Nazara Technologies,
gave outsized gains. Two other, Easy trip and Laxmi Organics, gave 13-19% returns on listing day.
The other 4 companies gave negative returns on listing date.

Many of the companies listed at far below the supposed “grey market premium” (GMP) that had been
quoted by some of the market participants. High GMP influenced many investors to subscribe to
these IPOs. We have always maintained that the GMP is too opaque and too illiquid to be trusted as
a valid signal. We hope that this month has thoroughly discredited GMP. At the very least, the
message investors should take away is that IPOs too have risk and evaluating that carefully is
important.

The table below summarizes the IPOs which either closed or listed during March 2021:

                                                                  Listing
                                                      IPO price                        Overall      QIP
                              Size of IPO Issue close           date open % Inc from
Name of the company                                    (Rs. Per                       Subscripti Subscripti
                                (Rs. Cr)     Date                (Rs. Per issue price
                                                        share)                        on (times) on (times)
                                                                  share)

 Heranba Industries                624      25-Feb-21          627      900      43.5%         83.3     67.4
 MTAR Technologies                 597       5-Mar-21          575     1075      87.0%         200.7   165.0
 Easy Trip Planners                510      10-Mar-21          187      212      13.4%         160.0    77.9
 Laxmi Organics                    600      17-Mar-21          130      155      19.2%         106.8   175.4
 Anupam Rasayan                    760      16-Mar-21          555      521       -6.1%        45.2     65.9
 Craftsman Automation              823      17-Mar-21          1490    1359       -8.8%         3.8      5.2
 Kalyan Jewellers                  1175     18-Mar-21           87      74       -15.1%         2.6      2.8
 Nazara Technologies               582      19-Mar-21          1101    1990      80.7%         175.4   103.7
 Suryodaya SFB                     582      19-Mar-21          305      292       -4.3%         2.4      2.2
 Barbeque Nation                   453      26-Mar-21          500      489       -2.2%         6.0      5.1

 Source: NSE,BSE

MARKET MACROSCOPE | INVESTMENT PRODUCTS | APRIL 2021                                                             02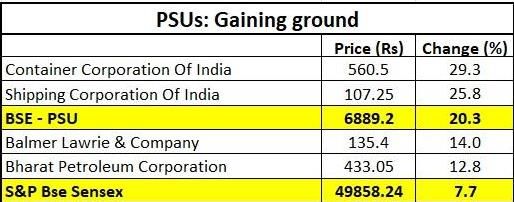
Equity Outlook

 Recommended reading for the month:

 Morgan Housel is the author of best selling book “The Psychology of Money”, a book we would highly recommend.
 He also writes a blog on collaborativefund.com. This week we recommend his blog post published on March 18,
 2021 titled “Too Much, Too soon, Too Fast”, in which he discusses the perils of targeting breakneck growth.

Outlook:

All eyes this month should be on the results of the March quarter. In the last 2 consecutive quarters,
companies have beaten street expectations and earnings estimates have been raised. We expect
companies to report strong results again this quarter. However, the element of positive earnings
surprise is likely to be much lower than in the last 2 quarters because of the increased estimates.
Results of the banking and NBFC sector is the key known unknown and the street will be closely
watching the guidance of the companies in the sector.

The table below shows select “buy” and “reduce” recommended stocks as rated by HDFC Securities’
Institutional equities team.
                          HDFC Sec Institutional Equities: Select "Buy" rated stocks
Name                    Industry                  Target price             CMP                % Upside
 Bharat Forge            Auto Anc.                     720                  612                17.6%
 Birla Corp              Cement                       1,371                 967                41.8%
 Capacite Infraprojects Construction and infra         320                  199                60.8%
 Hero Moto               Auto Anc.                    3,890                2,942               32.2%
 Oberoi Realty           Real Estate                   697                  572                21.9%
                        HDFC Sec Institutional Equities: Select “Reduce" rated stocks
Name                    Industry                  Target price             CMP               % Downside
 Indusind Bank          Banks – Pvt                    749                  947                20.9%
 RBL Bank               Banks – Pvt                    214                  215                 0.5%
 ICICI Lombard          Insurance                     1230                 1454                15.4%
 TCNS Clothing          Retail & Fashion               400                  496                19.4%
Source: HDFC Sec IE

The table below gives select positional buy calls issued by the HDFC Retail Research team:
Company Name                 Reco date       Entry price         CMP          Target price       % Upside
 Sun TV                      11-Feb-21           522             477              735               54%

 PNB Housing Finance         16-Feb-21           402             384              523               36%

 Triveni Engineering         3-Mar-21             90              84              104               24%

 GSFC                        1-Apr-21             85              89              104               17%

 Laurus Labs                 5-Apr-21            375             397              480               21%

Greater details about the above institutional equities recommendations and retail research calls can
be accessed at our website.

Risks:

The sharp increase in Covid 19 cases in metros and the prospects of new lockdowns are a key risk
for the markets. Global Inflation prints will be closely watched and could move bond yields and
impact equity markets.

MARKET MACROSCOPE | INVESTMENT PRODUCTS APRIL 2021                                                               03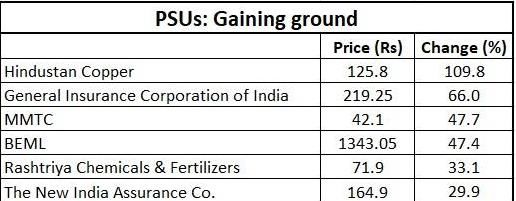
Fixed Income Outlook
US Yields – the single biggest drivers of the market at the moment

Thus far, CY 2021 has been a turbulent year not only for the US bond markets, but across the world.
US 10 yr bond yields have risen by 76 bps. A similar trend has been observed across major bond
markets in the world.

                                   10 Year US Treasury Yield
     2                                                                                 1.74
                     1.92                                                                        1.65
  1.5

     1

  0.5
                                                0.53
     0

 Source: fred.stlouisfed.org

The major reason for the same is that the new U.S. government has been able to pass through ~$2
trillion fiscal package (~10% of U.S. GDP) and is looking forward to another infrastructure stimulus
package during the second half of the calendar year or later. On account of this additional stimulus,
the inflation expectations in the U.S. have skyrocketed and that has led to a rise in bond yields
across the world.

At its meeting on 16–17 March, the Federal Open Market Committee (FOMC) decided to hold the
target range for the federal funds rate at its effective floor of 0.00%–0.25%. Moreover, the Fed
reaffirmed its commitment to using its full range of powers to support the economic recovery at its
current pace. The decision though was widely anticipated by market analysts.

The Fed kept the target range unchanged due to the economic fallout caused by the ongoing public
health crisis. Despite recent momentum in economic activities, employment levels are expected to
remain below their pre-pandemic levels in the short term and the sectors most affected by Covid-19-
related restrictions remain depressed.

Meanwhile, to ensure sufficient liquidity for households and businesses and the effective
transmission of monetary stimulus to broader financial conditions, the Fed reaffirmed its commitment
to increase its holding of Treasury securities at least at the current pace of USD 80 billion per month.

Looking ahead, the Fed revised its economic projections upward in March and now sees GDP
growing 6.5% in Q4 2021 (December projection: 4.2%). Meanwhile, it expects the unemployment
rate to average at 4.5% in Q4 2021 (December projection: 5.0%) and the personal consumption
expenditures inflation rate, closely watched by the Fed to monitor price pressures to average 2.4% in
the Q4 2021, (December projection: 1.8%).

Inspite of the improved outlook, the Fed reaffirmed it will likely keep the target policy rate at its
current level until “labour market conditions have reached levels consistent with the Committee’s
assessments of maximum employment and inflation has risen to 2% and is on track to moderately
exceed 2% for some time”.

MARKET MACROSCOPE | INVESTMENT PRODUCTS | APRIL 2021                                                       04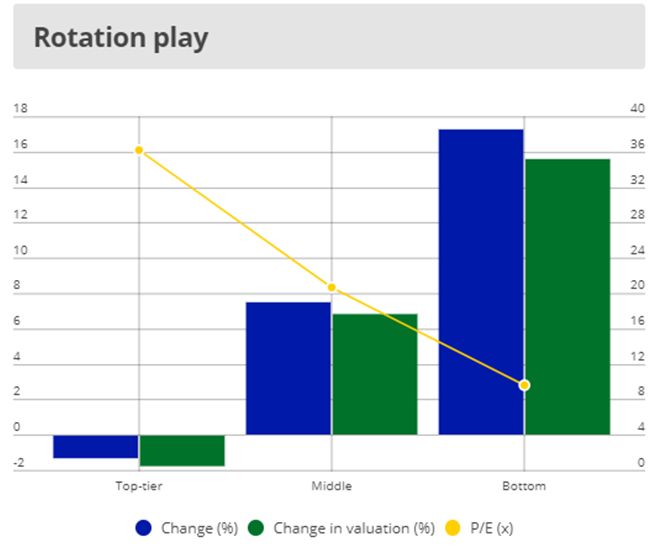
Fixed Income Outlook
India inflation – in control and fingers crossed

Inflation Y-o-Y came in at 5.03% in February, above January’s 4.06% and above market forecasts of
4.83%. It is the highest reading in the last 3 months.

The rise in retail inflation last month was mainly due to a rise in food prices. Food inflation
accelerated to 3.87% from 1.89% which was the lowest since May of 2019.

Consumer prices rose 0.19% in February over the previous month, swinging from the 0.64% fall
recorded in January. After a 35% rise in crude prices from November’20 to February’21, there has
been a consolidation in crude prices in the month of March.

Another leg of rally in crude prices may put the central bank into some bother.

                                 India CPI Annual & Monthly Variation (%)

 Source: focuseconomics.com

Corporate bond market – Things have been difficult for the lower rated companies

The 10Y Government bond yield has stabilised to 6.18% from 6.23% last month and the 5Y
Sovereign rates moved to 5.71% from 5.75% last month. Similar action was witnessed in the
corporate bond space with 10Y Benchmark AAA bonds having moved to 6.62% from 6.68%, but 10Y
Benchmark BBB has moved to 10.72% from 10.12% last month as 10Y BBB bonds spreads
increased by 65 bps to 4.45%.

With the fear of lockdown looming amid the rise in Covid cases, a partial or complete lockdown will
be detrimental to smaller business to a large extent than their bigger counterparts. This uncertainty
has resulted in selective lending to larger corporates by banks.

This means that while the AAA corporate spread is reasonable at 0.44%, lower rated companies and
NBFCs still have to borrow at rates closer to 10%. However, with the return of confidence and
growth, these spreads should come down.

MARKET MACROSCOPE | INVESTMENT PRODUCTS | APRIL 2021                                                    05
Fixed Income Outlook
Corporate spreads (10 year tenor)
6.0
5.0
4.0
Lower rated papers spreads
Steeper reduction in lower
3.0 increasing and moving in
rated papers compared to
oppositie direction while AAA
AAA rated papers is
rated papers spread decreased
2.0 reversed amid locdown
fears
1.0
s
0.0
s
Jul-20
Jul-19
Jun-19
Jun-20
Apr-19
May-19
Nov-19
Apr-20
May-20
Nov-20
Jan-19
Aug-19
Feb-19
Mar-19
Sep-19
Dec-19
Jan-20
Feb-20
Mar-20
Aug-20
Sep-20
Oct-20
Dec-20
Jan-21
Feb-21
Mar-21
Oct-19
BBB over G-sec AAA over G-sec
Source: CARE Rating
RBI Monetary Policy Update:
The RBI kept the repo rate unchanged at 4% for the fifth time in a row while maintaining its
accommodative policy stance. The MPC maintained its Gross Domestic Product (GDP) growth
forecast at 10.5% for FY22. The monetary policy continues to be growth-centric, despite the
underlying upside risks to inflation. The central bank believes that inflation today is short-term in
nature, while growth has to be protected for long term sustainability.
A few key highlights for your ready reference:
Policy measures: Repo rate kept unchanged at 4%.
GDP: Retained Real GDP growth projection at 10.5% in FY22.
Inflation: Expected at 5.0% in Q4 2020-21; 5.2% in Q1 2021-22; 5.2% in Q2; 4.4% in Q3 and 5.1%
in Q4.
Stance: Maintains the accommodative stance as long as necessary to revive growth on a durable
basis and mitigate the impact of COVID-19 on the economy, while ensuring that inflation remains
within the target.
Other measures:
GSAP 1.0 under which the RBI plans to buy government securities worth Rs 1trn in
Q1FY22
Small payments bank can now allow individual customers to keep a balance of up to 2
lakh. (Good for financial inclusion)
Targeted long term repo operation (TLTRO) on tap scheme extended by a period of 6
months till 30th September 2021
To extend fresh support of Rs 50,000 cr to all India financial institutions for new lending in
2021
To extend the priority sector lending (PSL) classification for lending by banks to NBFCs for
6 months i.e. up to 30th September 2021
MARKET MACROSCOPE | INVESTMENT PRODUCTS | APRIL 2021 06Fixed Income Outlook Fixed Income Outlook – stay at the shorter end We believe that this rate cycle is going to be much more patient than the previous one. Between 2013-14 to 2017-18 RBI followed a rigid CPI targeting framework, which means that although RBI’s CPI target range was 4% (+/-2%), the focus was always to ensure that CPI is close to 4%. We think that RBI’s philosophy and framework has changed and they indeed today are a flexible inflation- targeting central bank, which means that they are no longer obsessed with 4% and are happy for inflation to be in the range of 4%(+/-2%) in actuality. In the near term, the prospects for debt markets would be guided by specific market support measures that the RBI may consider. The central bank may continue to do the operation twist in some form as they have been doing till now, where they sell short term bonds and buy long term bonds. The central bank would also like to avoid creating more liquidity as it could eventually lead to inflationary concerns. RBI is expected to do at least Rs 3 lakh crore OMO in the next financial year. We believe RBI is trying to bring the change in yield in an orderly manner. This will lead to a calibrated and gradual rise in yields. Fixed income investors thus should avoid the long end of the yield curve. They can look to invest in 2-3 year Hold to Maturity strategies to lock in the yield and bide their time for the interest rate cycle to turn. Alternately, for investors willing to take slightly higher risk, 4-5 year maturity MFs/bonds can be looked at with a 1-2 year horizon. The steepness in the yield curve will allow the absorption of potential MTM. MARKET MACROSCOPE | INVESTMENT PRODUCTS | APRIL 2021 07
Deep Dive: Waiting for a correction??

 We get asked this question a lot by investors looking to invest in equities – “Is it a good time to
 invest now or should one wait for a correction?”. We note that “waiting for a correction” is the
 default mode for many investors irrespective of the market conditions. Even some of the more
 experienced investors fall into this category.

 So we decided to dig a little into the historical data and try and see what lessons we could draw. We
 considered two hypothetical types of strategies:

  Strategy type                  Characteristics
                                 Invest upfront and do not wait for a correction- Strategy U is short for
  Strategy U
                                 Upfront investment
                                 Wait for a correction of at least 15% from the most recent high.
  Strategy W
                                 Strategy W is short for an investor “waiting for a 15% correction”

 Please note that there could be instances where Strategy W invests at a higher level than Strategy U
 because the markets may have a strong rally before correcting 15% from their most recent high. The
 process is explained in the table below:

  Investor following strategy U            Investor following strategy W
  Invests upfront in Nifty irrespective    Step 1. Checks market level. If market is 15% or more below
  of market level                          its recent high, invests in Nifty straightway. Else, invests in
                                           liquid fund.

                                           Step 2. Waits for market correction to reach 15% from the
                                           recent high. On that day, redeems liquid fund and buys Nifty.

 We compared the 5-year IRRs for both type of strategies.

 We considered data from Jan 1, 1995 till March 15, 2016. We repeated this theoretical exercise for
 every trading day from 1995 till 2016. We thus got 7,745 observations for returns generated by the
 two type of strategies.

 (Note: Our analysis ends in March 2016 because we were interested in the 5-year IRRs. However, this
 does not take anything away from our conclusions)

 The Results:

 The results are summarized in the table below:
                                  No. of       Observ
  Results                        observati     ations     Remarks
                                   ons          in %
  Strategies W and U yielded                              This is the period where the market is below
                                   4,361        56.3%
  same results                                            15% or more from a most recent high.
  Strategy W and U IRRs
                                                          Strategy W and U IRRs are fairly close
  were within +2% or -2% of        1,327        17.1%
                                                          together and results are not very material.
  each other
  Strategy W outperforms U                                Strategy W outperforms- mainly just before
                                   1,362        17.6%
  by more than 2%                                         and during corrections
  Strategy W underperforms U                              Strategy W underperforms around large
                                    695          9.0%
  by more than 2%                                         rallies
  Total                            7,745        100.0%

 MARKET MACROSCOPE | INVESTMENT PRODUCTS | APRIL 2021                                                        08
Deep Dive: Waiting for a correction?? The data for the above points is presented in the chart below. The RHS shows the nifty levels. The LHS shows the difference between the 5-year IRRs of strategy W less the 5 year IRRs of strategy U. Readings greater than zero mean that the strategy W outperforms the strategy U. Readings below zero imply that strategy W underperforms strategy U. All readings of zero signify that the markets were at least 15% below their most recent highs and therefore there is no difference between strategy W and strategy U. The Lessons: So what are the lessons we can learn from the above data analysis: Lesson 1: Markets spend a lot of time well-below their most recent all-time high. In fact, out of the 7,745 observations, markets were 15% or more below their most recent all-time high a whopping 4,361 times, i.e., 56.3% of the time. In such cases, both Strategy U and Strategy W would invest at the same time and therefore their IRRs would be the same. Lesson 2: “Waiting for a correction” is meaningful only a very limited number of times. Strategy W outperformed Strategy U by 2% or more (in IRR terms over a 5-year period) only in 1,362 observations out of the total 7,745 observations i.e., about 17.5% of the time. Strategy W outperformed strategy U by 3% or more only 683 times. While this seems high, we must also ask the question “How many times does strategy W underperform strategy U by 2% or more”? The answer is 695 times or about 8.9% of the time. So a small number of times the upfront investment strategy was meaningfully better. But if you look at the chart above closely, you will notice that strategy W underperforms U by anywhere between 6-10%. This means that investor following strategy W often misses out on large rallies. Lesson 3: In what instances does strategy W outperform. The Nifty corrected sharply between Jan 2000 (from 1638) to April 2000 (about 1428) and for much of this period the strategy W outperformed. Please note that the Nifty actually peaked at 1756 on Feb 2000 but the period of outperformance for strategy W was much larger. Strategy W generally outperforms Strategy U just before a significant market correction. MARKET MACROSCOPE | INVESTMENT PRODUCTS | APRIL 2021 09
Deep Dive: Waiting for a correction??

 Similarly, strategy W outperformed strategy U substantially during December 2003 to May 2004.
 Remember that Nifty hit a lower circuit of 20% in May 2004.

 Lesson 4: In what instances does strategy U outperform.

 Strategy U outperformed strategy W from Sept 2004 to May 2006 as the Nifty rose from 1,705 to 3,754
 before correcting to 3,081. As a result, the strategy W waited too long before investing and
 missed out on a very large part of the rally. A similar pattern played out from March 2007 to
 January 2008 when the Nifty rallied from 3,600 levels to 6,200 levels in Jan 2008. Strategy U
 outperformed for much of this period.

 Summary and Suggestions:

 Lesson 4 listed above might be the most important lesson of all. Our theoretical exercise was
 quite simplistic. Anecdotally, we would suggest that actual investor experience is far worse than the
 numbers that we have presented above. This is because many investors, at the time of correction,
 wait for an even larger correction and quite often miss the opportunity to invest at the time of
 correction. Quite often, investors actually reduce equity allocation after a sizable correction.

 Also, investors sometimes miss out on large rallies because of their desire to buy only in a correction.
 Remember that equity market returns generally are bunched up and we often see large rallies before
 a meaningful correction.

 Many investors follow a “waiting for a correction” strategy without applying much thought to it and quite
 often as a “default” mode. Such investors miss out on large rallies. However, this is actually a very
 important asset allocation decision. So what can an investor do to improve his experience. We have
 two recommendations:

 Recommendation 1: Devise an asset allocation strategy and follow a disciplined investment
 approach around the same

 A strong asset allocation strategy is very important for any investor. A typical asset allocation strategy
 would define the high and low value of equity allocation and design some heuristics about increasing /
 decreasing equity allocations.

 One rather simplistic equity allocation heuristic we use, is that we look to reduce equity allocation only
 if we believe that markets have a “high probability of correcting at least 15% or more”.

 Why 15% and not 5% or 10%. Well, the markets typically move 5% or more in a month generally
 responding to near term news flow. These are difficult to predict and an investor would merely end up
 trading a lot. Let us assume that we think the market is likely to correct 10%, we expect that we would
 not be able to capture more than 5 or 6% out of the same. Again, trying to avoid such a small
 correction would not lead to any significant benefit for the portfolio IRR. That is the reason we look out
 for “high probability of correction” of 15% and higher.

 Recommendation 2: Be bottom up driven in terms of adding to /reducing from the portfolio

 The other way to manage equity allocation is to focus much more on bottom up analysis of markets
 and your portfolio. If you find a fundamentally strong, high quality business at attractive valuations you
 should look to add that to your portfolio. Conversely, if any stock in your portfolio is at risk of a
 significant correction, then you should look to exit the same. This approach is a superior approach to
 recommendation 1 and has the benefit of automatically adjusting overall equity exposure without
 having to take an overall market directional call.

 MARKET MACROSCOPE | INVESTMENT PRODUCTS | APRIL 2021                                                         10
Dots to Join
Rising yields vs Sensex: The chart below shows the bond yields and the Sensex level over the past
2 decades. (Note- Sensex is shown in log scale). Note that in the 4 periods of rising bond yields
(2004-08, 2009-12, 2013-14, 2017-18), Sensex gave positive returns. In the above cases, the
valuations at the beginning of these periods was attractive.

(Source: Morgan Stanley research)

Nifty EPS Upgrade – The chart below shows the Nifty EPS estimates for FY21-23. The FY23 Nifty
EPS has increased from around 690 to 766 in the past 2 quarters. Can the March 2021 quarter bring
more upgrades?

Source – Bloomberg

Rotation into value? – In February, the bottom 33% Nifty companies in terms of P/E, rose 17.3%
compared to Nifty's returns of around 5%. The top 33% of companies based on P/E fell 1.3%.

Source – Business standard, Motilal Oswal
Note: Nifty 50 companies divided into 3 buckets of 33% each; PE based on FY22 earning estimates

MARKET MACROSCOPE | INVESTMENT PRODUCTS | APRIL 2021                                                11
Dots to Join
Home Affordability – Home loan rates are available from major banks/HFCs at 6.65-6.75% p.a.
compared to around 8% in January 2020. A 3% drop in home loan rates can let a borrower take a
28% larger home loan. In FY2000, property prices on an average were 5.9 times the annual income of
a buyer compared to 3.3 times now.

Source: Live Mint

India’s Wealthy– According to a survey by Hurun India, almost 23,000 families have a networth of
more than Rs. 100 crores. Almost 35% of respondents were looking to increase equity investments in
the next 3 years.

Source: Livemint.com

PSU Stock Rally - The S&P BSE PSU Index has gained 20% since the budget compared to around 8
percent gain in the Sensex. The government aims privatize 2 banks and one general insurance
company. In 2002, the divestment of Balco, Hindustan Zinc, IPCL and VSNL happened at a premium
to their then market cap.

Source: Business standard

MARKET MACROSCOPE | INVESTMENT PRODUCTS | APRIL 2021                                                 12
Index Performance

Index Performance (31-Mar-21)
           Scheme Name                   1M         3M          6M         1Y         2Y         3Y       5Y     10 Y
NIFTY 50                                  1.1        5.1       30.6       70.9       12.4        13.2     13.7   9.7
NIFTY 500                                 1.1        6.9       31.8       76.0       12.8        11.3     13.8   10.3
NIFTY AUTO                               -3.0        7.3       24.7       108.5       8.7        -3.0     4.0    9.8
NIFTY BANK                               -4.3        6.5       55.2       74.0        4.6        11.1     15.6   11.0
Nifty Financial Services                 -2.3        3.3       47.9       68.7       11.9        15.4     19.0   13.0
NIFTY FMCG                                7.7        2.2       17.1       27.9        7.3        10.1     12.1   14.3
NIFTY INFRA                              -0.5       12.0       32.7       73.2       12.8        7.1      9.9    2.9
NIFTY IT                                  6.4        6.6       29.6       102.6      28.5        27.3     18.0   13.7
NIFTY MEDIA                              -4.9       -6.3       -0.2       48.6       -21.2      -22.2     -7.8   0.8
NIFTY METAL                               4.0       22.2       77.4       150.8      14.2        4.2      15.8   -0.8
Nifty Midcap 150 - TRI                    2.0       14.6       39.2       101.6      18.6        11.8     17.5   15.3
NIFTY NEXT 50                            -0.1        5.1       26.4       61.8        9.9        6.2      12.7   11.7
NIFTY PHARMA                              2.9       -5.0        4.2       71.0       14.5        13.6     2.2    10.5
NIFTY PRIVATE BANK                       -4.2        3.0       50.3       74.6        1.3        9.0      0.0    0.0
NIFTY PSU BANK                           -9.8       23.1       68.9       62.9       -19.5       -9.1     -2.5   -7.0
NIFTY REALTY                             -4.5        6.5       57.7       90.4       11.4        4.3      16.4   0.6
Nifty Smallcap 250 - TRI                  0.9       14.6       39.5       118.7      14.3        4.6      12.7   11.4
S&P BSE Consumer Durables                 3.4        8.0       35.2       69.5       17.2        13.8     23.4   18.0
S&P BSE MidSmallCap - TRI                 1.9       13.6       38.7       105.2      17.1        8.4      15.2   12.7
S&P BSE OIL & GAS Index                  -4.7        5.2       21.1       47.9        -1.5       0.5      10.1   3.8
S&P BSE Power Index                       2.3       20.0       49.7       79.6       10.3        5.2      6.9    -0.9
S&P BSE SENSEX                            0.8        3.7       30.1       68.0       13.1        14.5     14.3   9.8
S&P BSE Telecom                          -7.3        2.2       25.2       33.4       12.3        -0.7     0.1    0.3

 Data as on 31st March. Returns less than 1 year are in absolute terms and greater than 1 year are CAGR
 Source: ACE MF

MARKET MACROSCOPE | INVESTMENT PRODUCTS | APRIL 2021                                                                    13
Macro Economic Indicators
GDP Growth (%): Inflation:
10 7.1 10
5.9 5.0
5 0.4 5
0
4.2
Q1 FY19
Q2 FY19
Q3 FY19
Q4 FY19
Q1 FY20
Q2 FY20
Q3 FY20
Q4 FY20
Q1 FY21
Q2 FY21
Q3 FY21
-5 0
0.4
-10 -5
Jun-20
Jul-20
Apr-20
May-20
Aug-20
Nov-20
Mar-20
Sep-20
Dec-20
Jan-21
Feb-21
Oct-20
-15
-20
-25
WPI CPI
-30
Q2 Q3 Q4 Q1 Q2 Q3 Mar-20 Jun-20 Sep-20 Dec-20 Feb-21
FY20 FY20 FY20 FY21 FY21 FY21
WPI 0.40 -1.80 1.32 1.22 4.17
Quaterly
4.6 3.3 4.0 -24.4 -7.3 0.4
GDP % CPI 5.91 6.23 7.27 4.59 5.03
Source : Ministry of Statistics & Programme Implementation Source : Ministry of Statistics & Programme Implementation
Industrial Production Growth: India Composite PMI:
10 70 56.3 57.3
0 60
-10 2.0 -1.6
50
-20 40
-30
30
-40
-50 20
-60 10
-70 0
Jul-20
Jul-20
Apr-20
May-20
Jun-20
Apr-20
May-20
Jun-20
Aug-20
Nov-20
Nov-20
Jan-20
Feb-20
Mar-20
Sep-20
Dec-20
Jan-21
Jan-20
Feb-20
Mar-20
Aug-20
Sep-20
Dec-20
Jan-21
Feb-21
Oct-20
Oct-20
Jan-20 Apr-20 July-20 Oct-20 Jan-21 Mar-20 Jun-20 Sep-20 Dec-20 Feb-21
IIP 2.0 -57.3 -10.5 4.5 -1.6 Composite PMI 50.6 37.8 54.6 54.9 57.3
Source : Ministry of Statistics & Programme Implementation Source :www.fxempire.com
Domestic Yield Movement: 10 Year US Treasury Yield Movement:
7 6.14 6.17 2
2 1.72
6
2
5.75 1
5 4.13
1
4
4.40 1
3 4.00 1
Jul-20
Jun-20
Apr-20
May-20
Nov-20
Dec-20
Mar-20
Aug-20
Sep-20
Oct-20
Jan-21
Feb-21
Mar-21
1
0 0.67
Jul-20
Jun-20
Apr-20
May-20
Dec-20
Aug-20
Nov-20
Mar-20
Sep-20
Jan-21
Feb-21
Mar-21
Oct-20
Repo Rate 10 Yr G-sec 1 Yr CD Rates
Mar-20 Jun-20 Sep-20 Dec-20 Mar-21 Mar-20 Jun-20 Sep-20 Dec-20 Mar-21
Repo 4.40 4.00 4.00 4.00 4.00
US Yields 0.67 0.66 0.69 0.92 1.72
1 Yr CD 5.75 4.20 3.95 3.55 4.13
Source : investing.com
10 Yr Gsec 6.14 5.89 6.04 5.93 6.17
Source : investing.com, RBI, Bloomberg
MARKET MACROSCOPE | INVESTMENT PRODUCTS | APRIL 2021 14Macro Economic Indicators
FII Equity Flows (Rs cr): FII Debt Flows (Rs cr):
80,000 10,000
60,000 0
40,000 -10,000 -69
20,000
-20,000
- 10952
(20,000) -30,000
(40,000) -40,000
(60,000) -50,000
(61,973) -56,211
(80,000) -60,000
Jul-20
Jul-20
May-20
Nov-20
Mar-20
May-20
Nov-20
Mar-20
Sep-20
Jan-21
Mar-21
Sep-20
Jan-21
Mar-21
Mar-20 Jun-20 Sep-20 Dec-20 Mar-21 Mar-20 Jun-20 Sep-20 Dec-20 Mar-21
FII Equity FII Debt
-61,973 21,832 -7,783 62,016 10,952 -56,211 2,221 4,364 6,542 -69
Flows Flows
Source : NSDL Source : NSDL
USD vs. INR: Gold Price (Rs/10gm):
76 55,000
75
75.34 50,000
74
45,000
73
73.11 40,000 43,725 44,228
72
71 35,000
70 30,000
Jul-20
Jul-20
May-20
Apr-20
Jun-20
Apr-20
May-20
Jun-20
Aug-20
Nov-20
Aug-20
Nov-20
Mar-20
Oct-20
Dec-20
Sep-20
Dec-20
Jan-21
Feb-21
Mar-21
Mar-20
Sep-20
Jan-21
Feb-21
Mar-21
Oct-20
Mar-20 Jun-20 Sep-20 Dec-20 Mar-21 Mar-20 Jun-20 Sep-20 Dec-20 Mar-21
$ vs. ₹ 75.34 75.50 73.77 73.07 73.11 Gold Price 43,725 48,534 50,528 50,123 44,228
Source : Bloomberg Source : India Bullion and Jewellers Association
Brent Crude (USD/Barrel):
70 63.85
60
50
40 27.50
30
20
10
-
Jul-20
Jun-20
Apr-20
May-20
Dec-20
Mar-20
Aug-20
Nov-20
Sep-20
Jan-21
Feb-21
Mar-21
Oct-20
Mar-20 Jun-20 Sep-20 Dec-20 Mar-21
Brent
27.50 41.09 40.48 51.08 63.85
Crude
Source :Oilprices.com
MARKET MACROSCOPE | INVESTMENT PRODUCTS | APRIL 2021 15India Horizons All-star Portfolio
Portfolio Details:
Stock % Stock %
Bank Bees 10.4% Mahindra & Mahindra 2.2%
Reliance Industries 8.4% Thyrocare Technologies 2.2%
Infosys 6.0% Phoenix Mills 2.2%
Saregama India 4.8% Max Financial Services 2.1%
Jk Cement 3.8% Radico Khaitan 2.1%
Apollo Hospitals 3.6% Voltas 1.9%
Cash 3.5% KEC International 1.9%
Birla Corporation 3.3% Minda Industries 1.9%
TCS 3.3% Apollo Tyres 1.8%
Supreme Industries 3.2% Petronet LNG 1.6%
Zydus Wellness 3.0% Sun TV Network 1.5%
UltraTech Cement 2.9% Exide Industries 1.3%
Larsen & Toubro 2.8% Bharat Electronics 1.2%
Gujarat State Petronet 2.7% UPL 1.2%
State Bank of India 2.6% Jyothy Laboratories 1.1%
Laurus Labs 2.6% Tata Motors 1.1%
Bajaj Auto 2.4% Apar Industries 1.0%
Atul Ltd 2.3% ENIL 0.3%
MCAP Allocation Sector Allocation
BFSI 15%
Cash OIL & GAS 13%
3% AUTO 11%
CEMENT 10%
Small TECHNOLOGY 9%
Cap Large PHARMA /… 8%
19% Cap
MEDIA 7%
FMCG 6%
Mid Cap 45% CAP GOODS &… 6%
FERTILIZER &… 4%
33% CASH 3%
MISCELLANEOUS 3%
POWER 3%
RETAIL 2%
Performance
94.2%
68.0%
34.1%
30.1%
17.8% 20.0%
14.7% 12.3% 14.5% 15.9% 16.3%
13.1% 14.3%
1.6%0.8% 3.7%
1M 3M 6M 1Y 2Y 3Y 5Y Since Inception
India Horizons All-star Portfolio Sensex
Inception Date: 01-Oct-02, Returns less than 1 year are absolute, more than 1 year are CAGR
MARKET MACROSCOPE | INVESTMENT PRODUCTS | APRIL 2021 16India Horizons Bellwether Portfolio
Portfolio Details:
Stock % Stock %
Bank Bees 15.3% Thyrocare Technologies 2.2%
Reliance Industries 10.8% United Spirits 2.2%
Infosys 7.6% Voltas 2.1%
Cash 5.7% Power Finance Corp 1.9%
TCS 4.3% Huhtamaki PPL* 1.9%
State Bank of India 3.8% Petronet LNG 1.9%
Larsen & Toubro 3.6% NTPC 1.9%
ITC 3.5% Godrej Agrovet 1.8%
Bata India 3.3% Tata Motors 1.6%
Carborundum Universal 3.3% Exide Industries 1.5%
Mahindra & Mahindra 3.2% KEC International 1.4%
Gujarat State Petronet 3.0% Bharat Electronics 1.4%
Ultratech Cement 2.9% UPL Ltd 1.4%
Bajaj Auto 2.8% Jyothy Laboratories 1.0%
Sun TV Network 2.6%
Mcap Allocation Sector Allocation
BFSI 21%
Small Cash Oil & Gas 16%
Cap TECHNOLOGY 12%
6% CAP GOODS &… 10%
10% AUTO 9%
FMCG 8%
Mid Cap CASH 6%
17% RETAIL 3%
Large POWER 3%
Cap CEMENT 3%
MEDIA 3%
67% PHARMA /… 2%
MISCELLANEOUS 2%
FERTILIZER & CHEMICAL 1%
Performance
66.5%68.0%
30.1%
25.8%
14.5% 17.1%16.3%
13.4%14.3%
10.5% 13.1% 10.3%
7.3%
0.8% 3.7%
-0.6%
1M 3M 6M 1Y 2Y 3Y 5Y Since Inception
India Horizons Bellwether Portfolio Sensex
Inception Date: 01-Oct-02. Returns less than 1 year are absolute, more than 1 year are CAGR
MARKET MACROSCOPE | INVESTMENT PRODUCTS | APRIL 2021 17CAGR vs IRR vs TWIRR: Measuring Investment Performance
The biggest and most important part of portfolio management is the ability to measure returns.
Because only then is one able to compare performances and see who has done well and who has not.
There are various ways to calculate returns. While The Simple Rate of returns is actually not a real life
phenomenon, the others – CAGR, IRR, TWRR etc are used at different situations. Lets study them
below –
CAGR:
CAGR or compound annualised growth rate is the rate at which your investments have compounded
over the years. The operative word here is ‘Average’. If you know the initial value and the final value,
CAGR gives you the average rate at which the investment has grown every year.
CAGR Formula:
(End Market Value / Beginning Market Value) ^ (365 /(Ending Date - Beginning Date) – 1
One fundamental weakness of CAGR is that it needs an insulated box to be relevant. i.e, to calculate
CAGR for a period, the initial value and final value cannot be disturbed by a cash inflow or cash
outflow into the box. The moment that happens, CAGR stops holding any meaning. Thus, CAGR is
ideal at a security level, but less relevant at a portfolio level.
IRR / XIRR (interchangeable):
XIRR or Extended Internal Rate of Return are returns on investments where there are multiple
transactions taking place at different times.
XIRR is a very useful tool to calculate the performance of your Portfolio where the investments are
done based on availability of funds or as per prevailing opportunities in various asset classes.
Especially, returns on your mutual fund investments through a Systematic Investment Plan
/Systematic Transfer Plan can be calculated appropriately with an XIRR.
In MS Excel we can calculate XIRR with XIRR() function: XIRR(values, dates, guess)
TWRR:
Time-weighted rate of return (TWRR) is a method for calculating the compound growth rate of an
investment portfolio in the presence of external flows such as transfers of cash, securities or other
instruments in or out of the portfolio; capital infusion or withdrawal and interest or dividend
payments.
It is actually far more simple than people think. It is basically the return that the portfolio manager
is generating. The fact that you gave him more money at some times and withdrew money at
other times should not distort his performance. Unfortunately XIRR has that limitation. TWRR
takes care of this limitation.
How does it do it ? It just focuses on the various sub interval returns. It ignores the amounts. Thus
it consolidates all the returns of these subintervals and calculates the overall average return.
The basic TWRR formula for a sub-period / interval is:
= (Final Amount – Initial Amount) / Initial Amount
MARKET MACROSCOPE | INVESTMENT PRODUCTS | APRIL 2021 18CAGR vs IRR vs TWIRR: Measuring Investment Performance
The TWRR formula when multiple sub-periods are involved is:
TWRR = [(1 + rate of return from the 1st period) x (1 + rate of return from the 2nd period) x .. x (1
+ Rate of return from the nth period)] – 1
TWRR is particularly beneficial for public investment managers or fund managers who deal with public
securities. As they have no influence over the timing and amount of cash flows to an investment
portfolio, which makes TWRR an ideal parameter for measuring their performance.
The below illustrations depict the impact of bad and good timing of cash flows on XIRR, whereas
TWRR is unaffected by the timing of cash flows.
Bad timing of Inflows and Outflows: (Note the sum total of all cash flows is zero)
Monthly
Date Returns Cashflow Portfolio Value Portfolio NAV
30-Jun-19 100 100.00 100.00
31-Jul-19 5% 0 105.00 105.00
31-Aug-19 3% 20 128.15 108.15
30-Sep-19 -2% -20 105.59 105.99
31-Oct-19 3% 0 108.75 109.17
30-Nov-19 -1% -20 87.67 108.07
31-Dec-19 6% 20 112.93 114.56
31-Jan-20 -4% 20 128.41 109.98
29-Feb-20 -3% 0 124.56 106.68
31-Mar-20 2% 0 127.05 108.81
30-Apr-20 0% -20 107.05 108.81
31-May-20 15% 0 123.11 125.13
30-Jun-20 2% -20 105.57 127.64
31-Jul-20 7% 0 112.96 136.57
31-Aug-20 3% 20 136.35 140.67
30-Sep-20 -2% 0 133.62 137.85
31-Oct-20 1% 0 134.96 139.23
30-Nov-20 0% 0 134.96 139.23
31-Dec-20 0% -20 114.96 139.23
31-Jan-21 5% 20 140.70 146.19
28-Feb-21 -8% 0 129.45 134.50
31-Mar-21 3% 0 133.33 138.53
XIRR 17.8% Absolute TWRR 38.5%
Annualised TWRR 20.4%
As we can observe in the above table, the investments are made after an upward trend but
withdrawals are done after a downtrend month ( i.e. withdrawals at cheaper levels and investments at
slightly dearer levels). This impacts the XIRR negatively, whereas, TWRR calculates the performance
of the portfolio by neutralizing cash flow at every step and hence is not affected by the cash flows.
MARKET MACROSCOPE | INVESTMENT PRODUCTS | APRIL 2021 19CAGR vs IRR vs TWIRR: Measuring Investment Performance
Good timing of Inflows and Outflows: (Note the sum total of all cash flows is zero)
Monthly
Date Returns Cashflow Portfolio Value Portfolio NAV
30-Jun-19 100 100.00 100.00
31-Jul-19 5% 0 105.00 105.00
31-Aug-19 3% -20 88.15 108.15
30-Sep-19 -2% 20 106.39 105.99
31-Oct-19 3% 0 109.58 109.17
30-Nov-19 -1% 20 128.48 108.07
31-Dec-19 6% -20 116.19 114.56
31-Jan-20 -4% -20 91.54 109.98
29-Feb-20 -3% 0 88.80 106.68
31-Mar-20 2% 0 90.57 108.81
30-Apr-20 0% 20 110.57 108.81
31-May-20 15% 0 127.16 125.13
30-Jun-20 2% 20 149.70 127.64
31-Jul-20 7% 0 160.18 136.57
31-Aug-20 3% -20 144.99 140.67
30-Sep-20 -2% 0 142.09 137.85
31-Oct-20 1% 0 143.51 139.23
30-Nov-20 0% 0 143.51 139.23
31-Dec-20 0% 20 163.51 139.23
31-Jan-21 5% -20 151.68 146.19
28-Feb-21 -8% 0 139.55 134.50
31-Mar-21 3% 0 143.74 138.53
XIRR 23.0% Absolute TWRR 38.5%
Annualised TWRR 20.4%
As we can observe in the above table, the investments are made after a downtrend trend but
withdrawals are done post an uptrend, ( i.e. investments at cheaper levels and withdrawals at slightly
dearer levels). This impacts the XIRR positively, whereas, TWRR calculates the performance of the
portfolio by neutralizing cash flow at every step and hence is not affected by the cash flows.
The important factor to decide between the application of XIRR & TWRR is, whether an investor has
control on the cash flows. If the answer is no then he / she should use TWRR, if yes then XIRR is a
better choice.
Condition Evaluation
Portfolio TWRR < Benchmark returns
It depicts the Fund manager has failed to perform.
and
Portfolio XIRR < Benchmark returns
Portfolio TWRR < Benchmark returns It depicts the Fund manager has failed to perform but
but due to favorable/lucky deployment strategy by the investor, the
Portfolio XIRR > Benchmark returns portfolio has done well.
It depicts the Fund manager has performed well but
Portfolio TWRR > Benchmark returns
due to unfavorable/unlucky deployment strategy by the
but
investor, the portfolio has not done well. Thus the fund
Portfolio XIRR < Benchmark returns
manager should not be blamed in this case.
Portfolio TWRR > Benchmark returns
and It depicts the Fund manager has performed well.
Portfolio XIRR > Benchmark returns
MARKET MACROSCOPE | INVESTMENT PRODUCTS | APRIL 2021 20Crossword
1 2 3
4
5 6
7 8
9
10 11
12
13 14
15
Across
1. a type of financial statement that lists an entity’s assets, liabilities, and capital
4. any asset pledged for the repayment of a loan.
5. the inability of an entity to payback its due
9. ____________ bonds can be changed into another security, typically an equity
10. the difference between a dealer’s bid price and its ask price for a security
13. the price at which a dealer will sell a security from its inventory
14. gold or silver in the form of bars or ingots.
15. a negotiable, long‐dated, interest‐bearing financial instrument
Down
2. an entity enjoined to act on behalf of a principal in some business activity
3. any negotiable financial instrument, including debt, equity, and hybrid instruments
6. a percentage of the sale price of an asset paid to a broker for its brokering services.
7. sustained increases in the price level of commodities or services
8. an entity which owes something,
11. known volatility in the rate of return
12. a type of option derivative that gives the option holder the right but not the obligation to
purchase some predetermined asset at a predetermined strike price.
Note : Solution for the above crossword will be provided in next month’s newsletter
MARKET MACROSCOPE | INVESTMENT PRODUCTS | APRIL 2021 21Disclaimer Investment in securities market are subject to market risks, read all the related documents carefully before investing. This note has been prepared exclusively for the benefit and internal use of the recipient and does not carry any right of reproduction or disclosure. Neither this note nor any of its contents maybe used for any other purpose without the prior written consent of HDFC Securities Ltd (HSL) Information herein is believed to be reliable however HDFC Securities Ltd. does not warrant its completeness or accuracy. Although HDFC Securities Ltd. tries to ensure that all information and materials in relation to the products, services, facilities, offerings or otherwise provided as part of its website or through any other source of communication, is correct at the time of inclusion on the communication, it does not guarantee the accuracy of the information. Use of this presentation /note is at the sole risk of the user / client. The data and information provided on the website or in any presentation / note is not professional advice and should not be relied upon as such. HDFC Securities Ltd. may at any time edit, alter and or remove any information in whole or in part that may be available and that it shall not be held responsible for all or any actions that may subsequently result into any loss, damage and or liability. Nothing contained herein is to be construed as a recommendation to use any product or process, and HDFC Securities Ltd. makes no representation or warranty, express or implied that, the use thereof will not infringe any patent, or otherwise HDFC Securities Ltd. would have an exclusive discretion to decide the clients who would be entitled to its investing services. HDFC Securities Ltd. also reserves the right to decide on the criteria based on which clients would be chosen to participate in these services. HDFC Securities Ltd. is incorporated under the regulatory laws of India and hence adheres to the same laws for entering into or executing an agreement with the client This note does not purport to contain all the information that the recipient may require. Recipients should not construe any of the contents herein as advice relating to business, financial, legal, taxation, or investment matters and are advised to consult their own business, financial, legal, taxation and other advisors concerning the company. This note does not constitute an offer for sale, or an invitation to subscribe for, or purchase equity shares or other assets or securities of the company and the information contained herein shall not form the basis of any contract. It is also not meant to be or to constitute any offer for any transaction. As a distributor, HDFC Securities Ltd. does not assume any responsibility or liability arising from the sale of any product and the investor's contract for purchase/sale is directly with the product provider. HDFC Securities Ltd. may earn a distribution fee from the product provider on completion of sale of such products. To reiterate, HDFC Securities Ltd. only acts as a Distributor. There is no element of advisory involved. MARKET MACROSCOPE | INVESTMENT PRODUCTS | APRIL 2021 22
You can also read